Machine Learning In Retail Market Size 2025-2029
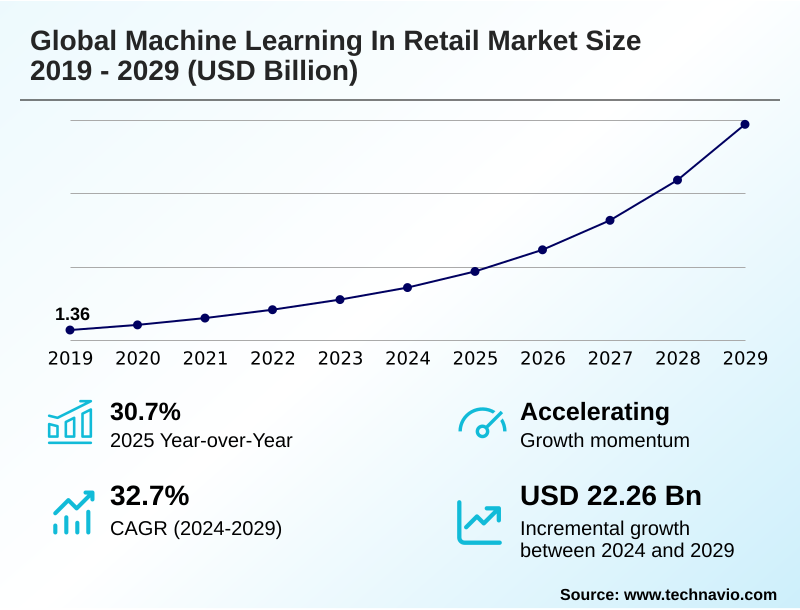
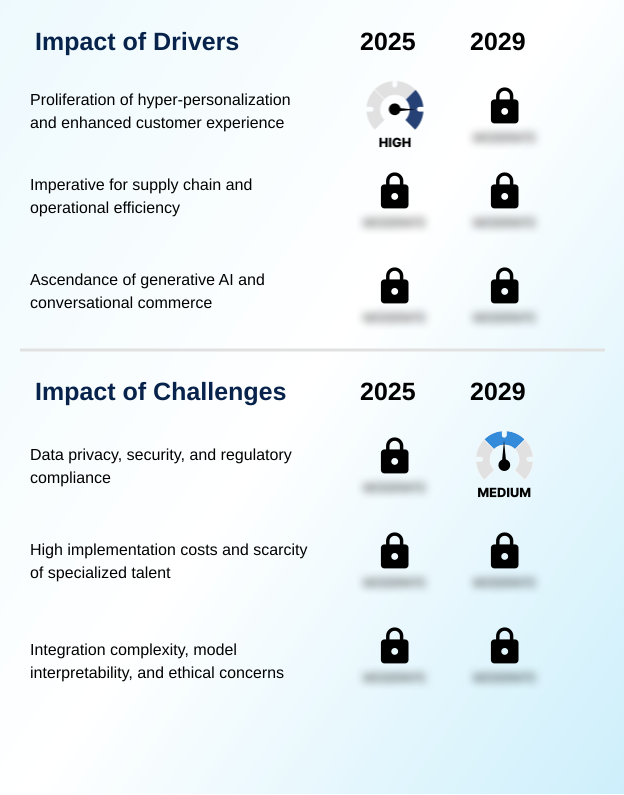
The machine learning in retail market size is valued to increase by USD 22.26 billion, at a CAGR of 32.7% from 2024 to 2029. Proliferation of hyper-personalization and enhanced customer experience will drive the machine learning in retail market.
Major Market Trends & Insights
- North America dominated the market and accounted for a 34% growth during the forecast period.
- By Component - Software segment was valued at USD 3.86 billion in 2023
- By Deployment - Cloud-based segment accounted for the largest market revenue share in 2023
Market Size & Forecast
- Market Opportunities: USD 28.05 billion
- Market Future Opportunities: USD 22.26 billion
- CAGR from 2024 to 2029 : 32.7%
Market Summary
- The machine learning in retail market is rapidly evolving from a niche technology into a core business function, driven by the strategic imperatives of operational efficiency and delivering hyper-personalization at scale. This transformation is powered by significant advancements in predictive analytics and the rise of generative artificial intelligence, enabling retailers to shift from reactive decision-making to proactive, data-informed strategies.
- Key applications such as supply chain optimization and demand forecasting are critical for minimizing costs and ensuring product availability. For instance, a typical business use case involves leveraging computer vision for in-store analytics to analyze shopper behavior and optimize layouts, which directly impacts sales.
- This is complemented by customer segmentation and recommendation engines that drive engagement and customer lifetime value prediction. However, the integration of more complex technologies like deep learning and large language models introduces significant challenges.
- These include the high cost of implementation, concerns over data privacy requiring techniques like data anonymization, and the need for algorithmic transparency to build trust and comply with regulations. Successfully deploying solutions from fraud detection to intelligent chatbots requires a robust AI governance framework to manage these complexities effectively.
What will be the Size of the Machine Learning In Retail Market during the forecast period?
Get Key Insights on Market Forecast (PDF) Request Free Sample
How is the Machine Learning In Retail Market Segmented?
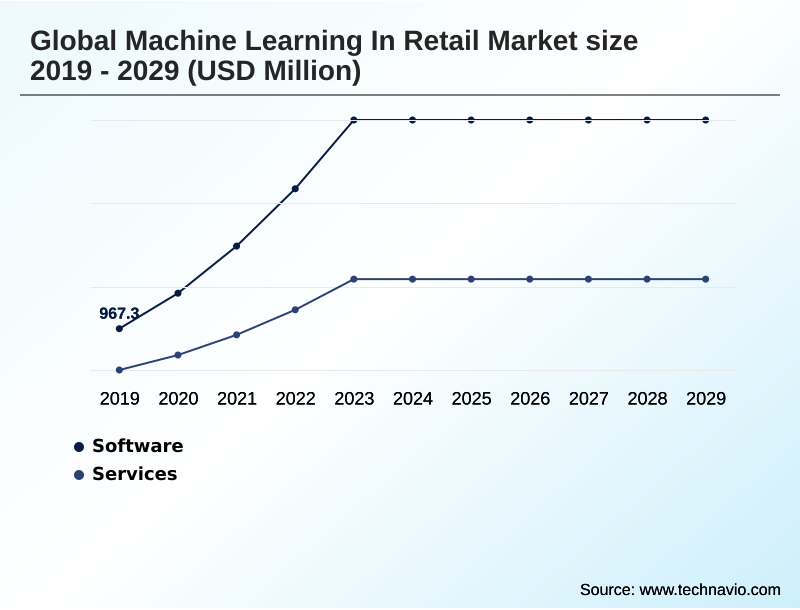
The machine learning in retail industry research report provides comprehensive data (region-wise segment analysis), with forecasts and estimates in "USD million" for the period 2025-2029, as well as historical data from 2019-2023 for the following segments.
- Component
- Software
- Services
- Deployment
- Cloud-based
- On-premises
- End-user
- FMCG
- Electronics
- Apparel
- Others
- Geography
- North America
- US
- Canada
- Mexico
- Europe
- Germany
- UK
- France
- APAC
- China
- Japan
- India
- Middle East and Africa
- Saudi Arabia
- UAE
- South Africa
- South America
- Brazil
- Colombia
- Argentina
- Rest of World (ROW)
- North America
By Component Insights
The software segment is estimated to witness significant growth during the forecast period.
The software component is the engine of the machine learning in retail market, defined by algorithms and platforms enabling intelligent automation. Innovation is centered on delivering hyper-personalization and enabling conversational commerce through tools like natural language processing.
Key applications include demand forecasting to optimize inventory and dynamic pricing engines that react to market shifts.
In physical stores, computer vision powers in-store analytics and frictionless checkout systems, with deployments showing up to a 20% reduction in customer wait times.
Algorithms based on collaborative filtering enhance recommendation accuracy, while logistical software focuses on complex challenges such as last-mile delivery optimization, creating a highly dynamic and competitive software landscape.
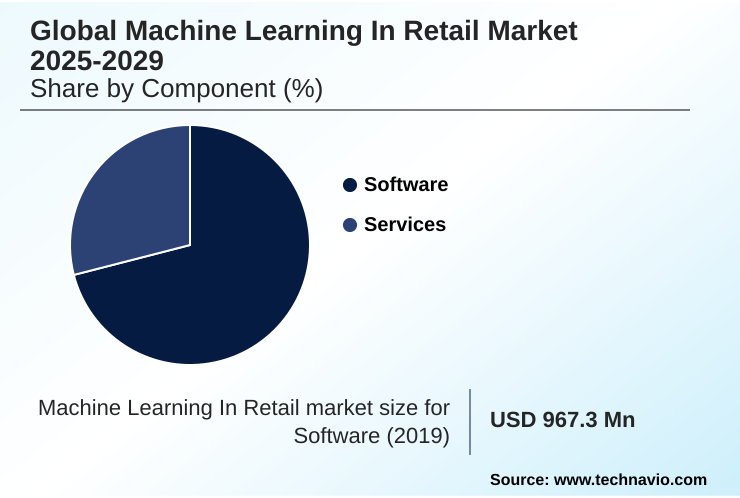
The Software segment was valued at USD 3.86 billion in 2023 and showed a gradual increase during the forecast period.
Regional Analysis
North America is estimated to contribute 34% to the growth of the global market during the forecast period.Technavio’s analysts have elaborately explained the regional trends and drivers that shape the market during the forecast period.
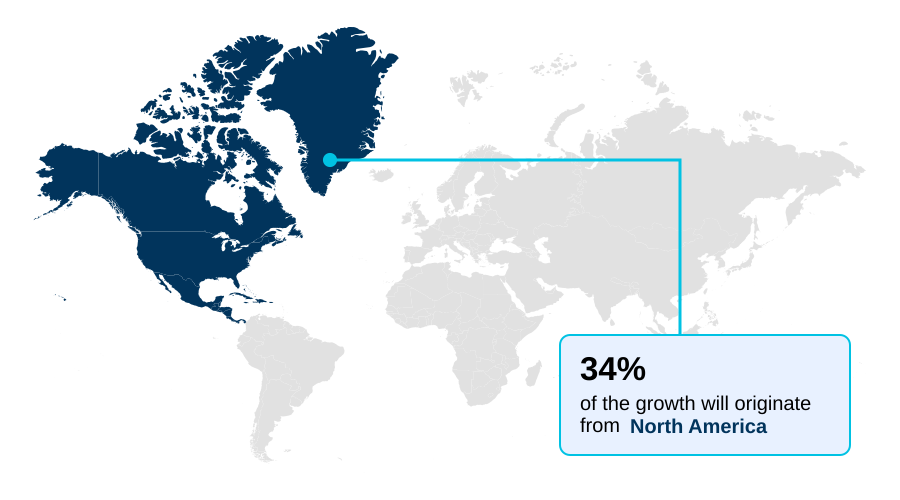
See How Machine Learning In Retail Market Demand is Rising in North America Request Free Sample
North America leads the machine learning in retail market, accounting for 34.0% of the incremental growth, driven by heavy investment in technologies that enable context-aware engagement and personalized styling.
Europe follows, with a strong focus on regulatory compliance, fostering innovation in privacy-preserving ml techniques like federated learning and demanding explainable AI (XAI).
The APAC region is the fastest-growing, with its mobile-first economies rapidly deploying intelligent chatbots and advanced anomaly detection models for e-commerce.
Across regions, the application of reinforcement learning for dynamic optimization is a common thread, though adoption varies based on regional infrastructure and regulatory maturity.
Market Dynamics
Our researchers analyzed the data with 2024 as the base year, along with the key drivers, trends, and challenges. A holistic analysis of drivers will help companies refine their marketing strategies to gain a competitive advantage.
- Strategic investment in the machine learning in retail market is moving toward highly specialized applications that deliver measurable ROI. The implementation of computer vision for shelf monitoring and predictive analytics for inventory stockouts is becoming critical for maintaining operational excellence. On the customer-facing side, hyper-personalization in fashion retail and AI-powered personalized styling services are setting new standards for engagement.
- Internally, retailers are using generative AI for marketing copy to streamline content creation, while NLP for customer service chatbots improves efficiency. A key focus is on risk management, with deep learning for fraud prevention and anomaly detection in e-commerce transactions being essential for secure digital commerce.
- The use of real-time analytics for foot traffic informs merchandising decisions, which are further refined by customer segmentation for targeted campaigns. The logistical backbone is strengthened by optimizing last-mile delivery routes and building resilient AI-driven supply chains. However, these advancements bring challenges, such as managing algorithmic bias in personalization, which necessitates strong AI governance in retail applications.
- Firms are now closely evaluating the ROI of frictionless checkout systems and leveraging assortment optimization using predictive models. The technology stack is also evolving, with an emphasis on MLOps for retail model deployment and privacy-enhancing methods like federated learning for data privacy, alongside explorations into dynamic pricing using reinforcement learning and virtual try-on technology advancements.
- Systems focused on machine learning for demand sensing are proving to be more than twice as effective as traditional forecasting methods in volatile markets.
What are the key market drivers leading to the rise in the adoption of Machine Learning In Retail Industry?
- The market is primarily driven by the proliferation of hyper-personalization strategies aimed at enhancing the overall customer experience.
- The imperative for an integrated omnichannel retail strategy is a major driver, with firms using predictive analytics for customer segmentation and customer churn prediction.
- Advanced deep learning and large language models are enhancing click-and-collect optimization, with some retailers reporting a 20% increase in fulfillment speed. In warehouses, the deployment of autonomous mobile robots for real-time inventory tracking has reduced picking errors by over 30%.
- These technologies provide granular basket analysis, enabling retailers to refine their strategies and deliver a seamless experience across all touchpoints, which is critical for retaining customers in a competitive environment.
What are the market trends shaping the Machine Learning In Retail Industry?
- The market is shaped by the move toward hyper-personalization at scale, a transformative trend fueled by the capabilities of generative AI.
- A primary trend is the adoption of generative artificial intelligence, moving beyond simple recommendation engines to power sophisticated AI-powered search and visual search technology. Retailers are leveraging these tools for dynamic promotional planning and assortment optimization, leading to a reported 15% improvement in campaign engagement.
- Concurrently, supply chain optimization and inventory management are being revolutionized by AI, with some firms achieving a 25% reduction in stockout incidents. These systems also enhance fraud detection capabilities and provide deeper insights into customer lifetime value prediction, fundamentally reshaping operational and customer-facing strategies.
What challenges does the Machine Learning In Retail Industry face during its growth?
- The industry's growth faces a significant challenge from complex issues surrounding data privacy, security, and evolving regulatory compliance.
- A significant challenge is the complexity of implementation, requiring a robust AI governance framework and mature MLOps practices. Ensuring algorithmic transparency is critical, especially as retailers deploy prescriptive analytics and real-time analytics for pricing and promotions.
- The quest for supply chain resilience is pushing the limits of current models, while consumer-facing tech like virtual try-on demands high-quality sentiment analysis to gauge effectiveness. Furthermore, implementing effective data anonymization techniques to comply with privacy regulations adds another layer of technical difficulty.
- Without these foundational elements, scaling innovations in areas like AI-driven merchandising proves difficult, with initial project failure rates sometimes exceeding 40%.
Exclusive Technavio Analysis on Customer Landscape
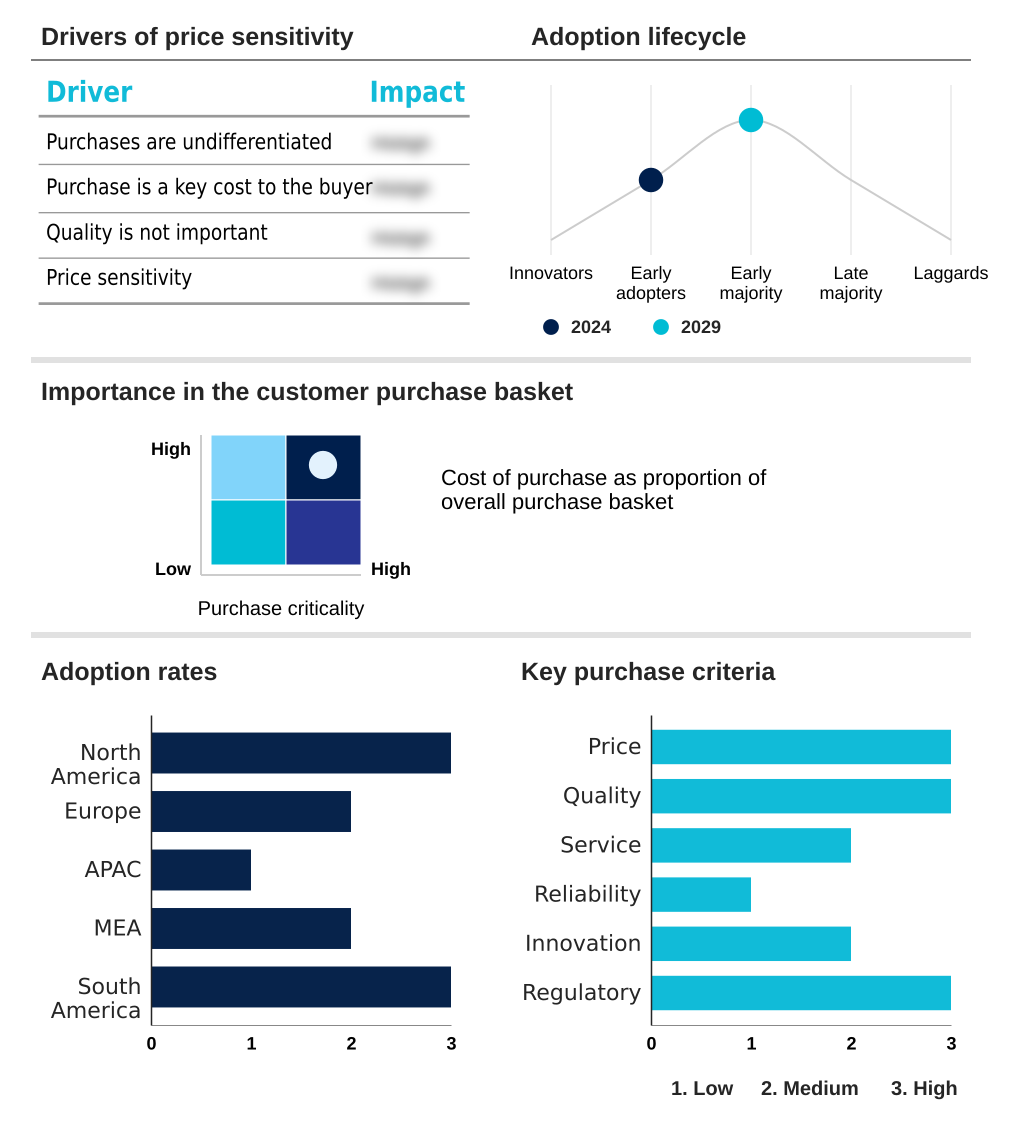
The machine learning in retail market forecasting report includes the adoption lifecycle of the market, covering from the innovator’s stage to the laggard’s stage. It focuses on adoption rates in different regions based on penetration. Furthermore, the machine learning in retail market report also includes key purchase criteria and drivers of price sensitivity to help companies evaluate and develop their market growth analysis strategies.
Customer Landscape of Machine Learning In Retail Industry
Competitive Landscape
Companies are implementing various strategies, such as strategic alliances, machine learning in retail market forecast, partnerships, mergers and acquisitions, geographical expansion, and product/service launches, to enhance their presence in the industry.
Adobe Inc. - Offerings center on an AI-powered search and discovery platform, utilizing machine learning to deliver highly relevant, personalized ranking and typo tolerance for retail applications.
The industry research and growth report includes detailed analyses of the competitive landscape of the market and information about key companies, including:
- Adobe Inc.
- Algolia Inc.
- Amazon Web Services Inc.
- BloomReach Inc.
- Blue Yonder Group Inc.
- Consultadoria e Inovacao Tecnologica S.A.
- Databricks Inc.
- Google Cloud
- H2O.ai Inc.
- Microsoft Corp.
- Oracle Corp.
- SAP SE
- SAS Institute Inc.
- Sephora USA Inc.
- Snowflake Inc.
- Stylumia Intelligence Technology Pvt Ltd
- Teradata Corp.
- Walmart Inc.
Qualitative and quantitative analysis of companies has been conducted to help clients understand the wider business environment as well as the strengths and weaknesses of key industry players. Data is qualitatively analyzed to categorize companies as pure play, category-focused, industry-focused, and diversified; it is quantitatively analyzed to categorize companies as dominant, leading, strong, tentative, and weak.
Recent Development and News in Machine learning in retail market
- In November, 2024, Walmart Inc. announced the integration of an advanced generative AI shopping assistant into its primary mobile app, designed to offer personalized styling advice and project-based shopping lists.
- In January, 2025, GXO Logistics Inc. confirmed a USD 300 million investment to deploy over 5,000 autonomous mobile robots and AI-powered vision systems across its North American and European fulfillment centers serving retail clients.
- In March, 2025, Microsoft Corp. completed the acquisition of a computer vision startup specializing in frictionless checkout technology, signaling a push into autonomous retail solutions.
- In May, 2025, AiFi announced its strategic entry into the Japanese market through a partnership with a major convenience store chain, planning to roll out 100 autonomous stores by the end of the year.
Dive into Technavio’s robust research methodology, blending expert interviews, extensive data synthesis, and validated models for unparalleled Machine Learning In Retail Market insights. See full methodology.
| Market Scope | |
|---|---|
| Page number | 292 |
| Base year | 2024 |
| Historic period | 2019-2023 |
| Forecast period | 2025-2029 |
| Growth momentum & CAGR | Accelerate at a CAGR of 32.7% |
| Market growth 2025-2029 | USD 22260.3 million |
| Market structure | Fragmented |
| YoY growth 2024-2025(%) | 30.7% |
| Key countries | US, Canada, Mexico, Germany, UK, France, Italy, Spain, The Netherlands, China, Japan, India, South Korea, Australia, Indonesia, Saudi Arabia, UAE, South Africa, Israel, Turkey, Brazil, Colombia and Argentina |
| Competitive landscape | Leading Companies, Market Positioning of Companies, Competitive Strategies, and Industry Risks |
Research Analyst Overview
- The machine learning in retail market is defined by a rapid integration of sophisticated technologies into core operations. Boardroom decisions now frequently center on the strategic deployment of generative artificial intelligence and large language models to gain a competitive edge.
- The application of predictive analytics for demand forecasting and inventory management is standard, while prescriptive analytics and reinforcement learning are being used for complex supply chain optimization and dynamic pricing. In-store, computer vision enables real-time analytics, while natural language processing powers sentiment analysis and advanced recommendation engines based on collaborative filtering.
- Behind the scenes, MLOps frameworks are crucial for managing deployments, from deep learning-based fraud detection and anomaly detection models to customer segmentation. The increasing focus on privacy has spurred the adoption of federated learning and stringent data anonymization techniques.
- As a result, the demand for explainable AI (XAI) has surged, with firms that implement such transparent systems reporting a 25% higher rate of consumer trust. This complex ecosystem also relies on autonomous mobile robots to further automate processes.
What are the Key Data Covered in this Machine Learning In Retail Market Research and Growth Report?
-
What is the expected growth of the Machine Learning In Retail Market between 2025 and 2029?
-
USD 22.26 billion, at a CAGR of 32.7%
-
-
What segmentation does the market report cover?
-
The report is segmented by Component (Software, and Services), Deployment (Cloud-based, and On-premises), End-user (FMCG, Electronics, Apparel, and Others) and Geography (North America, Europe, APAC, Middle East and Africa, South America)
-
-
Which regions are analyzed in the report?
-
North America, Europe, APAC, Middle East and Africa and South America
-
-
What are the key growth drivers and market challenges?
-
Proliferation of hyper-personalization and enhanced customer experience, Data privacy, security, and regulatory compliance
-
-
Who are the major players in the Machine Learning In Retail Market?
-
Adobe Inc., Algolia Inc., Amazon Web Services Inc., BloomReach Inc., Blue Yonder Group Inc., Consultadoria e Inovacao Tecnologica S.A., Databricks Inc., Google Cloud, H2O.ai Inc., Microsoft Corp., Oracle Corp., SAP SE, SAS Institute Inc., Sephora USA Inc., Snowflake Inc., Stylumia Intelligence Technology Pvt Ltd, Teradata Corp. and Walmart Inc.
-
Market Research Insights
- The market is characterized by a dynamic shift toward enhancing the customer experience through an integrated omnichannel retail strategy. The adoption of hyper-personalization at scale has shown to increase customer retention rates by up to 15%. This is increasingly delivered through conversational commerce and AI-powered search, which improve product discovery.
- Meanwhile, technologies enabling frictionless checkout in physical stores are gaining traction, with some deployments reducing average checkout times by over 90% compared to traditional methods. These innovations reflect a strategic pivot toward using AI not just for backend optimization but as a primary interface for customer interaction, directly influencing purchasing decisions and brand loyalty.
We can help! Our analysts can customize this machine learning in retail market research report to meet your requirements.
 RIA -
RIA - 
