Marine Robots Market Analysis North America, Europe, APAC, South America, Middle East and Africa - US, Canada, China, UK, France, Germany, Japan, South Korea, Australia, Russia - Size and Forecast 2024-2028

Marine Robots Market Analysis North America, Europe, APAC, South America, Middle East and Africa - US, Canada, China, UK, France, Germany, Japan, South Korea, Australia, Russia - Size and Forecast 2024-2028

Published: Sep 2024 216 Pages SKU: IRTNTR80180

Market Overview at a Glance

$4.94 B
Market Opportunity
15.6%
CAGR
14.9
YoY growth 2023-2024(%)

Marine Robots Market Size 2024-2028 

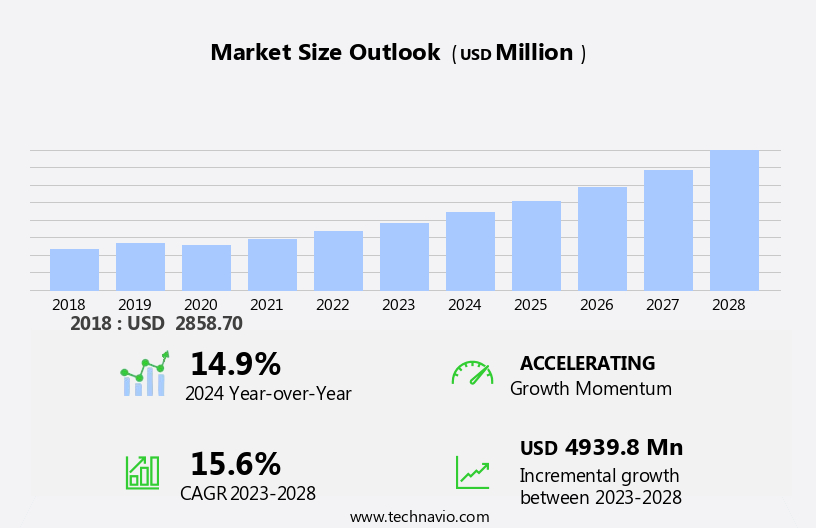
The marine robots market size is forecast to increase by USD 4.94 billion at a CAGR of 15.6% between 2023 and 2028. The marine robot market is experiencing significant growth due to increasing concerns over marine pollution and the need for efficient surveillance, mine detection, and offshore inspections. Advancements in artificial intelligence (AI) and machine learning have led to the integration of sensor technology in marine robots, enabling them to collect and analyze data in real-time. The market is experiencing significant growth due to several key trends and factors. One of the primary drivers is the increasing investments in the unmanned surface vehicle (USV) industry, which is expected to boost the demand for marine robots. Additionally, the expanding applications of marine robots in various industries, such as oil and gas, defense, and research, is fueling market growth. Despite this, the expanding applications of marine robots in various industries, including oil and gas, defense, and research, are driving market demand.

What will be the Size of the Market During the Forecast Period?

Marine Robots Market Size

 Request Free Sample

The market is witnessing significant growth due to the increasing demand for underwater surveillance, drilling, repair, and maintenance applications. These robots, also known as Unmanned Underwater Vehicles (UUVs), are used in various sectors, including defense applications, military, law enforcement, and marine research. The marine robots market is experiencing significant growth, driven by the increasing demand for unmanned underwater vehicles (UUVs) in offshore oil and gas exploration. These UUVs play a critical role in the oil and gas sector, providing efficient and cost-effective solutions for deep-water exploration, inspection, and maintenance of underwater infrastructure. Marine robots, including both heavy-weight vehicles for large-scale operations and lightweight/man-portable models for more accessible tasks, are transforming the oil and gas industry. The ability of UUVs to operate in challenging environments reduces the need for human intervention, enhancing safety and operational efficiency. As offshore exploration activities intensify, the adoption of marine robots continues to rise, offering advanced technology to support the oil and gas industry's complex needs.

Market Segmentation

The market research report provides comprehensive data (region-wise segment analysis), with forecasts and estimates in "USD million" for the period 2024-2028, as well as historical data from 2018-2022 for the following segments.

  • Application
    • Defense and security
    • Commercial
    • Scientific research
    • Environmental monitoring
    • Others
  • Type
    • Autonomous underwater vehicle
    • Remotely operated vehicles
    • Unmanned surface vehicles
    • Hybrid vehicles
  • Geography
    • North America
      • Canada
      • US
    • Europe
      • Germany
      • UK
      • France
    • APAC
      • China
      • Japan
      • South Korea
    • South America
    • Middle East and Africa

By Application Insights

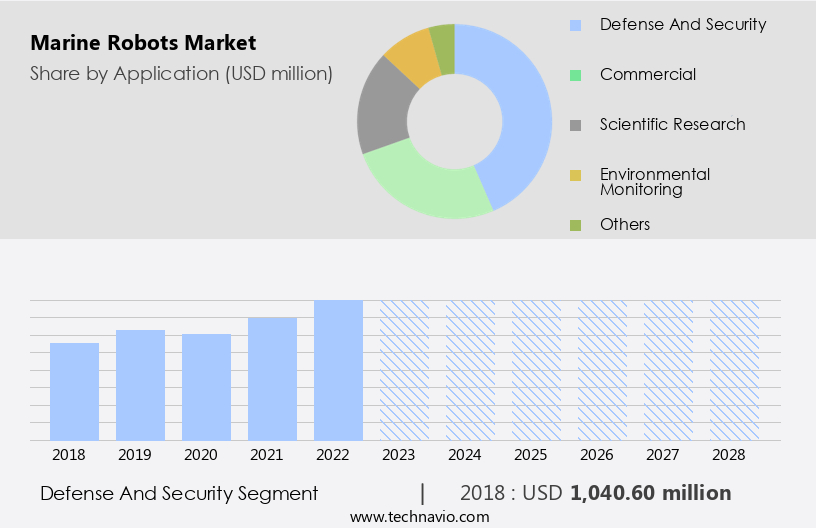
The defense and security segment is estimated to witness significant growth during the forecast period. The maritime economy is witnessing a notable expansion in the market, driven by the integration of advanced technologies such as Remotely Operated Vehicles (ROVs) and Autonomous Underwater Vehicles (AUVs). Historically, the defense and security sector has overlooked marine robot innovation, with a shift in focus towards desert environments following the end of the Cold War. However, this trend is changing as the strategic significance of marine robots in bolstering naval capabilities and safeguarding maritime security is being recognized. Evidence of this renewed interest includes recent acquisitions and investments in the industry. Offshore energy projects and climate research are also major contributors to the growth of the market.

Oceaneering, Military and Defense, and Fisheries Management are key industries leveraging these technologies to optimize operations and enhance productivity. Artificial Intelligence (AI) is increasingly being integrated into marine robots to improve efficiency and accuracy. Furthermore, marine resource management and environmental conservation are benefiting from the use of these robots to monitor and protect marine ecosystems. The market is poised for continued growth, offering significant opportunities for businesses and investors.

Marine Robots Market Size

Get a glance at the market share of various segments Request Free Sample

The defense and security segment accounted for USD 1.04 billion in 2018 and showed a gradual increase during the forecast period.

Regional Insights

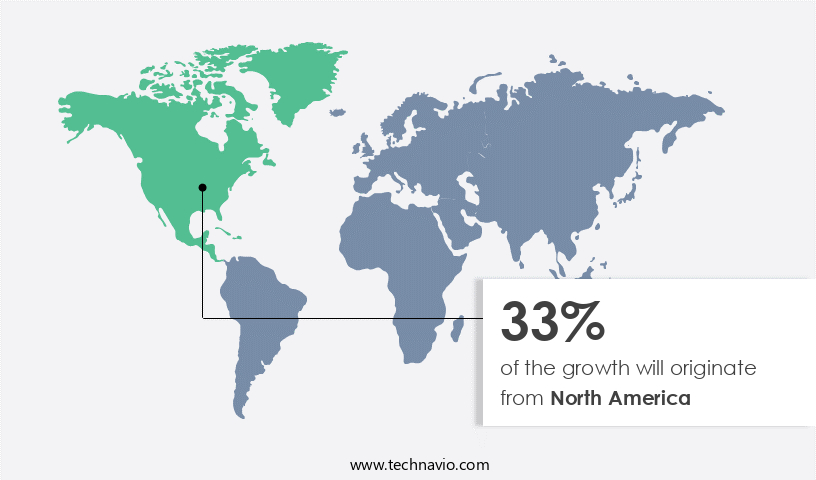
North America is estimated to contribute 33% to the growth of the global market during the forecast period. Technavio's analysts have elaborately explained the regional trends and drivers that shape the market during the forecast period.

Marine Robots Market Share by Geography

For more insights on the market share of various regions Request Free Sample

The market in North America is witnessing significant growth due to the advancement of underwater robotics technology and the increasing demand for underwater surveillance, drilling, repair, and maintenance in various industries. Defense applications, including military and law enforcement, are major contributors to this market's expansion in the region. GrayMatter Robotics Inc., a leading startup in this field, recently raised USD 45 million in funding to revolutionize factory automation. The challenging and hazardous nature of manufacturing jobs, which require extensive training, has intensified this issue, leading to a backlog of orders. Marine robots offer a solution to these challenges by providing efficient underwater operations, reducing the need for human intervention, and increasing operational efficiency. The market is expected to continue growing, driven by technological advancements and the increasing demand for cost-effective and efficient maritime solutions.

Our researchers analyzed the data with 2023 as the base year, along with the key drivers, trends, and challenges. A holistic analysis of drivers will help companies refine their marketing strategies to gain a competitive advantage.

Market Driver

Growing investments in unmanned surface vehicle industry is the key driver of the market. The market, specifically the segment of Unmanned Surface Vehicles (USVs), is experiencing substantial growth due to escalating investments from investors. These funds are essential for enhancing the technology, deployment, and commercialization of USVs, which play a vital role in applications such as maritime security, environmental monitoring, and commercial shipping. A prime illustration of this trend is Nauticus Robotics, a US-based company specializing in ocean robot technology, securing up to USD 20 million in term loan financing from existing investors.

This financing will boost the capabilities of Nauticus' USV fleet, enabling advanced navigation and communication systems. In deep water conditions, USVs employ various technologies such as electromagnetic waves and free-space optical (FSO) for communication and sound waves for navigation. USVs, also known as Autonomous Underwater Vehicles (AUVs), are revolutionizing the marine industry by offering efficient and cost-effective solutions for complex tasks.

Market Trends

Expanding applications of marine robots is the upcoming trend in the market. The market is witnessing significant growth due to the increasing demand for advanced technologies in maritime applications. Traditional methods for addressing marine pollution, such as manual labor and chemical dispersants, have limitations in terms of efficiency and effectiveness, particularly in large-scale oil spills or hard-to-reach areas. These challenges are compounded by adverse weather conditions and ocean currents, leading to delays and increased costs. Marine robots, specifically those utilizing swarm technology, provide a revolutionary solution to these issues. Swarm robots can cover vast areas more efficiently than single robots, and they can adapt to changing conditions, enhancing the overall performance of marine pollution cleanup efforts.

Furthermore, marine robots are increasingly being used for surveillance, mine detection, offshore inspections, subsea maintenance, and ocean monitoring. Advancements in artificial intelligence (AI), machine learning, and sensor technology have significantly improved the capabilities of marine robots. These technologies enable marine robots to analyze data in real-time, identify patterns, and make decisions autonomously. Marine conservation organizations are also utilizing marine robots for research and monitoring purposes, contributing to the preservation of marine ecosystems. In conclusion, the market is experiencing substantial growth due to the need for more efficient and effective solutions in maritime operations. Marine robots, particularly those utilizing swarm technology, offer significant advantages in addressing marine pollution, surveillance, mine detection, offshore inspections, subsea maintenance, and ocean monitoring.

Market Challenge

High capital cost is a key challenge affecting market growth. The marine robots industry encounters considerable financial challenges due to the substantial expenses involved in acquiring, deploying, and maintaining these advanced technologies. The capital investment required for marine robots is considerable, especially for models engineered for offshore deep-sea oil exploration and undersea mineral exploration. These robots are outfitted with sophisticated sensors, advanced propulsion systems, and durable materials to endure the challenging underwater environment, contributing to their high costs. For example, the price range for custom underwater drone robots can significantly differ, with entry-level models priced around USD 4,999 and advanced versions reaching up to USD 19,999. Even standard kits, which contain essential components for underwater education or activities, are priced around USD 2,999.

Oil firms, such as Lukoil, and mining companies are increasingly turning to marine robots for deep-sea exploration and environmental monitoring in the Caspian Sea and other bodies of water. Marine research institutions and organizations are also utilizing these technologies for various purposes, further expanding the market's reach. Despite the initial investment, the cost-effective benefits and increased efficiency offered by marine robots make them a valuable investment for businesses and research institutions.

Exclusive Customer Landscape

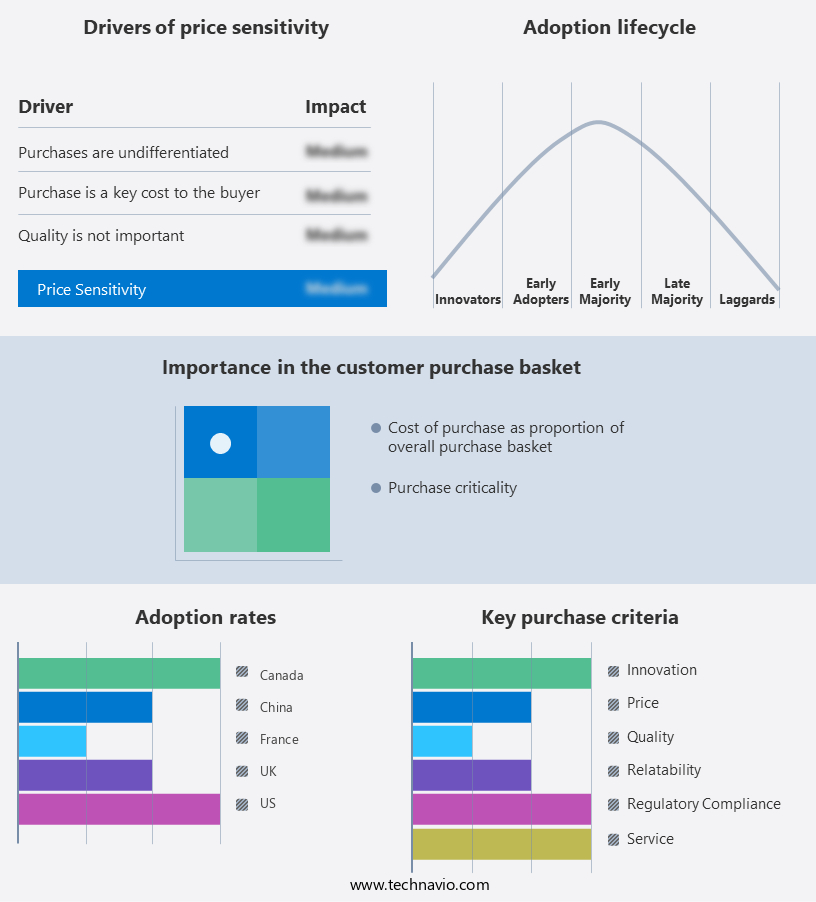
The market forecasting report includes the adoption lifecycle of the market, covering from the innovator's stage to the laggard's stage. It focuses on adoption rates in different regions based on penetration. Furthermore, the report also includes key purchase criteria and drivers of price sensitivity to help companies evaluate and develop their market growth analysis strategies.

Marine Robots Market Share by Geography

 Customer Landscape

Key Companies & Market Insights

Companies are implementing various strategies, such as strategic alliances, partnerships, mergers and acquisitions, geographical expansion, and product/service launches, to enhance their presence in the market.

Anduril Industries Inc. - The company offers marine robots, such as autonomous underwater vehicles, which are utilized for defense and commercial missions.

The market research and growth report includes detailed analyses of the competitive landscape of the market and information about key companies, including:

  • Advanced Navigation Pty Ltd.
  • BeeX
  • Blue Robotics Inc.
  • ECA Group
  • ecoSUB Robotics Ltd.
  • EyeROV
  • General Dynamics Mission Systems Inc.
  • GrayMatter Robotics
  • Hanwha Systems Co.
  • International Submarine Engineering Ltd.
  • Kongsberg Gruppen ASA
  • L3Harris Technologies Inc.
  • Liquid Robotics Inc.
  • Marine Robotic Technologies Ltd
  • Maritime Robotics
  • Oceanalpha Group Ltd.
  • Planys Technologies
  • Saab AB
  • Saildrone Inc.
  • Sea Machines Robotics, Inc
  • SeaSatellites, Inc.
  • Teledyne Marine Technologies Inc
  • UFRJ Nautilus

Qualitative and quantitative analysis of companies has been conducted to help clients understand the wider business environment as well as the strengths and weaknesses of key market players. Data is qualitatively analyzed to categorize companies as pure play, category-focused, industry-focused, and diversified; it is quantitatively analyzed to categorize companies as dominant, leading, strong, tentative, and weak.

Research Analyst Overview

Underwater robotics is a rapidly growing market, driven by the increasing demand for underwater surveillance, drilling, repair, and maintenance in various industries. This includes defense applications, military, law enforcement, and commercial exploration. Autonomous underwater vehicles (AUVs) and Unmanned Underwater Vehicles (UUVs) are becoming increasingly popular due to their ability to navigate and communicate effectively in deep water conditions. Navigation and communication systems utilize electromagnetic waves and free-space optical (FSO) technology, while underwater vehicles rely on sound waves for navigation. artificial intelligence (AI) and machine learning are being integrated into marine robotics to enhance their capabilities, including mine detection, environmental monitoring, and marine pollution surveillance.

Deep-sea exploration is a significant market for marine robotics, with mining companies and oil firms such as Nautilus Minerals and Lukoil investing in cost-effective systems for offshore deep-sea oil and undersea mineral exploration in the Caspian Sea and other locations. Subsea maintenance and ocean monitoring are also critical applications, with companies like Oceaneering focusing on automation and robotics for offshore inspections and marine resource management. Environmental assessment, security, search and salvage, archaeology, and climate research are other areas where marine robotics are making a significant impact. Robotics automation technologies are transforming underwater inspections, subsea structural examination, and marine conservation efforts. Sensors and imaging systems are essential components of these systems, providing valuable data for marine research and maritime economy development.

Market Scope

Report Coverage

Details

Page number

216

Base year

2023

Historic period

2018-2022

Forecast period

2024-2028

Growth momentum & CAGR

Accelerate at a CAGR of 15.6%

Market growth 2024-2028

USD 4.94 billion

Market structure

Fragmented

YoY growth 2023-2024(%)

14.9

Regional analysis

North America, Europe, APAC, South America, and Middle East and Africa

Performing market contribution

North America at 33%

Key countries

US, Canada, China, UK, France, Germany, Japan, South Korea, Australia, and Russia

Competitive landscape

Leading Companies, Market Positioning of Companies, Competitive Strategies, and Industry Risks

Key companies profiled

Advanced Navigation Pty Ltd., Anduril Industries Inc., BeeX, Blue Robotics Inc., ECA Group, ecoSUB Robotics Ltd., EyeROV, General Dynamics Mission Systems Inc., GrayMatter Robotics, Hanwha Systems Co., International Submarine Engineering Ltd., Kongsberg Gruppen ASA, L3Harris Technologies Inc., Liquid Robotics Inc., Marine Robotic Technologies Ltd, Maritime Robotics, Oceanalpha Group Ltd., Planys Technologies, Saab AB, Saildrone Inc., Sea Machines Robotics, Inc, SeaSatellites, Inc., Teledyne Marine Technologies Inc, and UFRJ Nautilus

Market dynamics

Parent market analysis, market growth inducers and obstacles, market forecast, fast-growing and slow-growing segment analysis, COVID-19 impact and recovery analysis and future consumer dynamics, market condition analysis for the forecast period

Customization purview

If our market report has not included the data that you are looking for, you can reach out to our analysts and get segments customized.

Request Free Sample

What are the Key Data Covered in this Market Research and Growth Report?

  • CAGR of the market during the forecast period
  • Detailed information on factors that will drive the market growth and forecasting between 2024 and 2028
  • Precise estimation of the size of the market  and its contribution of the market in focus to the parent market
  • Accurate predictions about upcoming market growth and trends and changes in consumer behaviour
  • Growth of the market across North America, Europe, APAC, South America, and Middle East and Africa
  • Thorough analysis of the market's competitive landscape and detailed information about companies
  • Comprehensive analysis of factors that will challenge the growth of market companies

We can help! Our analysts can customize this market research report to meet your requirements. Get in touch

1 Executive Summary

  • 1.1 Market overview
    • Executive Summary - Chart on Market Overview
    • Executive Summary - Data Table on Market Overview
    • Executive Summary - Chart on Global Market Characteristics
    • Executive Summary - Chart on Market by Geography
    • Executive Summary - Chart on Market Segmentation by Application
    • Executive Summary - Chart on Market Segmentation by Type
    • Executive Summary - Chart on Incremental Growth
    • Executive Summary - Data Table on Incremental Growth
    • Executive Summary - Chart on Company Market Positioning

2 Technavio Analysis

  • 2.1 Analysis of price sensitivity, lifecycle, customer purchase basket, adoption rates, and purchase criteria
    • Analysis of price sensitivity, lifecycle, customer purchase basket, adoption rates, and purchase criteria
  • 2.2 Criticality of inputs and Factors of differentiation
    • Overview on criticality of inputs and factors of differentiation
  • 2.3 Factors of disruption
    • Overview on factors of disruption
  • 2.4 Impact of drivers and challenges
    • Impact of drivers and challenges in 2023 and 2028

3 Market Landscape

  • 3.1 Market ecosystem
    • Parent Market
    • Data Table on - Parent Market
  • 3.2 Market characteristics
    • Market characteristics analysis
  • 3.3 Value chain analysis
    • Value Chain Analysis

4 Market Sizing

  • 4.1 Market definition
    • Offerings of companies included in the market definition
  • 4.2 Market segment analysis
    • Market segments
  • 4.3 Market size 2023
    • 4.4 Market outlook: Forecast for 2023-2028
      • Chart on Global - Market size and forecast 2023-2028 ($ million)
      • Data Table on Global - Market size and forecast 2023-2028 ($ million)
      • Chart on Global Market: Year-over-year growth 2023-2028 (%)
      • Data Table on Global Market: Year-over-year growth 2023-2028 (%)

    5 Historic Market Size

    • 5.1 Global Marine Robots Market 2018 - 2022
      • Historic Market Size - Data Table on Global Marine Robots Market 2018 - 2022 ($ million)
    • 5.2 Application segment analysis 2018 - 2022
      • Historic Market Size - Application Segment 2018 - 2022 ($ million)
    • 5.3 Type segment analysis 2018 - 2022
      • Historic Market Size - Type Segment 2018 - 2022 ($ million)
    • 5.4 Geography segment analysis 2018 - 2022
      • Historic Market Size - Geography Segment 2018 - 2022 ($ million)
    • 5.5 Country segment analysis 2018 - 2022
      • Historic Market Size - Country Segment 2018 - 2022 ($ million)

    6 Qualitative Analysis

    • 6.1 Impact of AI on the Global Marine Robots Market

      7 Five Forces Analysis

      • 7.1 Five forces summary
        • Five forces analysis - Comparison between 2023 and 2028
      • 7.2 Bargaining power of buyers
        • Bargaining power of buyers - Impact of key factors 2023 and 2028
      • 7.3 Bargaining power of suppliers
        • Bargaining power of suppliers - Impact of key factors in 2023 and 2028
      • 7.4 Threat of new entrants
        • Threat of new entrants - Impact of key factors in 2023 and 2028
      • 7.5 Threat of substitutes
        • Threat of substitutes - Impact of key factors in 2023 and 2028
      • 7.6 Threat of rivalry
        • Threat of rivalry - Impact of key factors in 2023 and 2028
      • 7.7 Market condition
        • Chart on Market condition - Five forces 2023 and 2028

      8 Market Segmentation by Application

      • 8.1 Market segments
        • Chart on Application - Market share 2023-2028 (%)
        • Data Table on Application - Market share 2023-2028 (%)
      • 8.2 Comparison by Application
        • Chart on Comparison by Application
        • Data Table on Comparison by Application
      • 8.3 Defense and security - Market size and forecast 2023-2028
        • Chart on Defense and security - Market size and forecast 2023-2028 ($ million)
        • Data Table on Defense and security - Market size and forecast 2023-2028 ($ million)
        • Chart on Defense and security - Year-over-year growth 2023-2028 (%)
        • Data Table on Defense and security - Year-over-year growth 2023-2028 (%)
      • 8.4 Commercial - Market size and forecast 2023-2028
        • Chart on Commercial - Market size and forecast 2023-2028 ($ million)
        • Data Table on Commercial - Market size and forecast 2023-2028 ($ million)
        • Chart on Commercial - Year-over-year growth 2023-2028 (%)
        • Data Table on Commercial - Year-over-year growth 2023-2028 (%)
      • 8.5 Scientific research - Market size and forecast 2023-2028
        • Chart on Scientific research - Market size and forecast 2023-2028 ($ million)
        • Data Table on Scientific research - Market size and forecast 2023-2028 ($ million)
        • Chart on Scientific research - Year-over-year growth 2023-2028 (%)
        • Data Table on Scientific research - Year-over-year growth 2023-2028 (%)
      • 8.6 Environmental monitoring - Market size and forecast 2023-2028
        • Chart on Environmental monitoring - Market size and forecast 2023-2028 ($ million)
        • Data Table on Environmental monitoring - Market size and forecast 2023-2028 ($ million)
        • Chart on Environmental monitoring - Year-over-year growth 2023-2028 (%)
        • Data Table on Environmental monitoring - Year-over-year growth 2023-2028 (%)
      • 8.7 Others - Market size and forecast 2023-2028
        • Chart on Others - Market size and forecast 2023-2028 ($ million)
        • Data Table on Others - Market size and forecast 2023-2028 ($ million)
        • Chart on Others - Year-over-year growth 2023-2028 (%)
        • Data Table on Others - Year-over-year growth 2023-2028 (%)
      • 8.8 Market opportunity by Application
        • Market opportunity by Application ($ million)
        • Data Table on Market opportunity by Application ($ million)

      9 Market Segmentation by Type

      • 9.1 Market segments
        • Chart on Type - Market share 2023-2028 (%)
        • Data Table on Type - Market share 2023-2028 (%)
      • 9.2 Comparison by Type
        • Chart on Comparison by Type
        • Data Table on Comparison by Type
      • 9.3 Autonomous underwater vehicle - Market size and forecast 2023-2028
        • Chart on Autonomous underwater vehicle - Market size and forecast 2023-2028 ($ million)
        • Data Table on Autonomous underwater vehicle - Market size and forecast 2023-2028 ($ million)
        • Chart on Autonomous underwater vehicle - Year-over-year growth 2023-2028 (%)
        • Data Table on Autonomous underwater vehicle - Year-over-year growth 2023-2028 (%)
      • 9.4 Remotely operated vehicles - Market size and forecast 2023-2028
        • Chart on Remotely operated vehicles - Market size and forecast 2023-2028 ($ million)
        • Data Table on Remotely operated vehicles - Market size and forecast 2023-2028 ($ million)
        • Chart on Remotely operated vehicles - Year-over-year growth 2023-2028 (%)
        • Data Table on Remotely operated vehicles - Year-over-year growth 2023-2028 (%)
      • 9.5 Unmanned surface vehicles - Market size and forecast 2023-2028
        • Chart on Unmanned surface vehicles - Market size and forecast 2023-2028 ($ million)
        • Data Table on Unmanned surface vehicles - Market size and forecast 2023-2028 ($ million)
        • Chart on Unmanned surface vehicles - Year-over-year growth 2023-2028 (%)
        • Data Table on Unmanned surface vehicles - Year-over-year growth 2023-2028 (%)
      • 9.6 Hybrid vehicles - Market size and forecast 2023-2028
        • Chart on Hybrid vehicles - Market size and forecast 2023-2028 ($ million)
        • Data Table on Hybrid vehicles - Market size and forecast 2023-2028 ($ million)
        • Chart on Hybrid vehicles - Year-over-year growth 2023-2028 (%)
        • Data Table on Hybrid vehicles - Year-over-year growth 2023-2028 (%)
      • 9.7 Market opportunity by Type
        • Market opportunity by Type ($ million)
        • Data Table on Market opportunity by Type ($ million)

      10 Customer Landscape

      • 10.1 Customer landscape overview
        • Analysis of price sensitivity, lifecycle, customer purchase basket, adoption rates, and purchase criteria

      11 Geographic Landscape

      • 11.1 Geographic segmentation
        • Chart on Market share by geography 2023-2028 (%)
        • Data Table on Market share by geography 2023-2028 (%)
      • 11.2 Geographic comparison
        • Chart on Geographic comparison
        • Data Table on Geographic comparison
      • 11.3 North America - Market size and forecast 2023-2028
        • Chart on North America - Market size and forecast 2023-2028 ($ million)
        • Data Table on North America - Market size and forecast 2023-2028 ($ million)
        • Chart on North America - Year-over-year growth 2023-2028 (%)
        • Data Table on North America - Year-over-year growth 2023-2028 (%)
      • 11.4 Europe - Market size and forecast 2023-2028
        • Chart on Europe - Market size and forecast 2023-2028 ($ million)
        • Data Table on Europe - Market size and forecast 2023-2028 ($ million)
        • Chart on Europe - Year-over-year growth 2023-2028 (%)
        • Data Table on Europe - Year-over-year growth 2023-2028 (%)
      • 11.5 APAC - Market size and forecast 2023-2028
        • Chart on APAC - Market size and forecast 2023-2028 ($ million)
        • Data Table on APAC - Market size and forecast 2023-2028 ($ million)
        • Chart on APAC - Year-over-year growth 2023-2028 (%)
        • Data Table on APAC - Year-over-year growth 2023-2028 (%)
      • 11.6 South America - Market size and forecast 2023-2028
        • Chart on South America - Market size and forecast 2023-2028 ($ million)
        • Data Table on South America - Market size and forecast 2023-2028 ($ million)
        • Chart on South America - Year-over-year growth 2023-2028 (%)
        • Data Table on South America - Year-over-year growth 2023-2028 (%)
      • 11.7 Middle East and Africa - Market size and forecast 2023-2028
        • Chart on Middle East and Africa - Market size and forecast 2023-2028 ($ million)
        • Data Table on Middle East and Africa - Market size and forecast 2023-2028 ($ million)
        • Chart on Middle East and Africa - Year-over-year growth 2023-2028 (%)
        • Data Table on Middle East and Africa - Year-over-year growth 2023-2028 (%)
      • 11.8 US - Market size and forecast 2023-2028
        • Chart on US - Market size and forecast 2023-2028 ($ million)
        • Data Table on US - Market size and forecast 2023-2028 ($ million)
        • Chart on US - Year-over-year growth 2023-2028 (%)
        • Data Table on US - Year-over-year growth 2023-2028 (%)
      • 11.9 Canada - Market size and forecast 2023-2028
        • Chart on Canada - Market size and forecast 2023-2028 ($ million)
        • Data Table on Canada - Market size and forecast 2023-2028 ($ million)
        • Chart on Canada - Year-over-year growth 2023-2028 (%)
        • Data Table on Canada - Year-over-year growth 2023-2028 (%)
      • 11.10 China - Market size and forecast 2023-2028
        • Chart on China - Market size and forecast 2023-2028 ($ million)
        • Data Table on China - Market size and forecast 2023-2028 ($ million)
        • Chart on China - Year-over-year growth 2023-2028 (%)
        • Data Table on China - Year-over-year growth 2023-2028 (%)
      • 11.11 UK - Market size and forecast 2023-2028
        • Chart on UK - Market size and forecast 2023-2028 ($ million)
        • Data Table on UK - Market size and forecast 2023-2028 ($ million)
        • Chart on UK - Year-over-year growth 2023-2028 (%)
        • Data Table on UK - Year-over-year growth 2023-2028 (%)
      • 11.12 France - Market size and forecast 2023-2028
        • Chart on France - Market size and forecast 2023-2028 ($ million)
        • Data Table on France - Market size and forecast 2023-2028 ($ million)
        • Chart on France - Year-over-year growth 2023-2028 (%)
        • Data Table on France - Year-over-year growth 2023-2028 (%)
      • 11.13 Germany - Market size and forecast 2023-2028
        • Chart on Germany - Market size and forecast 2023-2028 ($ million)
        • Data Table on Germany - Market size and forecast 2023-2028 ($ million)
        • Chart on Germany - Year-over-year growth 2023-2028 (%)
        • Data Table on Germany - Year-over-year growth 2023-2028 (%)
      • 11.14 Japan - Market size and forecast 2023-2028
        • Chart on Japan - Market size and forecast 2023-2028 ($ million)
        • Data Table on Japan - Market size and forecast 2023-2028 ($ million)
        • Chart on Japan - Year-over-year growth 2023-2028 (%)
        • Data Table on Japan - Year-over-year growth 2023-2028 (%)
      • 11.15 South Korea - Market size and forecast 2023-2028
        • Chart on South Korea - Market size and forecast 2023-2028 ($ million)
        • Data Table on South Korea - Market size and forecast 2023-2028 ($ million)
        • Chart on South Korea - Year-over-year growth 2023-2028 (%)
        • Data Table on South Korea - Year-over-year growth 2023-2028 (%)
      • 11.16 Australia - Market size and forecast 2023-2028
        • Chart on Australia - Market size and forecast 2023-2028 ($ million)
        • Data Table on Australia - Market size and forecast 2023-2028 ($ million)
        • Chart on Australia - Year-over-year growth 2023-2028 (%)
        • Data Table on Australia - Year-over-year growth 2023-2028 (%)
      • 11.17 Russia - Market size and forecast 2023-2028
        • Chart on Russia - Market size and forecast 2023-2028 ($ million)
        • Data Table on Russia - Market size and forecast 2023-2028 ($ million)
        • Chart on Russia - Year-over-year growth 2023-2028 (%)
        • Data Table on Russia - Year-over-year growth 2023-2028 (%)
      • 11.18 Market opportunity by geography
        • Market opportunity by geography ($ million)
        • Data Tables on Market opportunity by geography ($ million)

      12 Drivers, Challenges, and Opportunity/Restraints

      • 12.1 Market drivers
        • 12.2 Market challenges
          • 12.3 Impact of drivers and challenges
            • Impact of drivers and challenges in 2023 and 2028
          • 12.4 Market opportunities/restraints

            13 Competitive Landscape

            • 13.1 Overview
              • 13.2 Competitive Landscape
                • Overview on criticality of inputs and factors of differentiation
              • 13.3 Landscape disruption
                • Overview on factors of disruption
              • 13.4 Industry risks
                • Impact of key risks on business

              14 Competitive Analysis

              • 14.1 Companies profiled
                • Companies covered
              • 14.2 Company ranking index
                • Company ranking index
              • 14.3 Market positioning of companies
                • Matrix on companies position and classification
              • 14.4 Anduril Industries Inc.
                • Anduril Industries Inc. - Overview
                • Anduril Industries Inc. - Product / Service
                • Anduril Industries Inc. - Key offerings
                • SWOT
              • 14.5 Blue Robotics Inc.
                • Blue Robotics Inc. - Overview
                • Blue Robotics Inc. - Product / Service
                • Blue Robotics Inc. - Key offerings
                • SWOT
              • 14.6 ECA Group
                • ECA Group - Overview
                • ECA Group - Product / Service
                • ECA Group - Key offerings
                • SWOT
              • 14.7 EyeROV
                • EyeROV - Overview
                • EyeROV - Product / Service
                • EyeROV - Key offerings
                • SWOT
              • 14.8 General Dynamics Mission Systems Inc.
                • General Dynamics Mission Systems Inc. - Overview
                • General Dynamics Mission Systems Inc. - Product / Service
                • General Dynamics Mission Systems Inc. - Key offerings
                • SWOT
              • 14.9 Hanwha Systems Co.
                • Hanwha Systems Co. - Overview
                • Hanwha Systems Co. - Product / Service
                • Hanwha Systems Co. - Key offerings
                • SWOT
              • 14.10 International Submarine Engineering Ltd.
                • International Submarine Engineering Ltd. - Overview
                • International Submarine Engineering Ltd. - Product / Service
                • International Submarine Engineering Ltd. - Key offerings
                • SWOT
              • 14.11 Kongsberg Gruppen ASA
                • Kongsberg Gruppen ASA - Overview
                • Kongsberg Gruppen ASA - Business segments
                • Kongsberg Gruppen ASA - Key news
                • Kongsberg Gruppen ASA - Key offerings
                • Kongsberg Gruppen ASA - Segment focus
                • SWOT
              • 14.12 L3Harris Technologies Inc.
                • L3Harris Technologies Inc. - Overview
                • L3Harris Technologies Inc. - Business segments
                • L3Harris Technologies Inc. - Key news
                • L3Harris Technologies Inc. - Key offerings
                • L3Harris Technologies Inc. - Segment focus
                • SWOT
              • 14.13 Liquid Robotics Inc.
                • Liquid Robotics Inc. - Overview
                • Liquid Robotics Inc. - Product / Service
                • Liquid Robotics Inc. - Key offerings
                • SWOT
              • 14.14 Maritime Robotics
                • Maritime Robotics - Overview
                • Maritime Robotics - Product / Service
                • Maritime Robotics - Key offerings
                • SWOT
              • 14.15 Planys Technologies
                • Planys Technologies - Overview
                • Planys Technologies - Product / Service
                • Planys Technologies - Key offerings
                • SWOT
              • 14.16 Saab AB
                • Saab AB - Overview
                • Saab AB - Business segments
                • Saab AB - Key news
                • Saab AB - Key offerings
                • Saab AB - Segment focus
                • SWOT
              • 14.17 Saildrone Inc.
                • Saildrone Inc. - Overview
                • Saildrone Inc. - Product / Service
                • Saildrone Inc. - Key offerings
                • SWOT
              • 14.18 SeaSatellites, Inc.
                • SeaSatellites, Inc. - Overview
                • SeaSatellites, Inc. - Product / Service
                • SeaSatellites, Inc. - Key offerings
                • SWOT

              15 Appendix

              • 15.1 Scope of the report
                • 15.2 Inclusions and exclusions checklist
                  • Inclusions checklist
                  • Exclusions checklist
                • 15.3 Currency conversion rates for US$
                  • Currency conversion rates for US$
                • 15.4 Research methodology
                  • Research methodology
                • 15.5 Data procurement
                  • Information sources
                • 15.6 Data validation
                  • Data validation
                • 15.7 Validation techniques employed for market sizing
                  • Validation techniques employed for market sizing
                • 15.8 Data synthesis
                  • Data synthesis
                • 15.9 360 degree market analysis
                  • 360 degree market analysis
                • 15.10 List of abbreviations
                  • List of abbreviations

                Research Methodology

                Technavio presents a detailed picture of the market by way of study, synthesis, and summation of data from multiple sources. The analysts have presented the various facets of the market with a particular focus on identifying the key industry influencers. The data thus presented is comprehensive, reliable, and the result of extensive research, both primary and secondary.

                INFORMATION SOURCES

                Primary sources

                • Manufacturers and suppliers
                • Channel partners
                • Industry experts
                • Strategic decision makers

                Secondary sources

                • Industry journals and periodicals
                • Government data
                • Financial reports of key industry players
                • Historical data
                • Press releases

                DATA ANALYSIS

                Data Synthesis

                • Collation of data
                • Estimation of key figures
                • Analysis of derived insights

                Data Validation

                • Triangulation with data models
                • Reference against proprietary databases
                • Corroboration with industry experts

                REPORT WRITING

                Qualitative

                • Market drivers
                • Market challenges
                • Market trends
                • Five forces analysis

                Quantitative

                • Market size and forecast
                • Market segmentation
                • Geographical insights
                • Competitive landscape

                Interested in this report?

                Get your sample now to see our research methodology and insights!

                Download Now

                Frequently Asked Questions

                Marine Robots market growth will increase by $ 4939.8 mn during 2024-2028.

                The Marine Robots market is expected to grow at a CAGR of 15.6% during 2024-2028.

                Marine Robots market is segmented by Application( Defense and security, Commercial, Scientific research, Environmental monitoring, Others) Type( Autonomous underwater vehicle, Remotely operated vehicles, Unmanned surface vehicles, Hybrid vehicles)

                Advanced Navigation Pty Ltd., Anduril Industries Inc., BeeX, Blue Robotics Inc., ECA Group, ecoSUB Robotics Ltd., EyeROV, General Dynamics Mission Systems Inc., GrayMatter Robotics, Hanwha Systems Co., International Submarine Engineering Ltd., Kongsberg Gruppen ASA, L3Harris Technologies Inc., Liquid Robotics Inc., Marine Robotic Technologies Ltd, Maritime Robotics, Oceanalpha Group Ltd., Planys Technologies, Saab AB, Saildrone Inc., Sea Machines Robotics, Inc, SeaSatellites, Inc., Teledyne Marine Technologies Inc, UFRJ Nautilus are a few of the key vendors in the Marine Robots market.

                North America will register the highest growth rate of 33% among the other regions. Therefore, the Marine Robots market in North America is expected to garner significant business opportunities for the vendors during the forecast period.

                US, Canada, China, UK, France, Germany, Japan, South Korea, Australia, Russia

                • Growing investments in unmanned surface vehicle industryThe unmanned surface vehicles (USVs) segment of the marine robots industry is experiencing significant growth is the driving factor this market.
                • driven by increasing investments from both private and institutional investors. This influx of capital is crucial for advancing the development is the driving factor this market.
                • commissioning is the driving factor this market.
                • and commercialization of USVs is the driving factor this market.
                • which are pivotal for various applications including maritime security is the driving factor this market.
                • environmental monitoring is the driving factor this market.
                • and commercial shipping.A notable example of this trend is the recent financing secured by Nauticus Robotics is the driving factor this market.
                • a US-based technology provider for ocean robots. The company has obtained up to $20 million in term loan financing from existing investors is the driving factor this market.
                • aimed at enhancing the deployment and operational capabilities of its USV fleet. This financial boost is expected to accelerate the efforts of the company in bringing advanced USV technologies to the market is the driving factor this market.
                • thereby strengthening its competitive position. The secured term loan agreement with stakeholders such as Transocean is the driving factor this market.
                • ATW Partners is the driving factor this market.
                • Material Impact is the driving factor this market.
                • and RCB Equities underscores the confidence investors have in the potential of USV technologies. Of the total $20 million is the driving factor this market.
                • $11.6 million has already been disbursed is the driving factor this market.
                • providing immediate capital for ongoing projects. The loans are convertible into common stock at $6 per share is the driving factor this market.
                • offering investors a stake in the future success of the company and aligning their interests with long-term growth.Nauticus Robotics is actively pursuing additional capital from new investors to further expand its service offerings. This proactive approach to securing funding highlights the growing recognition of the strategic importance of USVs in modern maritime operations. The continuous flow of investments is expected to drive innovation is the driving factor this market.
                • enhance operational efficiencies is the driving factor this market.
                • and expand the application scope of USVs during the forecast period. In summary is the driving factor this market.
                • the growing investments in the USV industry are a key driver of market growth is the driving factor this market.
                • enabling marine robot manufacturing companies to scale their operations is the driving factor this market.
                • innovate is the driving factor this market.
                • and meet the increasing demand for autonomous maritime solutions. This trend is set to continue is the driving factor this market.
                • fostering a robust and dynamic market landscape. Therefore is the driving factor this market.
                • the global marine robots market will witness growth during the forecast period. is the driving factor this market.

                The Marine Robots market vendors should focus on grabbing business opportunities from the Defense and security segment as it accounted for the largest market share in the base year.
                RIA - Research AI Assistant
                Ask RIA