Autonomous Underwater Vehicle (AUV) Market Size 2025-2029
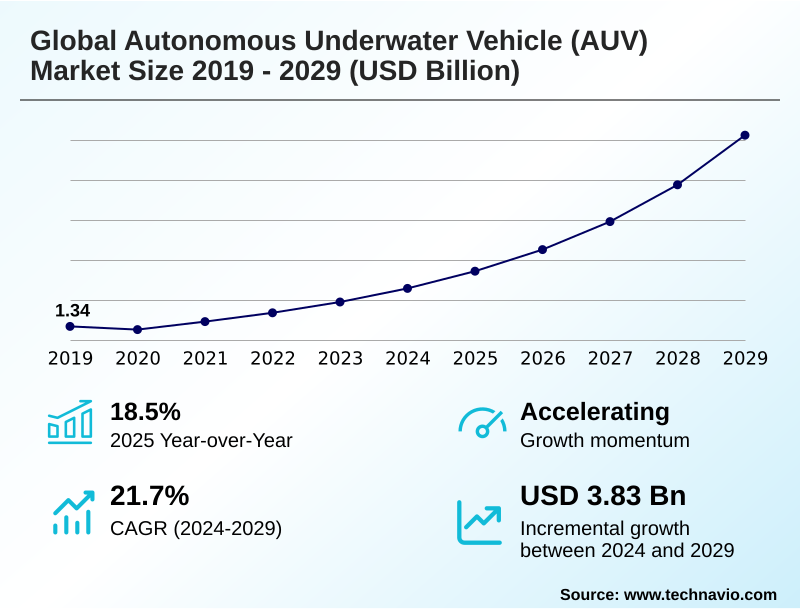
The autonomous underwater vehicle (auv) market size is valued to increase by USD 3.83 billion, at a CAGR of 21.7% from 2024 to 2029. Increasing investment in maritime surveillance capabilities will drive the autonomous underwater vehicle (auv) market.
Major Market Trends & Insights
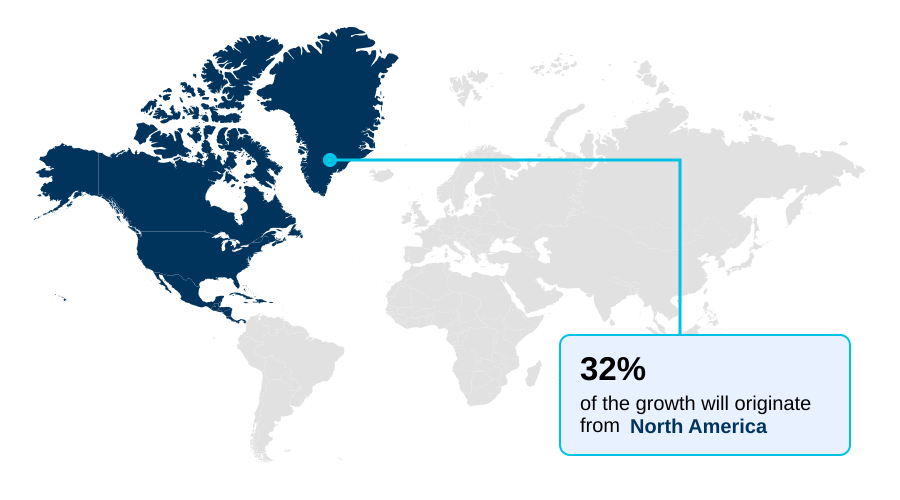
- North America dominated the market and accounted for a 32.2% growth during the forecast period.
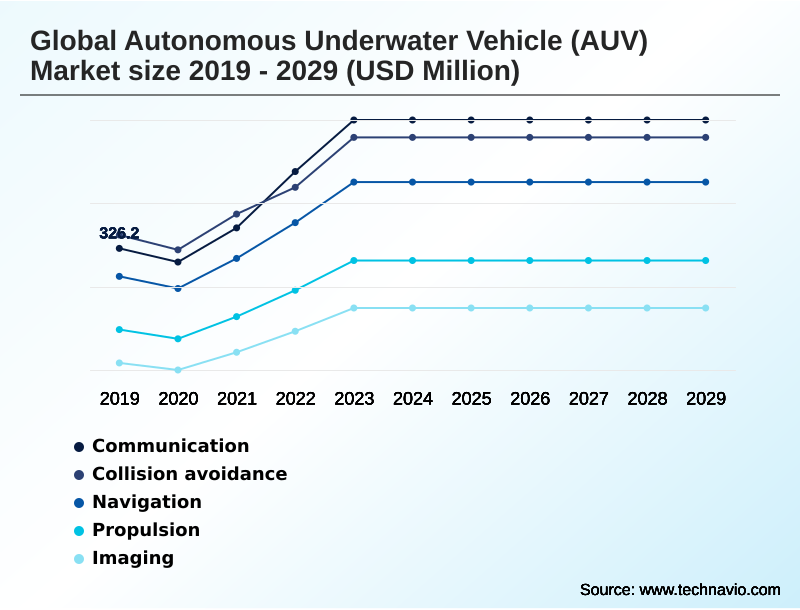
- By Technology - Communication segment was valued at USD 502.8 million in 2023
- By Application - Military and defense segment accounted for the largest market revenue share in 2023
Market Size & Forecast
- Market Opportunities: USD 4.78 billion
- Market Future Opportunities: USD 3.83 billion
- CAGR from 2024 to 2029 : 21.7%
Market Summary
- The Autonomous Underwater Vehicle (AUV) Market is undergoing significant expansion, driven by accelerating demand in defense, commercial, and scientific sectors. Growing geopolitical tensions are fueling investment in unmanned undersea vehicles for critical missions like intelligence, surveillance, and reconnaissance (ISR) and anti-submarine warfare (ASW), where persistent, low-risk platforms are essential.
- Commercially, the offshore energy industry relies on underwater drones for subsea infrastructure inspection and seabed mapping to improve safety and operational efficiency, such as reducing inspection turnaround times for pipeline integrity checks. Scientific applications in oceanographic data collection are also expanding, with AUVs providing high-resolution data for climate modeling and deep-sea exploration.
- The integration of advanced sensor payload integration and autonomous launch and recovery systems is a key trend, enhancing mission capabilities. However, challenges related to the high costs of development and the limited endurance of battery systems persist. The market's trajectory is increasingly shaped by innovations in AI-driven navigation and real-time onboard data processing, enabling more complex and autonomous operations.
- These autonomous underwater vehicle technology advancements are crucial for unlocking the full potential of subsea domains across all key applications.
What will be the Size of the Autonomous Underwater Vehicle (AUV) Market during the forecast period?
Get Key Insights on Market Forecast (PDF) Get Free Sample
How is the Autonomous Underwater Vehicle (AUV) Market Segmented?
The autonomous underwater vehicle (auv) industry research report provides comprehensive data (region-wise segment analysis), with forecasts and estimates in "USD million" for the period 2025-2029, as well as historical data from 2019-2023 for the following segments.
- Technology
- Communication
- Collision avoidance
- Navigation
- Propulsion
- Imaging
- Application
- Military and defense
- Oil and gas
- Environment protection and monitoring
- Oceanography
- Others
- Type
- Shallow AUVs
- Medium AUVs
- Large AUVs
- Geography
- North America
- US
- Canada
- Mexico
- Europe
- Germany
- France
- Italy
- APAC
- China
- Japan
- India
- Middle East and Africa
- Saudi Arabia
- UAE
- South Africa
- South America
- Brazil
- Argentina
- Colombia
- Rest of World (ROW)
- North America
By Technology Insights
The communication segment is estimated to witness significant growth during the forecast period.
The communication segment is pivotal for the autonomous underwater vehicle (AUV) market, driven by the demand for reliable AUV data transmission and interoperable systems.
Innovations are overcoming the limitations of traditional acoustic communication modems, which have historically restricted real-time command and control. Advanced signal processing and adaptive modulation schemes are improving data rates, enabling complex swarm behaviors and networked unmanned maritime systems.
This allows AUVs, including subsea robotics and deep ocean research vehicles, to function as interconnected nodes, sharing sensor data and coordinating actions. Enhanced underwater acoustic positioning facilitates these operations, with real-time onboard data processing enabling rapid decision-making.
These improvements in communication reliability have boosted mission effectiveness by over 20% in complex operational environments.
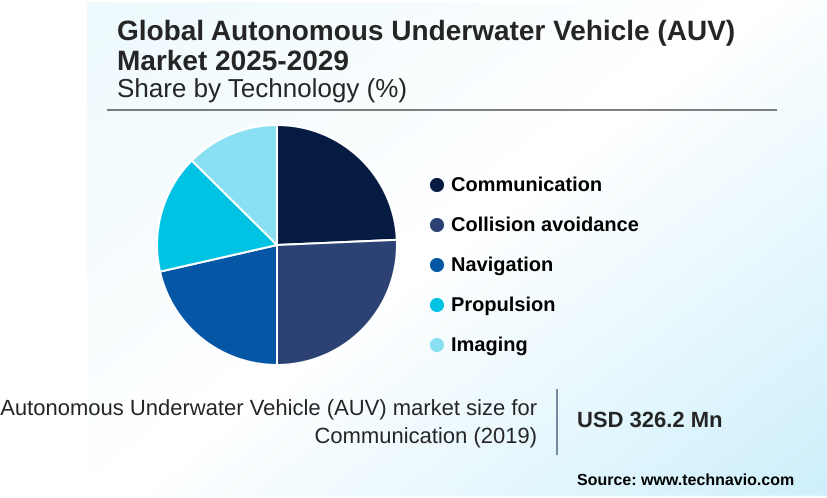
The Communication segment was valued at USD 502.8 million in 2023 and showed a gradual increase during the forecast period.
Regional Analysis
North America is estimated to contribute 32.2% to the growth of the global market during the forecast period.Technavio’s analysts have elaborately explained the regional trends and drivers that shape the market during the forecast period.
See How Autonomous Underwater Vehicle (AUV) Market Demand is Rising in North America Get Free Sample
North America, led by the US, accounts for over 32% of the market's incremental growth, driven by substantial defense investments in extra-large unmanned undersea vehicle (XLUUV) programs and robust commercial demand for subsea asset maintenance in the offshore energy sector.
The region hosts a significant number of vendors specializing in autonomous underwater vehicle technology. APAC is the fastest-growing region, with a focus on hydrographic survey and mine countermeasures (MCM).
Europe maintains a strong market position through its expertise in high-resolution sonar imaging and AUV navigation algorithms, with countries like Norway leading in remote operational workflows.
The development of advanced subsea sensors and underwater vehicle autonomy is a global focus, ensuring AUVs are increasingly vital for maritime security robotics and naval autonomous platforms worldwide.
Market Dynamics
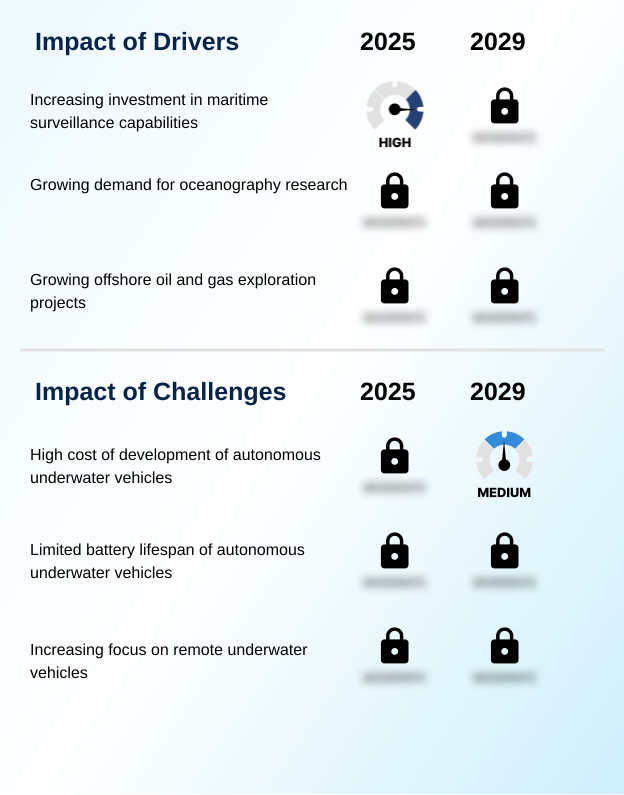
Our researchers analyzed the data with 2024 as the base year, along with the key drivers, trends, and challenges. A holistic analysis of drivers will help companies refine their marketing strategies to gain a competitive advantage.
- The strategic role of AI in autonomous underwater vehicle navigation is revolutionizing mission effectiveness, enabling complex behaviors like AUV swarm intelligence for naval operations. This technological shift addresses key operational hurdles, such as the challenges in AUV battery and power management, by optimizing power consumption during long-duration missions.
- In the commercial sector, AUV technology for offshore wind farm inspection is becoming standard practice, with cost-benefit analysis of AUVs in hydrographic surveying showing a significant return on investment compared to traditional methods. For deep-sea AUV applications in polymetallic nodule exploration, advancements in synthetic aperture sonar for AUVs provide unprecedented imaging detail.
- When comparing AUV and ROV for subsea inspection tasks, AUVs offer superior area coverage and efficiency for survey-class work, with some operators reporting a 3x increase in pipeline survey speed. The integration of USVs for AUV launch and recovery further enhances this efficiency. The development of hybrid AUV-ROV systems for subsea intervention seeks to combine the strengths of both platforms.
- Security protocols for autonomous underwater vehicle fleets and a clear regulatory framework for commercial AUV deployment are becoming critical as adoption grows, particularly for autonomous underwater vehicle in mine countermeasure operations and arctic research missions.
What are the key market drivers leading to the rise in the adoption of Autonomous Underwater Vehicle (AUV) Industry?
- Increasing investment in maritime surveillance capabilities by global naval forces is a key driver for market growth.
- A primary driver is the escalating demand from the offshore energy sector for cost-effective subsea surveys and asset integrity management, spurring the growth of commercial AUV services.
- The use of AUVs for pipeline integrity checks has been shown to reduce inspection costs by up to 35% while improving data quality. This economic incentive is accelerating the adoption of autonomous systems for subsea infrastructure inspection and maintenance.
- In parallel, strategic defense AUV programs are expanding, with naval forces investing in unmanned platforms for intelligence, surveillance, and reconnaissance (ISR) and anti-submarine warfare (ASW).
- The need for covert, persistent presence is fueling the development of extra-large unmanned undersea vehicles (XLUUVs) and biomimetic autonomous underwater vehicles.
What are the market trends shaping the Autonomous Underwater Vehicle (AUV) Industry?
- The increased emphasis on integrating artificial intelligence into autonomous underwater vehicles is a transformative trend. It significantly enhances their autonomy, operational efficiency, and mission adaptability.
- A key trend transforming the market is the convergence of AI with advanced underwater robotics, enabling autonomous survey technology to operate with unprecedented efficiency. AUV swarm intelligence is being operationalized, allowing coordinated fleets of unmanned survey vessels to execute large-scale hydrographic surveys, increasing data collection efficiency by over 50% compared to single-vehicle missions.
- This shift is driven by breakthroughs in AUV mission planning and subsea sensor fusion, which allow for adaptive, real-time adjustments. Furthermore, the development of long-endurance AUV platforms for environmental monitoring AUVs is supporting climate research by providing continuous data streams from remote ocean areas, a task previously unfeasible with crewed vessels.
What challenges does the Autonomous Underwater Vehicle (AUV) Industry face during its growth?
- The high cost associated with the development of advanced autonomous underwater vehicles presents a significant challenge to industry expansion.
- A significant challenge restraining market growth is the complexity and high cost of subsea docking systems and wireless power transfer technologies required for truly persistent, long-term deployments. While torpedo tube launch and recovery systems improve covert deployment, energy replenishment remains a major logistical hurdle, limiting mission duration for underwater drones.
- The development of advanced manipulator systems for subsea intervention tasks also adds significant R&D expense. Moreover, ensuring secure and high-bandwidth AUV data transmission from deep-sea environments is a persistent technical challenge. These factors contribute to high upfront capital expenditure, with the operational cost of deep-water AUVs sometimes being 20% higher than their shallow-water counterparts during initial deployment phases.
Exclusive Technavio Analysis on Customer Landscape
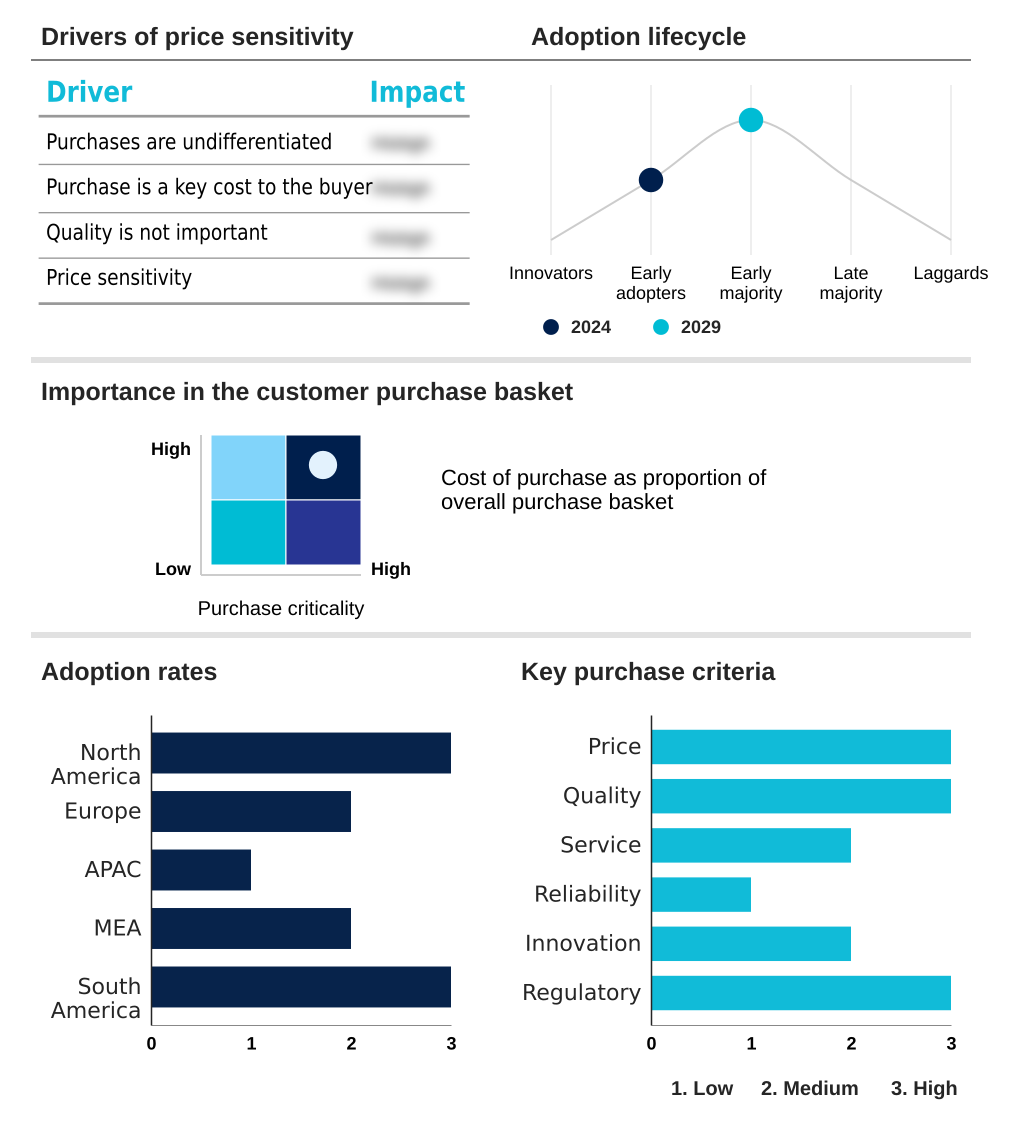
The autonomous underwater vehicle (auv) market forecasting report includes the adoption lifecycle of the market, covering from the innovator’s stage to the laggard’s stage. It focuses on adoption rates in different regions based on penetration. Furthermore, the autonomous underwater vehicle (auv) market report also includes key purchase criteria and drivers of price sensitivity to help companies evaluate and develop their market growth analysis strategies.
Customer Landscape of Autonomous Underwater Vehicle (AUV) Industry
Competitive Landscape
Companies are implementing various strategies, such as strategic alliances, autonomous underwater vehicle (auv) market forecast, partnerships, mergers and acquisitions, geographical expansion, and product/service launches, to enhance their presence in the industry.
BAE Systems Plc - Key offerings focus on advanced autonomous underwater systems and subsea robotics designed for complex deep-sea exploration, surveillance, and infrastructure inspection missions.
The industry research and growth report includes detailed analyses of the competitive landscape of the market and information about key companies, including:
- BAE Systems Plc
- Boston Engineering
- ecoSUB Robotics Ltd.
- EdgeLab srl
- Exail Technologies
- Fugro NV
- General Dynamics Corp.
- Graal Tech Srl
- Hydromea SA
- IHI Corp.
- International Submarine Engineering Ltd.
- Kongsberg Gruppen ASA
- L3Harris Technologies Inc.
- Lockheed Martin Corp.
- Mitsubishi Heavy Ltd.
- Oceaneering International Inc.
- Saab AB
- Teledyne Technologies Inc.
- The Boeing Co.
- thyssenkrupp AG
Qualitative and quantitative analysis of companies has been conducted to help clients understand the wider business environment as well as the strengths and weaknesses of key industry players. Data is qualitatively analyzed to categorize companies as pure play, category-focused, industry-focused, and diversified; it is quantitatively analyzed to categorize companies as dominant, leading, strong, tentative, and weak.
Recent Development and News in Autonomous underwater vehicle (auv) market
- In September, 2024, Kongsberg Gruppen ASA announced a strategic partnership with a leading AI firm to integrate next-generation machine learning algorithms into its HUGIN AUV platform, enhancing autonomous navigation and real-time data processing for subsea surveys.
- In November, 2024, L3Harris Technologies Inc. launched its new Iver5 AUV, a long-endurance platform designed for deep-sea exploration and persistent environmental monitoring at depths exceeding 6,000 meters, featuring advanced sensor payload integration.
- In February, 2025, Fugro NV completed its acquisition of a specialized subsea robotics company, a move aimed at bolstering its remote operational workflows and expanding its fleet of integrated uncrewed surface and underwater vehicles for the offshore energy market.
- In April, 2025, The Boeing Co. secured a significant contract from the US Navy to deliver five additional Orca Extra-Large Unmanned Undersea Vehicles (XLUUVs) for long-duration, clandestine maritime surveillance and anti-submarine warfare missions.
Dive into Technavio’s robust research methodology, blending expert interviews, extensive data synthesis, and validated models for unparalleled Autonomous Underwater Vehicle (AUV) Market insights. See full methodology.
| Market Scope | |
|---|---|
| Page number | 313 |
| Base year | 2024 |
| Historic period | 2019-2023 |
| Forecast period | 2025-2029 |
| Growth momentum & CAGR | Accelerate at a CAGR of 21.7% |
| Market growth 2025-2029 | USD 3830.7 million |
| Market structure | Fragmented |
| YoY growth 2024-2025(%) | 18.5% |
| Key countries | US, Canada, Mexico, Germany, Norway, France, Italy, The Netherlands, Spain, China, Japan, India, South Korea, Australia, Indonesia, Saudi Arabia, UAE, South Africa, Israel, Turkey, Brazil, Argentina and Colombia |
| Competitive landscape | Leading Companies, Market Positioning of Companies, Competitive Strategies, and Industry Risks |
Research Analyst Overview
- The Autonomous Underwater Vehicle (AUV) market is defined by rapid technological evolution, compelling a strategic re-evaluation of maritime operations. The push for persistent underwater surveillance is driving innovation in unmanned undersea vehicles and underwater drones.
- Boardroom decisions are increasingly influenced by the capabilities of these platforms, from deep-sea exploration and seabed mapping to critical defense applications like mine countermeasures (MCM) and anti-submarine warfare (ASW). The integration of sophisticated technologies such as doppler velocity log, inertial navigation system, and synthetic aperture sonar (SAS) is now standard.
- Advancements in terrain-relative navigation and simultaneous localization and mapping (SLAM) are enhancing autonomy. A pivotal development is the focus on autonomous launch and recovery, which has demonstrated the potential to reduce vessel-based operational costs by up to 30%. This, combined with progress in sensor payload integration, hydrographic surveys, and pipeline integrity checks, underscores the technology's transformative impact.
What are the Key Data Covered in this Autonomous Underwater Vehicle (AUV) Market Research and Growth Report?
-
What is the expected growth of the Autonomous Underwater Vehicle (AUV) Market between 2025 and 2029?
-
USD 3.83 billion, at a CAGR of 21.7%
-
-
What segmentation does the market report cover?
-
The report is segmented by Technology (Communication, Collision avoidance, Navigation, Propulsion, and Imaging), Application (Military and defense, Oil and gas, Environment protection and monitoring, Oceanography, and Others), Type (Shallow AUVs, Medium AUVs, and Large AUVs) and Geography (North America, Europe, APAC, Middle East and Africa, South America)
-
-
Which regions are analyzed in the report?
-
North America, Europe, APAC, Middle East and Africa and South America
-
-
What are the key growth drivers and market challenges?
-
Increasing investment in maritime surveillance capabilities, High cost of development of autonomous underwater vehicles
-
-
Who are the major players in the Autonomous Underwater Vehicle (AUV) Market?
-
BAE Systems Plc, Boston Engineering, ecoSUB Robotics Ltd., EdgeLab srl, Exail Technologies, Fugro NV, General Dynamics Corp., Graal Tech Srl, Hydromea SA, IHI Corp., International Submarine Engineering Ltd., Kongsberg Gruppen ASA, L3Harris Technologies Inc., Lockheed Martin Corp., Mitsubishi Heavy Ltd., Oceaneering International Inc., Saab AB, Teledyne Technologies Inc., The Boeing Co. and thyssenkrupp AG
-
Market Research Insights
- Market dynamics are shaped by a strategic shift toward advanced autonomous survey technology and remote AUV operations, which enhance efficiency and reduce human risk in hazardous environments. The adoption of unmanned survey vessels as force multipliers for deploying AUVs has improved survey area coverage by over 40% in some commercial AUV services.
- This is complemented by advancements in AUV mission planning software, leading to a 25% reduction in mission-related fuel consumption for support vessels. Furthermore, innovations in AUV data transmission and subsea data analytics are enabling faster, more accurate decision-making for end-users in sectors from defense to offshore energy, driving the demand for more capable autonomous oceanography tools and platforms.
We can help! Our analysts can customize this autonomous underwater vehicle (auv) market research report to meet your requirements.
 RIA -
RIA - 
