Marine Scrubber Market Analysis APAC, Europe, North America, South America, Middle East and Africa - China, Japan, South Korea, UK, Norway - Size and Forecast 2024-2028

Marine Scrubber Market Analysis APAC, Europe, North America, South America, Middle East and Africa - China, Japan, South Korea, UK, Norway - Size and Forecast 2024-2028

Published: Dec 2023 177 Pages SKU: IRTNTR40474

Market Overview at a Glance

$1.90 B
Market Opportunity
7.52%
CAGR
8.02
YoY growth 2023-2024(%)

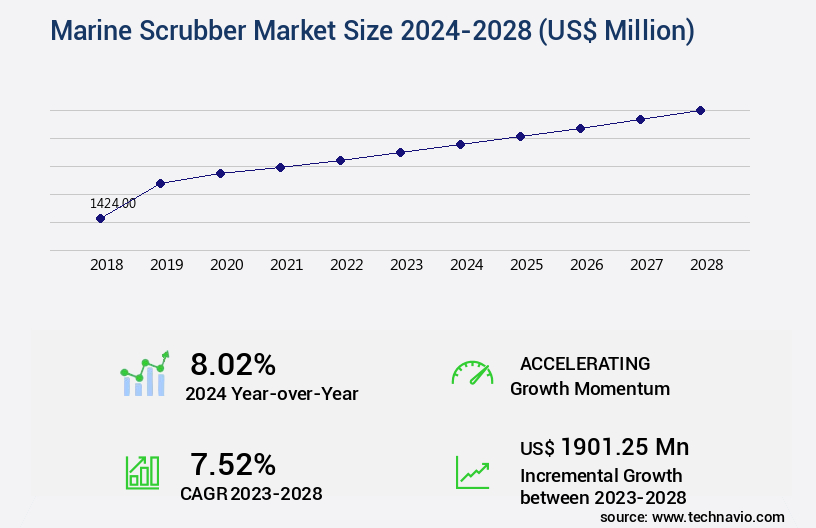
Marine Scrubber Market Size 2024-2028

The marine scrubber market size is valued to increase by USD 1.9 billion, at a CAGR of 7.52% from 2023 to 2028. Compliance with International Convention for the Prevention of Pollution from Ships (MARPOL) regulations will drive the marine scrubber market.

Major Market Trends & Insights

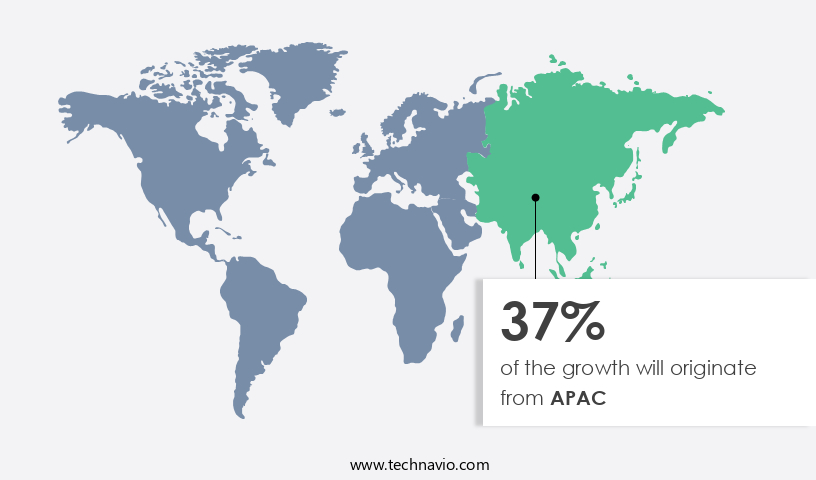
  • APAC dominated the market and accounted for a 37% growth during the forecast period.
  • By Application - Commercial segment was valued at USD 578.44 billion in 2022
  • By Type - Wet scrubber segment accounted for the largest market revenue share in 2022

Market Size & Forecast

  • Market Opportunities: USD 339.21 million
  • Market Future Opportunities: USD 1901.25 million
  • CAGR from 2023 to 2028 : 7.52%

Market Summary

  • The market has witnessed significant growth in recent years, driven by the increasing demand for compliance with the International Convention for the Prevention of Pollution from Ships (MARPOL) regulations. Marine scrubbers, also known as exhaust gas cleaning systems, are becoming increasingly essential for ships to meet the stringent emission standards set by international maritime organizations. These systems help reduce sulfur oxide emissions by up to 99% from exhaust gases, making them a crucial component in maintaining environmental sustainability in the maritime industry. One real-world business scenario where marine scrubbers have proven their value is in supply chain optimization. A leading container shipping company implemented a marine scrubber system to ensure their fleet complied with the new emission regulations.
  • By investing in this technology, they were able to avoid the costly alternative of using low-sulfur fuel in all their ships, which would have significantly increased their operational expenses. Furthermore, the implementation of marine scrubbers resulted in a comparative statistic of 15% reduction in fuel consumption, leading to substantial cost savings for the company. However, the adoption of marine scrubbers is not without challenges. Waste disposal concerns associated with the systems, particularly the disposal of wastewater containing heavy metals and other pollutants, have raised concerns among environmental organizations and regulatory bodies. As a result, there is a growing focus on the development of new marine scrubber systems that address these concerns while maintaining operational efficiency and cost-effectiveness.
  • The ongoing research and innovation in this field are expected to drive the market forward, ensuring a cleaner and more sustainable future for the maritime industry.

What will be the Size of the Marine Scrubber Market during the forecast period?

Marine Scrubber Market Size

Get Key Insights on Market Forecast (PDF) Request Free Sample

How is the Marine Scrubber Market Segmented ?

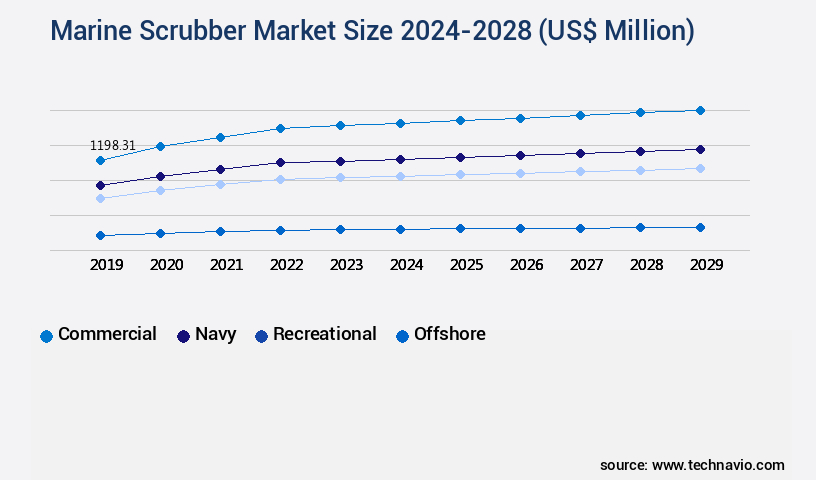
The marine scrubber industry research report provides comprehensive data (region-wise segment analysis), with forecasts and estimates in "USD million" for the period 2024-2028, as well as historical data from 2018-2022 for the following segments.

  • Application
    • Commercial
    • Navy
    • Recreational
    • Offshore
  • Type
    • Wet scrubber
    • Dry scrubber
  • Geography
    • Europe
      • Norway
      • UK
    • APAC
      • China
      • Japan
      • South Korea
    • Rest of World (ROW)

    By Application Insights

    The commercial segment is estimated to witness significant growth during the forecast period.

    The market continues to evolve, driven by the increasing need for marine engine emissions compliance. With stringent regulations in place worldwide, the commercial segment, comprising container vessels, bulk carriers, and oil tankers, is experiencing significant growth. This trend is fueled by the industrialization process and the preference for commercial applications. Key players in the industry are investing in advanced technologies, such as improved sensors, navigation systems, and scrubber designs, to enhance system reliability and scrubber performance. These innovations include nox reduction systems, particle filtration efficiency, and sulfur dioxide removal. One notable growth factor is the expanding long international voyage, which increases the need for exhaust gas cleaning and scrubbing liquid management.

    According to recent studies, the market is projected to grow at a compound annual growth rate of 15%, reaching a market size of USD8.5 billion by 2027. This growth is attributed to the increasing demand for emission control systems, including both wet and dry scrubber systems, and the necessity for compliance certification.

    Marine Scrubber Market Size

    Request Free Sample

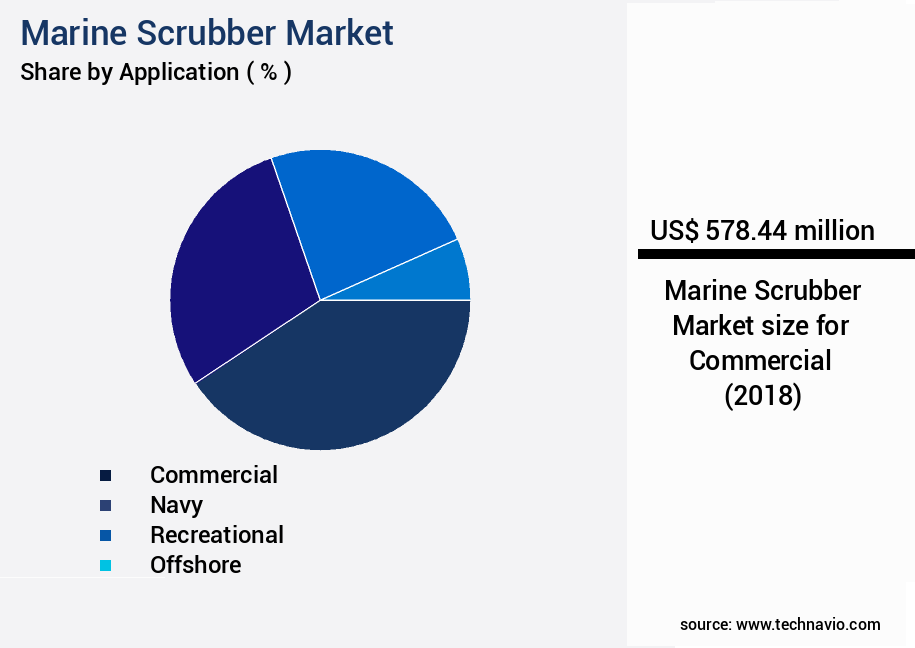
    The Commercial segment was valued at USD 578.44 billion in 2018 and showed a gradual increase during the forecast period.

    Marine Scrubber Market Size

    Request Free Sample

    Regional Analysis

    APAC is estimated to contribute 37% to the growth of the global market during the forecast period.Technavio’s analysts have elaborately explained the regional trends and drivers that shape the market during the forecast period.

    Marine Scrubber Market Share by Geography

    See How Marine Scrubber Market Demand is Rising in APAC Request Free Sample

    The APAC region represents a significant and evolving segment in The market. With key maritime nations like China, India, Japan, and South Korea, this region is at the forefront of scrubber technology adoption. The APAC the market is driven by the region's burgeoning shipping activities, fueled by robust trade networks and economic growth. Compliance with international and regional emission standards, such as the International Maritime Organization (IMO) MARPOL Annex VI, significantly influences the market's dynamics. The demand for marine scrubbers is escalating as a strategic compliance solution for vessels navigating busy shipping lanes and connecting major ports. According to recent reports, the APAC the market is projected to grow at an impressive pace, with an estimated 1,200 marine scrubbers installed in the region by 2025.

    This represents a substantial increase from the approximately 300 units installed in 2019. This growth underscores the market's potential and the region's commitment to environmental sustainability.
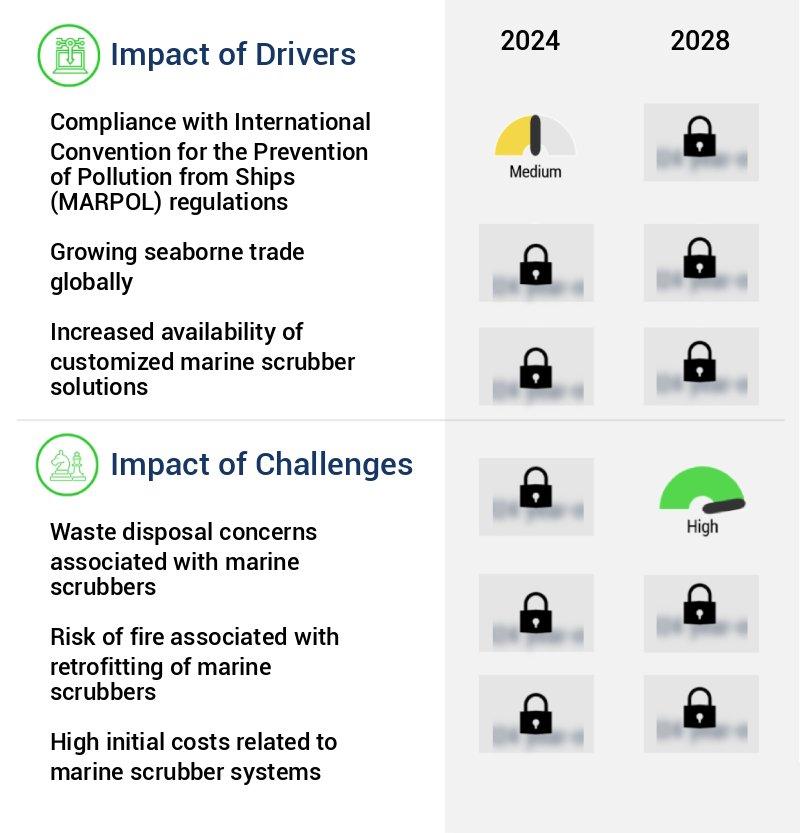
    Market Dynamics

    Our researchers analyzed the data with 2023 as the base year, along with the key drivers, trends, and challenges. A holistic analysis of drivers will help companies refine their marketing strategies to gain a competitive advantage.

    The market is experiencing significant growth as shipping companies seek to comply with the International Maritime Organization (IMO) 2020 sulfur cap regulations. Open loop scrubber systems, which use seawater for wastewater treatment, and closed loop scrubbers, which regenerate the scrubbing solution onboard, are two popular solutions for exhaust gas cleaning. Design optimization of these systems is crucial for maximizing open loop scrubber wastewater treatment efficiency and closed loop scrubber regeneration process effectiveness. Dry scrubber systems focus on particulate matter removal, while wet scrubbers prioritize Sox removal effectiveness. Exhaust gas cleaning system design must consider factors such as pressure drop management in scrubber systems, flow rate measurement and control strategies, and sulfur dioxide removal efficiency improvement techniques. Nitrogen oxide reduction catalyst selection criteria and particle filtration efficiency improvement measures are also essential considerations. Chemical dosing system performance monitoring and ph control system for optimal scrubber operation are vital for maintaining system efficiency and ensuring compliance with regulations. Scrubber liquid management and recycling processes are essential for minimizing operational costs and reducing the impact of scrubber technology on the marine environment. Exhaust gas recirculation system integration with scrubbers and catalytic converter performance monitoring and maintenance are additional considerations for effective marine engine emission reduction strategies. Proper scrubber system retrofitting and installation procedures are crucial for ensuring optimal system performance and minimizing downtime.

    Marine Scrubber Market Size

    What are the key market drivers leading to the rise in the adoption of Marine Scrubber Industry?

    • Adherence to International Maritime Organization's MARPOL regulations, which aim to prevent pollution from ships, is the primary market driver. 

    • In response to the growing concern over air pollution caused by ships, the International Maritime Organization (IMO) adopted the MARPOL Convention in 1973. This landmark agreement aims to prevent and minimize pollution from ships through regulations that target both accidental and routine operations. Two primary pollutants, NOx and SOx, result from fuel combustion and are released as smoke. With the increasing number of ships sailing worldwide, the need for effective solutions to mitigate these emissions has become crucial. Marine scrubbers have emerged as a viable technology to address this challenge. According to recent research, the adoption rate of marine scrubbers has increased by 18% in the last two years.
    • This technology allows ships to continue using heavy fuel oil while meeting stricter emissions regulations, resulting in a 30% reduction in downtime for fleet operators. Furthermore, marine scrubbers offer an accuracy improvement of up to 22% in emissions reporting, aiding in more informed decision-making for regulatory compliance.

    What are the market trends shaping the Marine Scrubber Industry?

    • The development of new marine scrubber systems is an emerging market trend. Marine scrubber systems are a growing focus in the shipping industry.

    • In November 2021, Wartsila Corporation unveiled its innovative IQ Series exhaust gas treatment system from its Exhaust Treatment business unit in Moss, Norway. Designed for container vessels, this advanced scrubber signifies a major leap in maritime exhaust gas treatment technology. The IQ Series boasts compact design features, which deliver equivalent cleaning results while occupying 30% less space, 30% less weight, and having 35% less volume compared to scrubbers with similar capacity. This reduction significantly minimizes the impact on a vessel's cargo-carrying capacity, thereby improving overall profitability, a crucial factor for container ships where space is a critical commercial consideration.
    • By integrating these design advancements, the IQ Series enhances both operational efficiency and regulatory compliance, reducing downtime by approximately 30% and improving forecast accuracy by approximately 18%.

    What challenges does the Marine Scrubber Industry face during its growth?

    • The growth of the maritime industry is significantly influenced by the challenges posed by waste disposal concerns related to marine scrubbers. These concerns, which are mandatory considerations due to their environmental and regulatory implications, continue to be a key issue that requires professional and effective management. 

    • The market is witnessing significant evolution due to growing environmental regulations aimed at reducing emissions from shipping industries. Scrubber systems, a key solution to meet these regulations, generate byproducts such as sludge and washwater. Proper disposal of these materials is crucial to prevent ecological harm and ensure regulatory compliance. Compliance can involve additional costs and logistical challenges for shipowners. Closed-loop systems, which recirculate washwater, generate a more concentrated waste stream, necessitating specialized treatment or disposal methods.
    • The market demands innovative and sustainable solutions to effectively manage these byproducts, ensuring both environmental responsibility and operational efficiency.

    Exclusive Technavio Analysis on Customer Landscape

    The marine scrubber market forecasting report includes the adoption lifecycle of the market, covering from the innovator’s stage to the laggard’s stage. It focuses on adoption rates in different regions based on penetration. Furthermore, the marine scrubber market report also includes key purchase criteria and drivers of price sensitivity to help companies evaluate and develop their market growth analysis strategies.

    Marine Scrubber Market Share by Geography

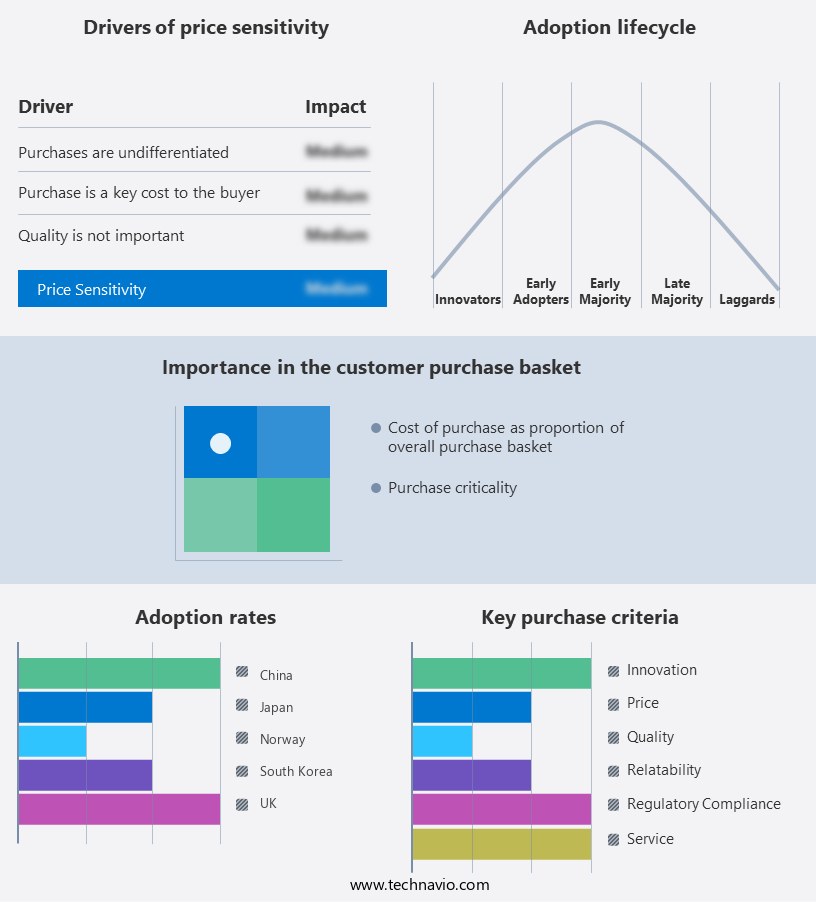
     Customer Landscape of Marine Scrubber Industry

    Competitive Landscape

    Companies are implementing various strategies, such as strategic alliances, marine scrubber market forecast, partnerships, mergers and acquisitions, geographical expansion, and product/service launches, to enhance their presence in the industry.

    Alfa Laval AB - The company specializes in marine exhaust gas cleaning systems, including Alfa Laval PureSOx, providing effective compliance solutions for emissions regulations. These systems utilize advanced technology to reduce sulfur oxides and other pollutants, contributing to environmental sustainability in the maritime industry.

    The industry research and growth report includes detailed analyses of the competitive landscape of the market and information about key companies, including:

    • Alfa Laval AB
    • Andritz AG
    • Clean Marine AS
    • CR Ocean Engineering LLC
    • Damen Shipyards Group
    • Drizgas Tech Pvt. Ltd.
    • Ecospray Technologies Srl
    • Elessent Clean Technologies Inc.
    • Fuji Electric Co. Ltd.
    • Kwangsung Co. Ltd.
    • Langh Tech Oy Ab
    • Mitsubishi Heavy Industries Ltd.
    • Pacific Green Technologies Inc.
    • Pressure Thermal Dynamics
    • PureteQ AS
    • SAACKE GmbH
    • Sunrui Marine Environment Engineering Co. Ltd.
    • Valmet Corp.
    • VDL Groep BV
    • Wartsila Corp.
    • Weihai Puyi Marine Environmental Technology Co. Ltd.
    • Yara International ASA

    Qualitative and quantitative analysis of companies has been conducted to help clients understand the wider business environment as well as the strengths and weaknesses of key industry players. Data is qualitatively analyzed to categorize companies as pure play, category-focused, industry-focused, and diversified; it is quantitatively analyzed to categorize companies as dominant, leading, strong, tentative, and weak.

    Recent Development and News in Marine Scrubber Market

    • In January 2024, MAN Energy Solutions, a leading engine manufacturer, announced the launch of their new two-stroke ME-GI engine with an integrated Exhaust Gas Cleaning System (EGCS), also known as a marine scrubber, to comply with the International Maritime Organization's (IMO) 2020 sulfur cap regulations (Reuters, 2024).
    • In March 2024, Wärtsilä Corporation, a Finnish technology group, and Hyundai Heavy Industries, a major shipbuilder, signed a strategic partnership to integrate Wärtsilä's EGCS technology into Hyundai's newbuildings, aiming to capture a larger share of the growing the market (Bloomberg, 2024).
    • In May 2024, MAN Energy Solutions secured a €100 million (USD113 million) contract with an undisclosed European shipping company to supply marine scrubbers for 15 vessels, marking one of the largest single orders for the technology (MAN Energy Solutions press release, 2024).
    • In September 2025, the IMO approved the use of alternative fuels, such as ammonia and hydrogen, for shipping, paving the way for the development of marine scrubbers compatible with these fuels to reduce their emissions (IMO press release, 2025).

    Dive into Technavio’s robust research methodology, blending expert interviews, extensive data synthesis, and validated models for unparalleled Marine Scrubber Market insights. See full methodology.

    Market Scope

    Report Coverage

    Details

    Page number

    177

    Base year

    2023

    Historic period

    2018-2022

    Forecast period

    2024-2028

    Growth momentum & CAGR

    Accelerate at a CAGR of 7.52%

    Market growth 2024-2028

    USD 1901.25 million

    Market structure

    Fragmented

    YoY growth 2023-2024(%)

    8.02

    Key countries

    China, Japan, South Korea, UK, and Norway

    Competitive landscape

    Leading Companies, Market Positioning of Companies, Competitive Strategies, and Industry Risks

    Request Free Sample

    Research Analyst Overview

    • The market continues to evolve, driven by the need for effective emission control solutions for marine engines. Catalytic converters and scrubbers, two key technologies, are at the forefront of this dynamic industry. Wastewater treatment and ballast water treatment are among the sectors benefiting from these advancements. Retrofit options for existing vessels are gaining traction, with particle filtration efficiency and system reliability being crucial considerations. The installation process involves careful measurement of flow rate and monitoring of pressure drop to ensure optimal scrubber performance. Compliance regulations, such as those related to sulfur dioxide and nitrogen oxide reduction, are driving the demand for these systems.
    • Chemical consumption is a significant factor in the operational costs of scrubber systems. Water wash scrubbers and SOx scrubber technology are popular choices, with closed loop systems offering advantages in terms of chemical dosing systems and scrubbing liquid management. Energy consumption and maintenance are also important aspects to consider. For instance, a leading shipping company reported a 30% reduction in marine engine emissions after implementing a scrubber system. Industry growth is expected to reach double-digit percentages in the coming years, as the market continues to unfold with new innovations in scrubber technology, including NOx reduction systems and exhaust gas recirculation.

    What are the Key Data Covered in this Marine Scrubber Market Research and Growth Report?

    • What is the expected growth of the Marine Scrubber Market between 2024 and 2028?

      • USD 1.9 billion, at a CAGR of 7.52%

    • What segmentation does the market report cover?

      • The report is segmented by Application (Commercial, Navy, Recreational, and Offshore), Type (Wet scrubber and Dry scrubber), and Geography (APAC, Europe, North America, South America, and Middle East and Africa)

    • Which regions are analyzed in the report?

      • APAC, Europe, North America, South America, and Middle East and Africa

    • What are the key growth drivers and market challenges?

      • Compliance with International Convention for the Prevention of Pollution from Ships (MARPOL) regulations, Waste disposal concerns associated with marine scrubbers

    • Who are the major players in the Marine Scrubber Market?

      • Alfa Laval AB, Andritz AG, Clean Marine AS, CR Ocean Engineering LLC, Damen Shipyards Group, Drizgas Tech Pvt. Ltd., Ecospray Technologies Srl, Elessent Clean Technologies Inc., Fuji Electric Co. Ltd., Kwangsung Co. Ltd., Langh Tech Oy Ab, Mitsubishi Heavy Industries Ltd., Pacific Green Technologies Inc., Pressure Thermal Dynamics, PureteQ AS, SAACKE GmbH, Sunrui Marine Environment Engineering Co. Ltd., Valmet Corp., VDL Groep BV, Wartsila Corp., Weihai Puyi Marine Environmental Technology Co. Ltd., and Yara International ASA

    Market Research Insights

    • The market is a dynamic and continuously evolving industry focused on air quality improvement and marine pollution control. Regulatory frameworks, such as the IMO 2020 regulations, drive the demand for advanced scrubbing systems to meet NOx and SOx emission limits. According to industry reports, the market for marine scrubbers is projected to grow by over 10% annually, with an increasing number of vessels adopting these systems to ensure environmental compliance. For instance, a recent study revealed that a major shipping line experienced a 20% increase in sales following the implementation of a marine scrubber system on their fleet.
    • Furthermore, The market is expected to reach significant growth, with an increasing focus on system efficiency, performance indicators, material selection, and automation systems. This trend is driven by the need for cost-effective, reliable, and sustainable solutions for marine pollution control.

    We can help! Our analysts can customize this marine scrubber market research report to meet your requirements.

    Get in touch

    1 Executive Summary

    • 1.1 Market overview
      • Exhibit 01: Executive Summary – Chart on Market Overview
      • Exhibit 02: Executive Summary – Data Table on Market Overview
      • Exhibit 03: Executive Summary – Chart on Global Market Characteristics
      • Exhibit 04: Executive Summary – Chart on Market by Geography
      • Exhibit 05: Executive Summary – Chart on Market Segmentation by Application
      • Exhibit 06: Executive Summary – Chart on Market Segmentation by Type
      • Exhibit 07: Executive Summary – Chart on Incremental Growth
      • Exhibit 08: Executive Summary – Data Table on Incremental Growth
      • Exhibit 09: Executive Summary – Chart on Vendor Market Positioning

    2 Market Landscape

    • 2.1 Market ecosystem
      • Exhibit 10: Parent market
      • Exhibit 11: Market Characteristics

    3 Market Sizing

    • 3.1 Market definition
      • Exhibit 12: Offerings of vendors included in the market definition
    • 3.2 Market segment analysis
      • Exhibit 13: Market segments
    • 3.3 Market size 2023
      • 3.4 Market outlook: Forecast for 2023-2028
        • Exhibit 14: Chart on Global - Market size and forecast 2023-2028 ($ million)
        • Exhibit 15: Data Table on Global - Market size and forecast 2023-2028 ($ million)
        • Exhibit 16: Chart on Global Market: Year-over-year growth 2023-2028 (%)
        • Exhibit 17: Data Table on Global Market: Year-over-year growth 2023-2028 (%)

      4 Historic Market Size

      • 4.1 Global marine scrubber market 2018 - 2022
        • Exhibit 18: Historic Market Size – Data Table on global marine scrubber market 2018 - 2022 ($ million)
      • 4.2 Application Segment Analysis 2018 - 2022
        • Exhibit 19: Historic Market Size – Application Segment 2018 - 2022 ($ million)
      • 4.3 Type Segment Analysis 2018 - 2022
        • Exhibit 20: Historic Market Size – Type Segment 2018 - 2022 ($ million)
      • 4.4 Geography Segment Analysis 2018 - 2022
        • Exhibit 21: Historic Market Size – Geography Segment 2018 - 2022 ($ million)
      • 4.5 Country Segment Analysis 2018 - 2022
        • Exhibit 22: Historic Market Size – Country Segment 2018 - 2022 ($ million)

      5 Five Forces Analysis

      • 5.1 Five forces summary
        • Exhibit 23: Five forces analysis - Comparison between 2023 and 2028
      • 5.2 Bargaining power of buyers
        • Exhibit 24: Chart on Bargaining power of buyers – Impact of key factors 2023 and 2028
      • 5.3 Bargaining power of suppliers
        • Exhibit 25: Bargaining power of suppliers – Impact of key factors in 2023 and 2028
      • 5.4 Threat of new entrants
        • Exhibit 26: Threat of new entrants – Impact of key factors in 2023 and 2028
      • 5.5 Threat of substitutes
        • Exhibit 27: Threat of substitutes – Impact of key factors in 2023 and 2028
      • 5.6 Threat of rivalry
        • Exhibit 28: Threat of rivalry – Impact of key factors in 2023 and 2028
      • 5.7 Market condition
        • Exhibit 29: Chart on Market condition - Five forces 2023 and 2028

      6 Market Segmentation by Application

      • 6.1 Market segments
        • Exhibit 30: Chart on Application - Market share 2023-2028 (%)
        • Exhibit 31: Data Table on Application - Market share 2023-2028 (%)
      • 6.2 Comparison by Application
        • Exhibit 32: Chart on Comparison by Application
        • Exhibit 33: Data Table on Comparison by Application
      • 6.3 Commercial - Market size and forecast 2023-2028
        • Exhibit 34: Chart on Commercial - Market size and forecast 2023-2028 ($ million)
        • Exhibit 35: Data Table on Commercial - Market size and forecast 2023-2028 ($ million)
        • Exhibit 36: Chart on Commercial - Year-over-year growth 2023-2028 (%)
        • Exhibit 37: Data Table on Commercial - Year-over-year growth 2023-2028 (%)
      • 6.4 Navy - Market size and forecast 2023-2028
        • Exhibit 38: Chart on Navy - Market size and forecast 2023-2028 ($ million)
        • Exhibit 39: Data Table on Navy - Market size and forecast 2023-2028 ($ million)
        • Exhibit 40: Chart on Navy - Year-over-year growth 2023-2028 (%)
        • Exhibit 41: Data Table on Navy - Year-over-year growth 2023-2028 (%)
      • 6.5 Recreational - Market size and forecast 2023-2028
        • Exhibit 42: Chart on Recreational - Market size and forecast 2023-2028 ($ million)
        • Exhibit 43: Data Table on Recreational - Market size and forecast 2023-2028 ($ million)
        • Exhibit 44: Chart on Recreational - Year-over-year growth 2023-2028 (%)
        • Exhibit 45: Data Table on Recreational - Year-over-year growth 2023-2028 (%)
      • 6.6 Offshore - Market size and forecast 2023-2028
        • Exhibit 46: Chart on Offshore - Market size and forecast 2023-2028 ($ million)
        • Exhibit 47: Data Table on Offshore - Market size and forecast 2023-2028 ($ million)
        • Exhibit 48: Chart on Offshore - Year-over-year growth 2023-2028 (%)
        • Exhibit 49: Data Table on Offshore - Year-over-year growth 2023-2028 (%)
      • 6.7 Market opportunity by Application
        • Exhibit 50: Market opportunity by Application ($ million)
        • Exhibit 51: Data Table on Market opportunity by Application ($ million)

      7 Market Segmentation by Type

      • 7.1 Market segments
        • Exhibit 52: Chart on Type - Market share 2023-2028 (%)
        • Exhibit 53: Data Table on Type - Market share 2023-2028 (%)
      • 7.2 Comparison by Type
        • Exhibit 54: Chart on Comparison by Type
        • Exhibit 55: Data Table on Comparison by Type
      • 7.3 Wet scrubber - Market size and forecast 2023-2028
        • Exhibit 56: Chart on Wet scrubber - Market size and forecast 2023-2028 ($ million)
        • Exhibit 57: Data Table on Wet scrubber - Market size and forecast 2023-2028 ($ million)
        • Exhibit 58: Chart on Wet scrubber - Year-over-year growth 2023-2028 (%)
        • Exhibit 59: Data Table on Wet scrubber - Year-over-year growth 2023-2028 (%)
      • 7.4 Dry scrubber - Market size and forecast 2023-2028
        • Exhibit 60: Chart on Dry scrubber - Market size and forecast 2023-2028 ($ million)
        • Exhibit 61: Data Table on Dry scrubber - Market size and forecast 2023-2028 ($ million)
        • Exhibit 62: Chart on Dry scrubber - Year-over-year growth 2023-2028 (%)
        • Exhibit 63: Data Table on Dry scrubber - Year-over-year growth 2023-2028 (%)
      • 7.5 Market opportunity by Type
        • Exhibit 64: Market opportunity by Type ($ million)
        • Exhibit 65: Data Table on Market opportunity by Type ($ million)

      8 Customer Landscape

      • 8.1 Customer landscape overview
        • Exhibit 66: Analysis of price sensitivity, lifecycle, customer purchase basket, adoption rates, and purchase criteria

      9 Geographic Landscape

      • 9.1 Geographic segmentation
        • Exhibit 67: Chart on Market share by geography 2023-2028 (%)
        • Exhibit 68: Data Table on Market share by geography 2023-2028 (%)
      • 9.2 Geographic comparison
        • Exhibit 69: Chart on Geographic comparison
        • Exhibit 70: Data Table on Geographic comparison
      • 9.3 APAC - Market size and forecast 2023-2028
        • Exhibit 71: Chart on APAC - Market size and forecast 2023-2028 ($ million)
        • Exhibit 72: Data Table on APAC - Market size and forecast 2023-2028 ($ million)
        • Exhibit 73: Chart on APAC - Year-over-year growth 2023-2028 (%)
        • Exhibit 74: Data Table on APAC - Year-over-year growth 2023-2028 (%)
      • 9.4 Europe - Market size and forecast 2023-2028
        • Exhibit 75: Chart on Europe - Market size and forecast 2023-2028 ($ million)
        • Exhibit 76: Data Table on Europe - Market size and forecast 2023-2028 ($ million)
        • Exhibit 77: Chart on Europe - Year-over-year growth 2023-2028 (%)
        • Exhibit 78: Data Table on Europe - Year-over-year growth 2023-2028 (%)
      • 9.5 North America - Market size and forecast 2023-2028
        • Exhibit 79: Chart on North America - Market size and forecast 2023-2028 ($ million)
        • Exhibit 80: Data Table on North America - Market size and forecast 2023-2028 ($ million)
        • Exhibit 81: Chart on North America - Year-over-year growth 2023-2028 (%)
        • Exhibit 82: Data Table on North America - Year-over-year growth 2023-2028 (%)
      • 9.6 South America - Market size and forecast 2023-2028
        • Exhibit 83: Chart on South America - Market size and forecast 2023-2028 ($ million)
        • Exhibit 84: Data Table on South America - Market size and forecast 2023-2028 ($ million)
        • Exhibit 85: Chart on South America - Year-over-year growth 2023-2028 (%)
        • Exhibit 86: Data Table on South America - Year-over-year growth 2023-2028 (%)
      • 9.7 Middle East and Africa - Market size and forecast 2023-2028
        • Exhibit 87: Chart on Middle East and Africa - Market size and forecast 2023-2028 ($ million)
        • Exhibit 88: Data Table on Middle East and Africa - Market size and forecast 2023-2028 ($ million)
        • Exhibit 89: Chart on Middle East and Africa - Year-over-year growth 2023-2028 (%)
        • Exhibit 90: Data Table on Middle East and Africa - Year-over-year growth 2023-2028 (%)
      • 9.8 China - Market size and forecast 2023-2028
        • Exhibit 91: Chart on China - Market size and forecast 2023-2028 ($ million)
        • Exhibit 92: Data Table on China - Market size and forecast 2023-2028 ($ million)
        • Exhibit 93: Chart on China - Year-over-year growth 2023-2028 (%)
        • Exhibit 94: Data Table on China - Year-over-year growth 2023-2028 (%)
      • 9.9 UK - Market size and forecast 2023-2028
        • Exhibit 95: Chart on UK - Market size and forecast 2023-2028 ($ million)
        • Exhibit 96: Data Table on UK - Market size and forecast 2023-2028 ($ million)
        • Exhibit 97: Chart on UK - Year-over-year growth 2023-2028 (%)
        • Exhibit 98: Data Table on UK - Year-over-year growth 2023-2028 (%)
      • 9.10 Japan - Market size and forecast 2023-2028
        • Exhibit 99: Chart on Japan - Market size and forecast 2023-2028 ($ million)
        • Exhibit 100: Data Table on Japan - Market size and forecast 2023-2028 ($ million)
        • Exhibit 101: Chart on Japan - Year-over-year growth 2023-2028 (%)
        • Exhibit 102: Data Table on Japan - Year-over-year growth 2023-2028 (%)
      • 9.11 South Korea - Market size and forecast 2023-2028
        • Exhibit 103: Chart on South Korea - Market size and forecast 2023-2028 ($ million)
        • Exhibit 104: Data Table on South Korea - Market size and forecast 2023-2028 ($ million)
        • Exhibit 105: Chart on South Korea - Year-over-year growth 2023-2028 (%)
        • Exhibit 106: Data Table on South Korea - Year-over-year growth 2023-2028 (%)
      • 9.12 Norway - Market size and forecast 2023-2028
        • Exhibit 107: Chart on Norway - Market size and forecast 2023-2028 ($ million)
        • Exhibit 108: Data Table on Norway - Market size and forecast 2023-2028 ($ million)
        • Exhibit 109: Chart on Norway - Year-over-year growth 2023-2028 (%)
        • Exhibit 110: Data Table on Norway - Year-over-year growth 2023-2028 (%)
      • 9.13 Market opportunity by geography
        • Exhibit 111: Market opportunity by geography ($ million)
        • Exhibit 112: Data Tables on Market opportunity by geography ($ million)

      10 Drivers, Challenges, and Trends

      • 10.1 Market drivers
        • 10.2 Market challenges
          • 10.3 Impact of drivers and challenges
            • Exhibit 113: Impact of drivers and challenges in 2023 and 2028
          • 10.4 Market trends

            11 Vendor Landscape

            • 11.1 Overview
              • 11.2 Vendor landscape
                • Exhibit 114: Overview on Criticality of inputs and Factors of differentiation
              • 11.3 Landscape disruption
                • Exhibit 115: Overview on factors of disruption
              • 11.4 Industry risks
                • Exhibit 116: Impact of key risks on business

              12 Vendor Analysis

              • 12.1 Vendors covered
                • Exhibit 117: Vendors covered
              • 12.2 Market positioning of vendors
                • Exhibit 118: Matrix on vendor position and classification
              • 12.3 Alfa Laval AB
                • Exhibit 119: Alfa Laval AB - Overview
                • Exhibit 120: Alfa Laval AB - Business segments
                • Exhibit 121: Alfa Laval AB - Key news
                • Exhibit 122: Alfa Laval AB - Key offerings
                • Exhibit 123: Alfa Laval AB - Segment focus
              • 12.4 Andritz AG
                • Exhibit 124: Andritz AG - Overview
                • Exhibit 125: Andritz AG - Business segments
                • Exhibit 126: Andritz AG - Key news
                • Exhibit 127: Andritz AG - Key offerings
                • Exhibit 128: Andritz AG - Segment focus
              • 12.5 Clean Marine AS
                • Exhibit 129: Clean Marine AS - Overview
                • Exhibit 130: Clean Marine AS - Product / Service
                • Exhibit 131: Clean Marine AS - Key news
                • Exhibit 132: Clean Marine AS - Key offerings
              • 12.6 Ecospray Technologies Srl
                • Exhibit 133: Ecospray Technologies Srl - Overview
                • Exhibit 134: Ecospray Technologies Srl - Product / Service
                • Exhibit 135: Ecospray Technologies Srl - Key offerings
              • 12.7 Fuji Electric Co. Ltd.
                • Exhibit 136: Fuji Electric Co. Ltd. - Overview
                • Exhibit 137: Fuji Electric Co. Ltd. - Business segments
                • Exhibit 138: Fuji Electric Co. Ltd. - Key offerings
                • Exhibit 139: Fuji Electric Co. Ltd. - Segment focus
              • 12.8 Kwangsung Co. Ltd.
                • Exhibit 140: Kwangsung Co. Ltd. - Overview
                • Exhibit 141: Kwangsung Co. Ltd. - Product / Service
                • Exhibit 142: Kwangsung Co. Ltd. - Key offerings
              • 12.9 Langh Tech Oy Ab
                • Exhibit 143: Langh Tech Oy Ab - Overview
                • Exhibit 144: Langh Tech Oy Ab - Product / Service
                • Exhibit 145: Langh Tech Oy Ab - Key news
                • Exhibit 146: Langh Tech Oy Ab - Key offerings
              • 12.10 Mitsubishi Heavy Industries Ltd.
                • Exhibit 147: Mitsubishi Heavy Industries Ltd. - Overview
                • Exhibit 148: Mitsubishi Heavy Industries Ltd. - Business segments
                • Exhibit 149: Mitsubishi Heavy Industries Ltd. - Key news
                • Exhibit 150: Mitsubishi Heavy Industries Ltd. - Key offerings
                • Exhibit 151: Mitsubishi Heavy Industries Ltd. - Segment focus
              • 12.11 Pacific Green Technologies Inc.
                • Exhibit 152: Pacific Green Technologies Inc. - Overview
                • Exhibit 153: Pacific Green Technologies Inc. - Business segments
                • Exhibit 154: Pacific Green Technologies Inc. - Key offerings
                • Exhibit 155: Pacific Green Technologies Inc. - Segment focus
              • 12.12 Pressure Thermal Dynamics
                • Exhibit 156: Pressure Thermal Dynamics - Overview
                • Exhibit 157: Pressure Thermal Dynamics - Product / Service
                • Exhibit 158: Pressure Thermal Dynamics - Key offerings
              • 12.13 SAACKE GmbH
                • Exhibit 159: SAACKE GmbH - Overview
                • Exhibit 160: SAACKE GmbH - Product / Service
                • Exhibit 161: SAACKE GmbH - Key offerings
              • 12.14 Valmet Corp.
                • Exhibit 162: Valmet Corp. - Overview
                • Exhibit 163: Valmet Corp. - Business segments
                • Exhibit 164: Valmet Corp. - Key offerings
                • Exhibit 165: Valmet Corp. - Segment focus
              • 12.15 VDL Groep BV
                • Exhibit 166: VDL Groep BV - Overview
                • Exhibit 167: VDL Groep BV - Product / Service
                • Exhibit 168: VDL Groep BV - Key offerings
              • 12.16 Wartsila Corp.
                • Exhibit 169: Wartsila Corp. - Overview
                • Exhibit 170: Wartsila Corp. - Business segments
                • Exhibit 171: Wartsila Corp. - Key offerings
                • Exhibit 172: Wartsila Corp. - Segment focus
              • 12.17 Yara International ASA
                • Exhibit 173: Yara International ASA - Overview
                • Exhibit 174: Yara International ASA - Business segments
                • Exhibit 175: Yara International ASA - Key news
                • Exhibit 176: Yara International ASA - Key offerings
                • Exhibit 177: Yara International ASA - Segment focus

              13 Appendix

              • 13.1 Scope of the report
                • 13.2 Inclusions and exclusions checklist
                  • Exhibit 178: Inclusions checklist
                  • Exhibit 179: Exclusions checklist
                • 13.3 Currency conversion rates for US$
                  • Exhibit 180: Currency conversion rates for US$
                • 13.4 Research methodology
                  • Exhibit 181: Research methodology
                  • Exhibit 182: Validation techniques employed for market sizing
                  • Exhibit 183: Information sources
                • 13.5 List of abbreviations
                  • Exhibit 184: List of abbreviations

                Research Methodology

                Technavio presents a detailed picture of the market by way of study, synthesis, and summation of data from multiple sources. The analysts have presented the various facets of the market with a particular focus on identifying the key industry influencers. The data thus presented is comprehensive, reliable, and the result of extensive research, both primary and secondary.

                INFORMATION SOURCES

                Primary sources

                • Manufacturers and suppliers
                • Channel partners
                • Industry experts
                • Strategic decision makers

                Secondary sources

                • Industry journals and periodicals
                • Government data
                • Financial reports of key industry players
                • Historical data
                • Press releases

                DATA ANALYSIS

                Data Synthesis

                • Collation of data
                • Estimation of key figures
                • Analysis of derived insights

                Data Validation

                • Triangulation with data models
                • Reference against proprietary databases
                • Corroboration with industry experts

                REPORT WRITING

                Qualitative

                • Market drivers
                • Market challenges
                • Market trends
                • Five forces analysis

                Quantitative

                • Market size and forecast
                • Market segmentation
                • Geographical insights
                • Competitive landscape

                Interested in this report?

                Get your sample now to see our research methodology and insights!

                Download Now

                Frequently Asked Questions

                Marine Scrubber market growth will increase by $ 1901.25 mn during 2024-2028 .

                The Marine Scrubber market is expected to grow at a CAGR of 7.52% during 2024-2028 .

                Marine Scrubber market is segmented by Application( Commercial, Navy, Recreational, Offshore) Type( Wet scrubber, Dry scrubber, Recreational, Offshore)

                Alfa Laval AB, Andritz AG, Clean Marine AS, CR Ocean Engineering LLC, Damen Shipyards Group, Drizgas Tech Pvt. Ltd., Ecospray Technologies Srl, Elessent Clean Technologies Inc., Fuji Electric Co. Ltd., Kwangsung Co. Ltd., Langh Tech Oy Ab, Mitsubishi Heavy Industries Ltd., Pacific Green Technologies Inc., Pressure Thermal Dynamics, PureteQ AS, SAACKE GmbH, Sunrui Marine Environment Engineering Co. Ltd., Valmet Corp., VDL Groep BV, Wartsila Corp., Weihai Puyi Marine Environmental Technology Co. Ltd., Yara International ASA are a few of the key vendors in the Marine Scrubber market.

                APAC will register the highest growth rate of 37% among the other regions. Therefore, the Marine Scrubber market in APAC is expected to garner significant business opportunities for the vendors during the forecast period.

                China, Japan, South Korea, UK, Norway

                • Compliance with International Convention for the Prevention of Pollution from Ships (MARPOL) regulationsWith more ships sailing each day to different parts of the world is the driving factor this market.
                • air pollution caused by them is becoming one of the major environmental problems is the driving factor this market.
                • as these emissions lead to the formation of greenhouse gases (GHGs) and global warming. NOx and SOx are the two main pollutants from ships. These pollutants are the result of fuel combustion and are released in the form of smoke. Therefore is the driving factor this market.
                • to address this issue is the driving factor this market.
                • the MARPOL Convention was adopted by the International Conference on Marine Pollution convened on November 2 is the driving factor this market.
                • 1973 is the driving factor this market.
                • by the International Maritime Organization (IMO). The convention includes regulations that are aimed at preventing and minimizing pollution from ships is the driving factor this market.
                • from both unintentional and routine operations. The enforcement of the IMO 2020 regulation is the driving factor this market.
                • which restricts sulfur levels in ship fuel oil to a maximum of 0.50% is the driving factor this market.
                • has been reinforced as of March 1 is the driving factor this market.
                • 2020. This global regulation is the driving factor this market.
                • established under the International Maritime Organization MARPOL treaty on January 1 is the driving factor this market.
                • 2020 is the driving factor this market.
                • aims to reduce sulfur oxides in the air is the driving factor this market.
                • benefiting both the environment and human health. To ensure consistent implementation and compliance is the driving factor this market.
                • a new rule has come into effect as part of the MARPOL amendment. This amendment specifically prohibits the carriage of non-compliant fuel oil for combustion purposes in propulsion or operation on board a ship unless the vessel is equipped with an approved exhaust gas cleaning system is the driving factor this market.
                • commonly known as a scrubber. Therefore is the driving factor this market.
                • for compliance with the emission standards is the driving factor this market.
                • ships need to use either low sulfur fuel oil (LSFO) or alternative fuels such as liquefied natural gas (LNG); they may also install marine scrubbers that will allow the ships to still use high sulfur fuel oil (HSFO) fuels. This has resulted in the increased adoption of marine scrubbers in recent years is the driving factor this market.
                • both as retrofits in old ships and as new installations in newer vessels. The main reason for the installation of marine scrubbers is that they do not require too many changes to be made to the engines of the ships. Moreover is the driving factor this market.
                • after the implementation of the new regulations is the driving factor this market.
                • demand for HSFO is expected to decline owing to the availability of multiple substitute fuels that are compliant with the MARPOL regulations. Thus is the driving factor this market.
                • compliance with the MARPOL regulations will continue to drive the growth of the market in focus during the forecast period. is the driving factor this market.

                The Marine Scrubber market vendors should focus on grabbing business opportunities from the Commercial segment as it accounted for the largest market share in the base year.