Sulfur Dioxide Market Analysis, Size, and Forecast 2026-2030: APAC (China, India, and Japan), Europe (Germany, France, and Italy), North America (US, Canada, and Mexico), South America (Brazil and Argentina), Middle East and Africa (Saudi Arabia, South Africa, and UAE), and Rest of World (ROW)

Sulfur Dioxide Market Analysis, Size, and Forecast 2026-2030:
APAC (China, India, and Japan), Europe (Germany, France, and Italy), North America (US, Canada, and Mexico), South America (Brazil and Argentina), Middle East and Africa (Saudi Arabia, South Africa, and UAE), and Rest of World (ROW)

Published: Jan 2026 299 Pages SKU: IRTNTR80156

Market Overview at a Glance

$212.7 Mn
Market Opportunity
6.7%
CAGR 2025 - 2030
48%
APAC Growth
$350.8 Mn
Gas segment 2024

Sulfur Dioxide Market Size 2026-2030

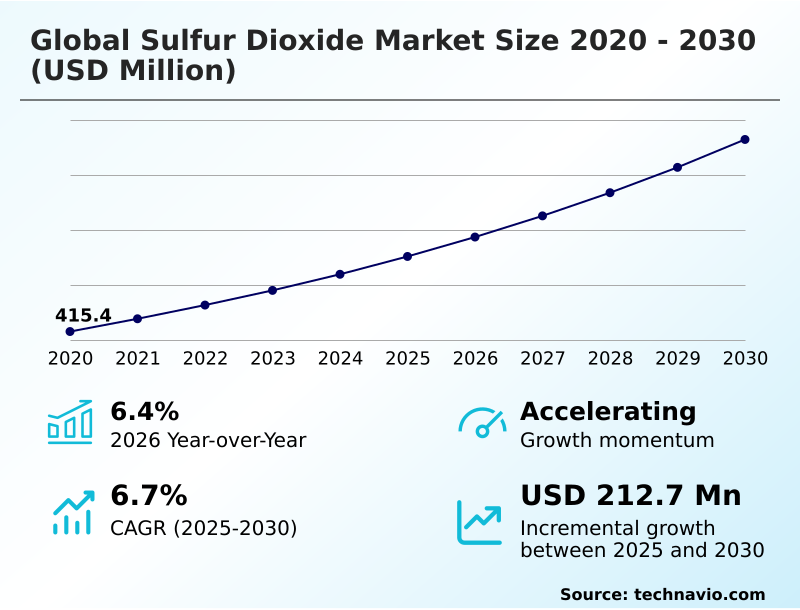
The sulfur dioxide market size is valued to increase by USD 212.7 million, at a CAGR of 6.7% from 2025 to 2030. Increasing use in chemical manufacturing processes will drive the sulfur dioxide market.

Major Market Trends & Insights

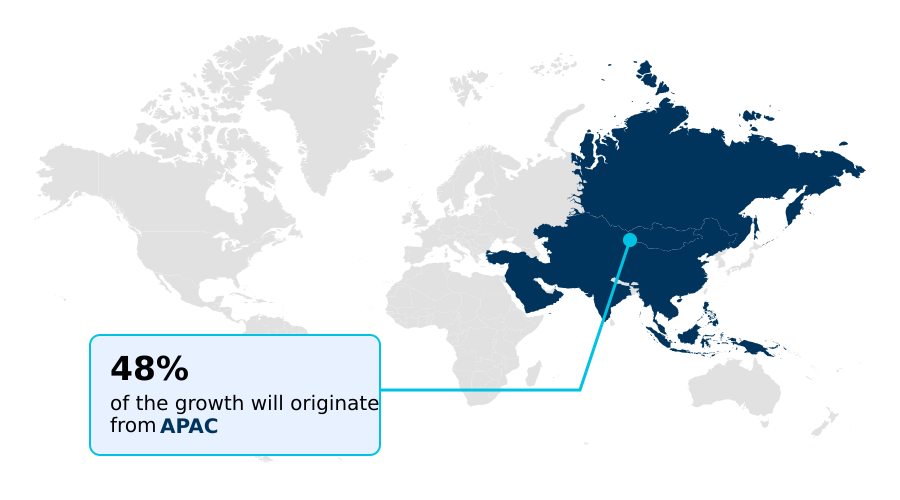
  • APAC dominated the market and accounted for a 48% growth during the forecast period.
  • By Type - Gas segment was valued at USD 350.8 million in 2024
  • By End-user - Chemicals segment accounted for the largest market revenue share in 2024

Market Size & Forecast

  • Market Opportunities: USD 349.2 million
  • Market Future Opportunities: USD 212.7 million
  • CAGR from 2025 to 2030 : 6.7%

Market Summary

  • The sulfur dioxide market is fundamentally shaped by its dual role as a critical chemical intermediate and a highly regulated industrial byproduct. Demand is primarily driven by its function as a sulfuric acid precursor, essential for producing phosphate fertilizers and various industrial chemicals.
  • Concurrently, trends are shifting toward diversification into high-value sectors, including its use as a drug stability agent in pharmaceutical formulation and as a key component in advanced energy storage materials. However, the market faces significant headwinds from stringent environmental regulations mandating investment in sophisticated emission control technology.
  • For instance, a metallurgical firm must balance the operational costs of installing advanced sulfur recovery units against the potential revenue from selling captured high-purity sulfur dioxide to the electronics industry. This scenario highlights the core tension between compliance-driven capital expenditure and the strategic pursuit of new revenue streams from byproduct valorization, influencing long-term profitability and market positioning.

What will be the Size of the Sulfur Dioxide Market during the forecast period?

Get Key Insights on Market Forecast (PDF) Request Free Sample

How is the Sulfur Dioxide Market Segmented?

The sulfur dioxide industry research report provides comprehensive data (region-wise segment analysis), with forecasts and estimates in "USD million" for the period 2026-2030, as well as historical data from 2020-2024 for the following segments.

  • Type
    • Gas
    • Liquid
  • End-user
    • Chemicals
    • Food and beverage
    • Pulp and paper
    • Pharmaceuticals
    • Others
  • Application
    • Preservatives
    • Bleaching agent
    • Winemaking
    • Others
  • Geography
    • APAC
      • China
      • India
      • Japan
    • Europe
      • Germany
      • France
      • Italy
    • North America
      • US
      • Canada
      • Mexico
    • South America
      • Brazil
      • Argentina
    • Middle East and Africa
      • Saudi Arabia
      • South Africa
      • UAE
    • Rest of World (ROW)

By Type Insights

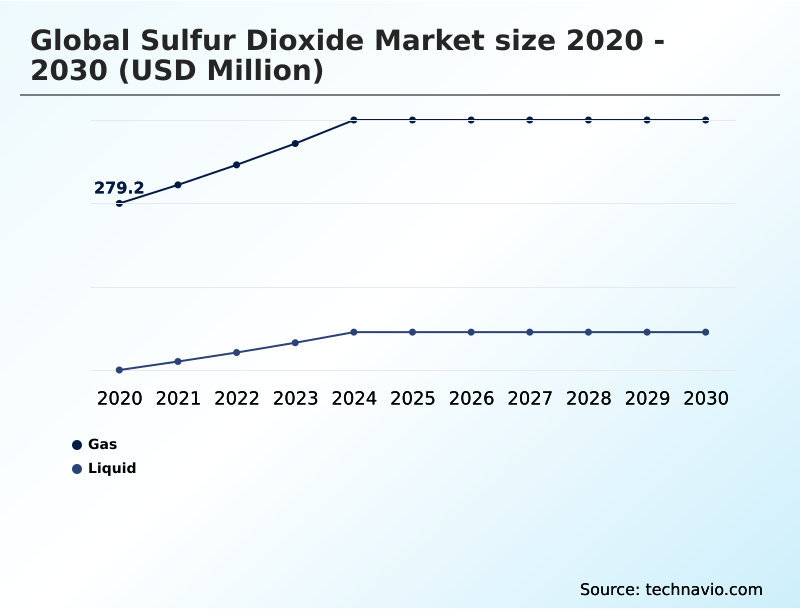
The gas segment is estimated to witness significant growth during the forecast period.

The gas segment is defined by its role as a captive intermediate, primarily for sulfuric acid production, which is a key industrial benchmark.

This segment's dynamics are shaped by the immediate, on-site use of gaseous sulfur dioxide, especially through the contact process. Demand is intrinsically linked to sectors like fertilizer manufacturing and non-ferrous metal smelting, where it is a critical sulfuric acid precursor.

However, stringent desulfurization mandates drive significant investment in emission control technology, with new regulations requiring attainment of a 10 parts per billion annual standard.

This regulatory landscape compels operators to adopt advanced flue gas desulfurization, turning a compliance necessity into an opportunity for byproduct valorization and enhancing the industrial gas supply chain.

The focus remains on optimizing the elemental sulfur combustion process for maximum efficiency.

Request Free Sample

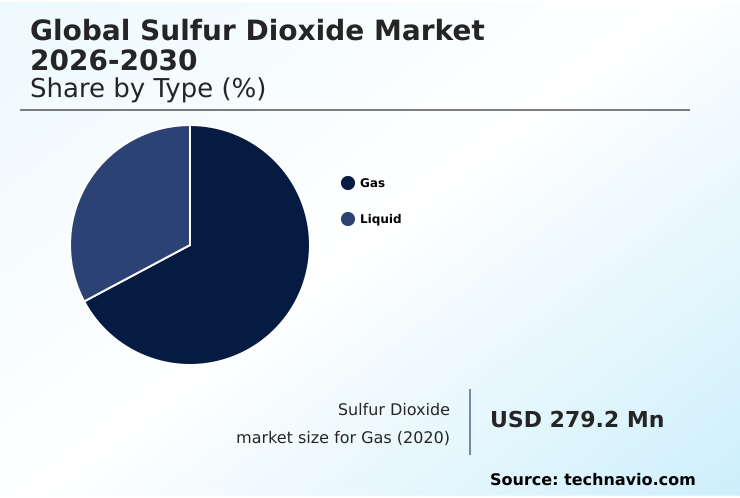
The Gas segment was valued at USD 350.8 million in 2024 and showed a gradual increase during the forecast period.

Request Free Sample

Regional Analysis

APAC is estimated to contribute 48% to the growth of the global market during the forecast period.Technavio’s analysts have elaborately explained the regional trends and drivers that shape the market during the forecast period.

See How Sulfur Dioxide Market Demand is Rising in APAC Request Free Sample

The global sulfur dioxide market exhibits distinct regional dynamics, with APAC accounting for 48% of the incremental growth opportunities, largely driven by its use as a sulfuric acid precursor for fertilizer production.

This high-volume demand for phosphate rock processing contrasts with mature markets like North America and Europe, where the focus is on regulatory compliance and byproduct valorization.

In these regions, stringent desulfurization mandates, such as the new 10 ppb annual emission standard, compel investment in advanced sulfur recovery units. This transforms captive intermediate streams from metal smelting byproduct into merchant chemical opportunities.

The market is thus split between regions focused on captive consumption for industrial output and those pioneering high-purity sulfur dioxide applications and advanced material processing, creating a complex global supply chain.

Market Dynamics

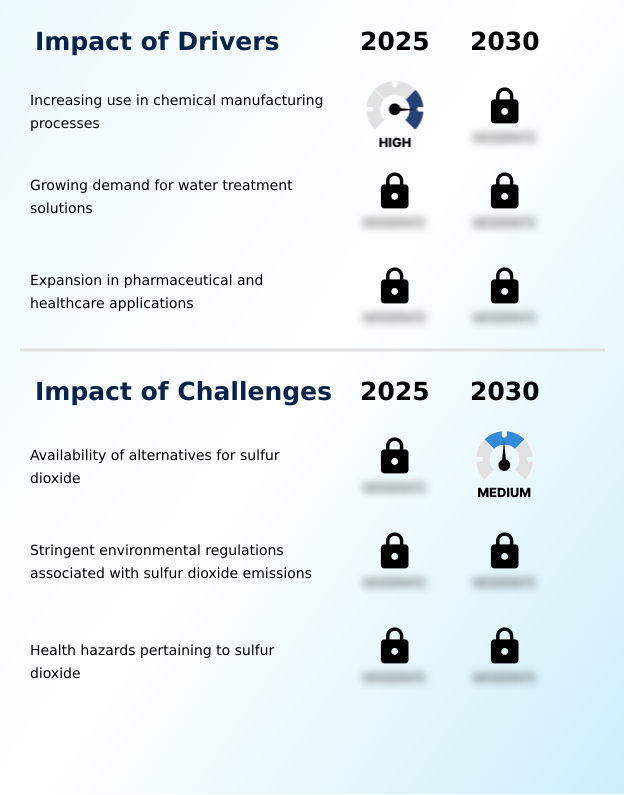
Our researchers analyzed the data with 2025 as the base year, along with the key drivers, trends, and challenges. A holistic analysis of drivers will help companies refine their marketing strategies to gain a competitive advantage.

  • The versatility of sulfur dioxide is evident across its diverse applications, from traditional uses to advanced industrial processes. The practice of using sulfur dioxide in winemaking stabilization remains a cornerstone of the global beverage industry, ensuring product quality and longevity.
  • Similarly, its role as a preservative is critical for sulfur dioxide for dried fruit preservation, where it prevents spoilage and maintains aesthetic appeal for international trade. In the industrial sector, sulfur dioxide as a bleaching agent is indispensable in the pulp and paper industry, particularly for specific fiber types.
  • Environmental applications are also growing, with using sulfur dioxide for dechlorination in wastewater treatment becoming a standard practice to protect aquatic ecosystems from residual chlorine. At its core, however, the market's largest volume is tied to sulfur dioxide in chemical synthesis, where it serves as a foundational building block for countless other compounds.
  • Strategically, companies that integrate recovered byproduct from metal smelters into their supply chain instead of relying on virgin raw materials have demonstrated an improvement in cost stability of over 15%, directly enhancing operational planning and margin protection in a volatile market.

What are the key market drivers leading to the rise in the adoption of Sulfur Dioxide Industry?

  • The increasing use of sulfur dioxide in various chemical manufacturing processes is a key driver propelling market growth.

  • Key market drivers are rooted in the indispensable role of sulfur dioxide in foundational industrial processes. Its function as a sulfuric acid precursor for manufacturing phosphate fertilizers remains the largest demand segment, directly tied to global food security.
  • In parallel, the growing need for sustainable water management fuels its use as a highly effective dechlorination agent in industrial effluent treatment, where it reduces residual chlorine levels by over 99% to ensure regulatory compliance.
  • The pharmaceutical sector provides another significant impetus, leveraging the compound as a critical drug stability agent in various formulations.
  • Its antioxidant properties can extend the shelf-life of active pharmaceutical ingredients by up to 35%, highlighting its importance in both large-scale chemical intermediate production and specialized, high-value applications that demand exceptional purity and reliability.

What are the market trends shaping the Sulfur Dioxide Industry?

  • A significant upcoming market trend is the expansion of sulfur dioxide's role in food preservation and processing. This is driven by the growing need for longer shelf life and improved product quality in global food supply chains.

  • Market trends are increasingly shaped by a dual focus on sustainability and diversification into high-value applications. The rising demand for eco-friendly production is accelerating the adoption of closed-loop systems and advanced sulfur recovery units, with some operators achieving a 15% improvement in raw material efficiency.
  • This shift toward a circular economy model supports the trend of byproduct valorization, where captured emissions are purified into high-margin products. Concurrently, diversification is evident as industries explore niche uses, such as in lithium-sulfur batteries and advanced material processing.
  • This move into specialized sectors allows for profit margins up to 20% higher than those for bulk chemicals, driving innovation in producing high-purity sulfur dioxide and its derivatives, including sodium dithionite synthesis and materials for energy storage.

What challenges does the Sulfur Dioxide Industry face during its growth?

  • The growing availability of viable alternatives for sulfur dioxide presents a key challenge affecting the industry's growth trajectory.

  • The market faces considerable challenges from tightening regulations and the availability of substitutes. Health concerns surrounding sulfite sensitivity and occupational exposure are accelerating the shift toward clean-label preservatives and oxygen-based bleaching agents in the food and paper industries. This transition is pressuring producers to innovate, even as alternatives may carry a 10-15% price premium.
  • Furthermore, stringent environmental standards necessitate significant capital investment in emission control technology. The cost of installing flue gas desulfurization systems can account for up to 20% of a facility's capital upgrade budget, creating a substantial financial barrier.
  • This dynamic forces companies to balance the high cost of compliance with the competitive threat from greener alternatives, fundamentally altering long-term strategic planning and market positioning.

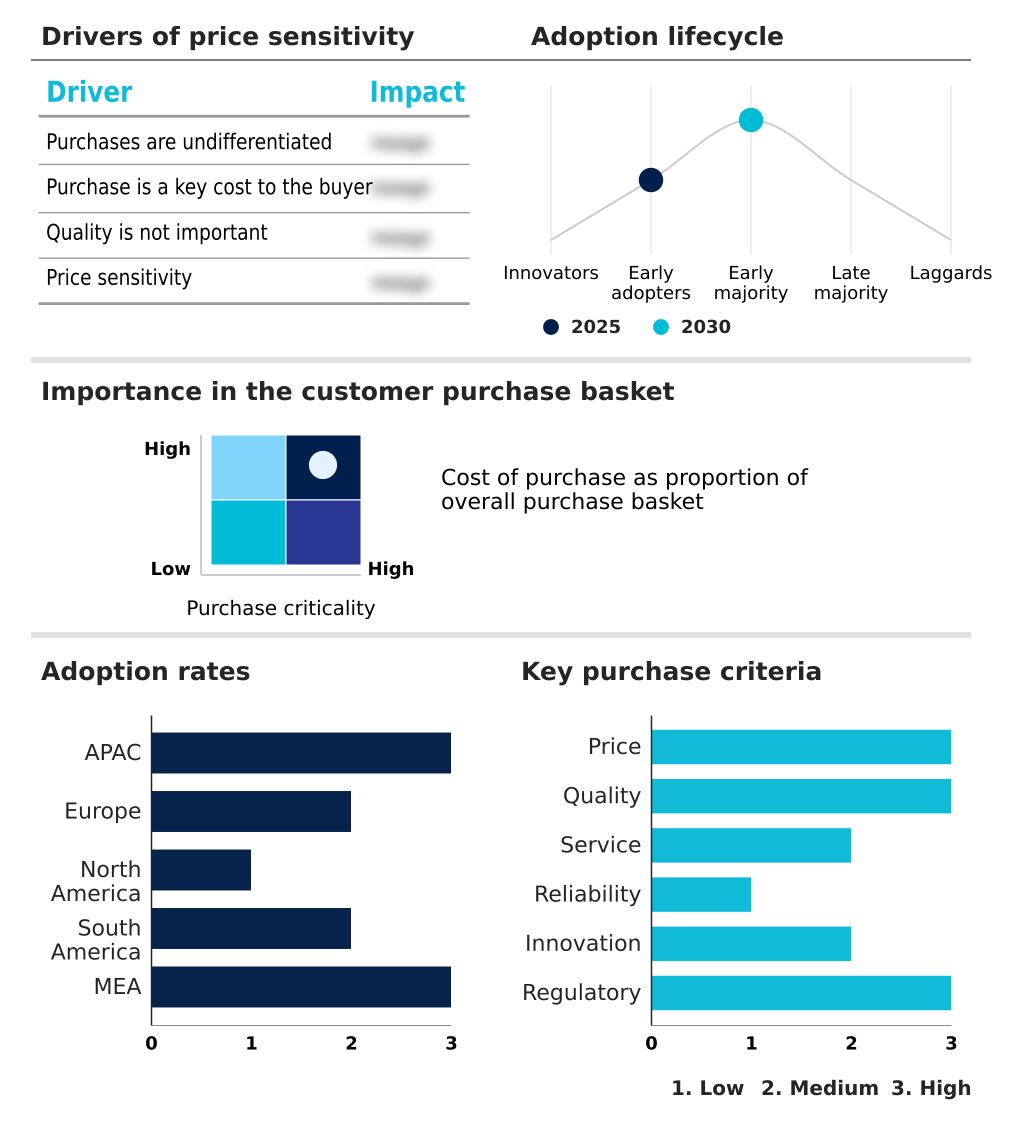
Exclusive Technavio Analysis on Customer Landscape

The sulfur dioxide market forecasting report includes the adoption lifecycle of the market, covering from the innovator’s stage to the laggard’s stage. It focuses on adoption rates in different regions based on penetration. Furthermore, the sulfur dioxide market report also includes key purchase criteria and drivers of price sensitivity to help companies evaluate and develop their market growth analysis strategies.

Customer Landscape of Sulfur Dioxide Industry

Competitive Landscape

Companies are implementing various strategies, such as strategic alliances, sulfur dioxide market forecast, partnerships, mergers and acquisitions, geographical expansion, and product/service launches, to enhance their presence in the industry.

Aarti Industries Ltd. - Delivering high-purity sulfur dioxide and chemical intermediates for critical applications in pharmaceuticals, pigments, and advanced material synthesis.

The industry research and growth report includes detailed analyses of the competitive landscape of the market and information about key companies, including:

  • Aarti Industries Ltd.
  • Air Liquide SA
  • Axcel Gases
  • Boliden Group
  • EGas Depot
  • ESSECO Srl
  • Grillo Werke AG
  • INEOS Group Holdings S.A.
  • Jaysons Chemical Industries
  • Kemira Oyj
  • Linde Plc
  • Manufacturas Quimicas Juan
  • PVS Chemicals Inc.
  • Sarex Chemicals Ltd.
  • Sigma Aldrich Chemicals Ltd.
  • Sumitomo Seika Chemicals Co
  • Tokyo Chemical Industry
  • WeylChem International GmbH

Qualitative and quantitative analysis of companies has been conducted to help clients understand the wider business environment as well as the strengths and weaknesses of key industry players. Data is qualitatively analyzed to categorize companies as pure play, category-focused, industry-focused, and diversified; it is quantitatively analyzed to categorize companies as dominant, leading, strong, tentative, and weak.

Recent Development and News in Sulfur dioxide market

  • In September 2024, Kemira Oyj announced investments to increase its production capacity for water treatment chemicals in Norway and China, reinforcing its commitment to the segment.
  • In October 2024, reports confirmed that Eldorado Brasil was advancing its significant investment in a new pulp mill in Tres Lagoas, Brazil, signaling increased future demand for sulfur chemical inputs.
  • In early 2025, PVS Chemicals Inc. announced that its subsidiary, PVS-Nolwood, acquired SAL Chemical Co., a move designed to broaden its chemical distribution reach across North America.
  • In April 2025, BASF announced plans to construct a semiconductor-grade sulfuric acid plant at its Ludwigshafen site in Germany to meet specialized, high-purity demand from the electronics sector.

Dive into Technavio’s robust research methodology, blending expert interviews, extensive data synthesis, and validated models for unparalleled Sulfur Dioxide Market insights. See full methodology.

Market Scope
Page number 299
Base year 2025
Historic period 2020-2024
Forecast period 2026-2030
Growth momentum & CAGR Accelerate at a CAGR of 6.7%
Market growth 2026-2030 USD 212.7 million
Market structure Fragmented
YoY growth 2025-2026(%) 6.4%
Key countries China, India, Japan, South Korea, Indonesia, Australia, Germany, Russia, France, Italy, Spain, The Netherlands, US, Canada, Mexico, Brazil, Chile, Argentina, Saudi Arabia, South Africa, Iran, UAE and Morocco
Competitive landscape Leading Companies, Market Positioning of Companies, Competitive Strategies, and Industry Risks

Request Free Sample

Research Analyst Overview

  • The sulfur dioxide market operates as a complex ecosystem, driven by its essential function as a chemical intermediate and reducing agent across numerous industries. Its primary role as a sulfuric acid precursor underpins demand in large-scale sectors, while its application as a dechlorination agent and in the sulfite pulping process serves critical niche functions.
  • The market is increasingly influenced by stringent desulfurization mandates, creating a pivotal boardroom-level decision point: invest heavily in emission control technology and sulfur recovery units or risk regulatory penalties. This strategic choice is reshaping the industry, pushing firms toward byproduct valorization. Companies that successfully upgrade to the double contact double absorption process are achieving conversion efficiencies greater than 99.7%.
  • This not only minimizes waste but also enables the production of high-value products like ultrapure sulfuric acid and semiconductor-grade sulfuric acid from what was once an emission liability.
  • This transition from managing a metal smelting byproduct to marketing a high-purity merchant chemical is defining the future competitive landscape, where proficiency in handling sulfurous acid and mastering the INCO process becomes a key advantage.

What are the Key Data Covered in this Sulfur Dioxide Market Research and Growth Report?

  • What is the expected growth of the Sulfur Dioxide Market between 2026 and 2030?

    • USD 212.7 million, at a CAGR of 6.7%

  • What segmentation does the market report cover?

    • The report is segmented by Type (Gas, and Liquid), End-user (Chemicals, Food and beverage, Pulp and paper, Pharmaceuticals, and Others), Application (Preservatives, Bleaching agent, Winemaking, and Others) and Geography (APAC, Europe, North America, South America, Middle East and Africa)

  • Which regions are analyzed in the report?

    • APAC, Europe, North America, South America and Middle East and Africa

  • What are the key growth drivers and market challenges?

    • Increasing use in chemical manufacturing processes, Availability of alternatives for sulfur dioxide

  • Who are the major players in the Sulfur Dioxide Market?

    • Aarti Industries Ltd., Air Liquide SA, Axcel Gases, Boliden Group, EGas Depot, ESSECO Srl, Grillo Werke AG, INEOS Group Holdings S.A., Jaysons Chemical Industries, Kemira Oyj, Linde Plc, Manufacturas Quimicas Juan, PVS Chemicals Inc., Sarex Chemicals Ltd., Sigma Aldrich Chemicals Ltd., Sumitomo Seika Chemicals Co, Tokyo Chemical Industry and WeylChem International GmbH

Market Research Insights

  • The sulfur dioxide market is characterized by dynamic shifts driven by regulatory pressures and evolving industrial demands. The emphasis on supply chain resilience is prompting producers to secure feedstock sulfur availability and explore downstream derivative markets more effectively. Strategic adoption of a circular economy model for industrial byproducts has enabled leading firms to improve raw material security by over 20%.
  • Concurrently, investments in advanced hazardous material logistics and sustainable water management solutions are becoming critical differentiators. For instance, facilities implementing modern water treatment chemicals and processes have achieved a 30% reduction in non-compliant discharge events. These operational enhancements, coupled with a focus on byproduct valorization, are reshaping the competitive landscape and creating new avenues for growth in specialized, high-margin applications.

We can help! Our analysts can customize this sulfur dioxide market research report to meet your requirements.

Get in touch

1. Executive Summary

1.1 Market overview

Executive Summary - Chart on Market Overview
Executive Summary - Data Table on Market Overview
Executive Summary - Chart on Global Market Characteristics
Executive Summary - Chart on Market by Geography
Executive Summary - Chart on Market Segmentation by Type
Executive Summary - Chart on Market Segmentation by End-user
Executive Summary - Chart on Market Segmentation by Application
Executive Summary - Chart on Incremental Growth
Executive Summary - Data Table on Incremental Growth
Executive Summary - Chart on Company Market Positioning

2. Technavio Analysis

2.1 Analysis of price sensitivity, lifecycle, customer purchase basket, adoption rates, and purchase criteria

2.2 Criticality of inputs and Factors of differentiation

Chart on Overview on criticality of inputs and factors of differentiation

2.3 Factors of disruption

Chart on Overview on factors of disruption

2.4 Impact of drivers and challenges

Chart on Impact of drivers and challenges in 2025 and 2030

3. Market Landscape

3.1 Market ecosystem

Chart on Parent Market
Data Table on - Parent Market

3.2 Market characteristics

Chart on Market characteristics analysis

3.3 Value chain analysis

Chart on Value chain analysis

4. Market Sizing

4.1 Market definition

Data Table on Offerings of companies included in the market definition

4.2 Market segment analysis

Market segments

4.3 Market size 2025

4.4 Market outlook: Forecast for 2025-2030

Chart on Global - Market size and forecast 2025-2030 ($ million)
Data Table on Global - Market size and forecast 2025-2030 ($ million)
Chart on Global Market: Year-over-year growth 2025-2030 (%)
Data Table on Global Market: Year-over-year growth 2025-2030 (%)

5. Historic Market Size

5.1 Global Sulfur Dioxide Market 2020 - 2024

Historic Market Size - Data Table on Global Sulfur Dioxide Market 2020 - 2024 ($ million)

5.2 Type segment analysis 2020 - 2024

Historic Market Size - Type Segment 2020 - 2024 ($ million)

5.3 End-user segment analysis 2020 - 2024

Historic Market Size - End-user Segment 2020 - 2024 ($ million)

5.4 Application segment analysis 2020 - 2024

Historic Market Size - Application Segment 2020 - 2024 ($ million)

5.5 Geography segment analysis 2020 - 2024

Historic Market Size - Geography Segment 2020 - 2024 ($ million)

5.6 Country segment analysis 2020 - 2024

Historic Market Size - Country Segment 2020 - 2024 ($ million)

6. Qualitative Analysis

6.1 Impact of AI on Global Sulfur Dioxide Market

7. Five Forces Analysis

7.1 Five forces summary

Five forces analysis - Comparison between 2025 and 2030

7.2 Bargaining power of buyers

Bargaining power of buyers - Impact of key factors 2025 and 2030

7.3 Bargaining power of suppliers

Bargaining power of suppliers - Impact of key factors in 2025 and 2030

7.4 Threat of new entrants

Threat of new entrants - Impact of key factors in 2025 and 2030

7.5 Threat of substitutes

Threat of substitutes - Impact of key factors in 2025 and 2030

7.6 Threat of rivalry

Threat of rivalry - Impact of key factors in 2025 and 2030

7.7 Market condition

Chart on Market condition - Five forces 2025 and 2030

8. Market Segmentation by Type

8.1 Market segments

Chart on Type - Market share 2025-2030 (%)
Data Table on Type - Market share 2025-2030 (%)

8.2 Comparison by Type

Chart on Comparison by Type
Data Table on Comparison by Type

8.3 Gas - Market size and forecast 2025-2030

Chart on Gas - Market size and forecast 2025-2030 ($ million)
Data Table on Gas - Market size and forecast 2025-2030 ($ million)
Chart on Gas - Year-over-year growth 2025-2030 (%)
Data Table on Gas - Year-over-year growth 2025-2030 (%)

8.4 Liquid - Market size and forecast 2025-2030

Chart on Liquid - Market size and forecast 2025-2030 ($ million)
Data Table on Liquid - Market size and forecast 2025-2030 ($ million)
Chart on Liquid - Year-over-year growth 2025-2030 (%)
Data Table on Liquid - Year-over-year growth 2025-2030 (%)

8.5 Market opportunity by Type

Market opportunity by Type ($ million)
Data Table on Market opportunity by Type ($ million)

9. Market Segmentation by End-user

9.1 Market segments

Chart on End-user - Market share 2025-2030 (%)
Data Table on End-user - Market share 2025-2030 (%)

9.2 Comparison by End-user

Chart on Comparison by End-user
Data Table on Comparison by End-user

9.3 Chemicals - Market size and forecast 2025-2030

Chart on Chemicals - Market size and forecast 2025-2030 ($ million)
Data Table on Chemicals - Market size and forecast 2025-2030 ($ million)
Chart on Chemicals - Year-over-year growth 2025-2030 (%)
Data Table on Chemicals - Year-over-year growth 2025-2030 (%)

9.4 Food and beverage - Market size and forecast 2025-2030

Chart on Food and beverage - Market size and forecast 2025-2030 ($ million)
Data Table on Food and beverage - Market size and forecast 2025-2030 ($ million)
Chart on Food and beverage - Year-over-year growth 2025-2030 (%)
Data Table on Food and beverage - Year-over-year growth 2025-2030 (%)

9.5 Pulp and paper - Market size and forecast 2025-2030

Chart on Pulp and paper - Market size and forecast 2025-2030 ($ million)
Data Table on Pulp and paper - Market size and forecast 2025-2030 ($ million)
Chart on Pulp and paper - Year-over-year growth 2025-2030 (%)
Data Table on Pulp and paper - Year-over-year growth 2025-2030 (%)

9.6 Pharmaceuticals - Market size and forecast 2025-2030

Chart on Pharmaceuticals - Market size and forecast 2025-2030 ($ million)
Data Table on Pharmaceuticals - Market size and forecast 2025-2030 ($ million)
Chart on Pharmaceuticals - Year-over-year growth 2025-2030 (%)
Data Table on Pharmaceuticals - Year-over-year growth 2025-2030 (%)

9.7 Others - Market size and forecast 2025-2030

Chart on Others - Market size and forecast 2025-2030 ($ million)
Data Table on Others - Market size and forecast 2025-2030 ($ million)
Chart on Others - Year-over-year growth 2025-2030 (%)
Data Table on Others - Year-over-year growth 2025-2030 (%)

9.8 Market opportunity by End-user

Market opportunity by End-user ($ million)
Data Table on Market opportunity by End-user ($ million)

10. Market Segmentation by Application

10.1 Market segments

Chart on Application - Market share 2025-2030 (%)
Data Table on Application - Market share 2025-2030 (%)

10.2 Comparison by Application

Chart on Comparison by Application
Data Table on Comparison by Application

10.3 Preservatives - Market size and forecast 2025-2030

Chart on Preservatives - Market size and forecast 2025-2030 ($ million)
Data Table on Preservatives - Market size and forecast 2025-2030 ($ million)
Chart on Preservatives - Year-over-year growth 2025-2030 (%)
Data Table on Preservatives - Year-over-year growth 2025-2030 (%)

10.4 Bleaching agent - Market size and forecast 2025-2030

Chart on Bleaching agent - Market size and forecast 2025-2030 ($ million)
Data Table on Bleaching agent - Market size and forecast 2025-2030 ($ million)
Chart on Bleaching agent - Year-over-year growth 2025-2030 (%)
Data Table on Bleaching agent - Year-over-year growth 2025-2030 (%)

10.5 Winemaking - Market size and forecast 2025-2030

Chart on Winemaking - Market size and forecast 2025-2030 ($ million)
Data Table on Winemaking - Market size and forecast 2025-2030 ($ million)
Chart on Winemaking - Year-over-year growth 2025-2030 (%)
Data Table on Winemaking - Year-over-year growth 2025-2030 (%)

10.6 Others - Market size and forecast 2025-2030

Chart on Others - Market size and forecast 2025-2030 ($ million)
Data Table on Others - Market size and forecast 2025-2030 ($ million)
Chart on Others - Year-over-year growth 2025-2030 (%)
Data Table on Others - Year-over-year growth 2025-2030 (%)

10.7 Market opportunity by Application

Market opportunity by Application ($ million)
Data Table on Market opportunity by Application ($ million)

11. Customer Landscape

11.1 Customer landscape overview

Analysis of price sensitivity, lifecycle, customer purchase basket, adoption rates, and purchase criteria

12. Geographic Landscape

12.1 Geographic segmentation

Chart on Market share by geography 2025-2030 (%)
Data Table on Market share by geography 2025-2030 (%)

12.2 Geographic comparison

Chart on Geographic comparison
Data Table on Geographic comparison

12.3 APAC - Market size and forecast 2025-2030

Chart on APAC - Market size and forecast 2025-2030 ($ million)
Data Table on APAC - Market size and forecast 2025-2030 ($ million)
Chart on APAC - Year-over-year growth 2025-2030 (%)
Data Table on APAC - Year-over-year growth 2025-2030 (%)
Chart on Regional Comparison - APAC
Data Table on Regional Comparison - APAC

12.3.1 China - Market size and forecast 2025-2030

Chart on China - Market size and forecast 2025-2030 ($ million)
Data Table on China - Market size and forecast 2025-2030 ($ million)
Chart on China - Year-over-year growth 2025-2030 (%)
Data Table on China - Year-over-year growth 2025-2030 (%)

12.3.2 India - Market size and forecast 2025-2030

Chart on India - Market size and forecast 2025-2030 ($ million)
Data Table on India - Market size and forecast 2025-2030 ($ million)
Chart on India - Year-over-year growth 2025-2030 (%)
Data Table on India - Year-over-year growth 2025-2030 (%)

12.3.3 Japan - Market size and forecast 2025-2030

Chart on Japan - Market size and forecast 2025-2030 ($ million)
Data Table on Japan - Market size and forecast 2025-2030 ($ million)
Chart on Japan - Year-over-year growth 2025-2030 (%)
Data Table on Japan - Year-over-year growth 2025-2030 (%)

12.3.4 South Korea - Market size and forecast 2025-2030

Chart on South Korea - Market size and forecast 2025-2030 ($ million)
Data Table on South Korea - Market size and forecast 2025-2030 ($ million)
Chart on South Korea - Year-over-year growth 2025-2030 (%)
Data Table on South Korea - Year-over-year growth 2025-2030 (%)

12.3.5 Indonesia - Market size and forecast 2025-2030

Chart on Indonesia - Market size and forecast 2025-2030 ($ million)
Data Table on Indonesia - Market size and forecast 2025-2030 ($ million)
Chart on Indonesia - Year-over-year growth 2025-2030 (%)
Data Table on Indonesia - Year-over-year growth 2025-2030 (%)

12.3.6 Australia - Market size and forecast 2025-2030

Chart on Australia - Market size and forecast 2025-2030 ($ million)
Data Table on Australia - Market size and forecast 2025-2030 ($ million)
Chart on Australia - Year-over-year growth 2025-2030 (%)
Data Table on Australia - Year-over-year growth 2025-2030 (%)

12.4 Europe - Market size and forecast 2025-2030

Chart on Europe - Market size and forecast 2025-2030 ($ million)
Data Table on Europe - Market size and forecast 2025-2030 ($ million)
Chart on Europe - Year-over-year growth 2025-2030 (%)
Data Table on Europe - Year-over-year growth 2025-2030 (%)
Chart on Regional Comparison - Europe
Data Table on Regional Comparison - Europe

12.4.1 Germany - Market size and forecast 2025-2030

Chart on Germany - Market size and forecast 2025-2030 ($ million)
Data Table on Germany - Market size and forecast 2025-2030 ($ million)
Chart on Germany - Year-over-year growth 2025-2030 (%)
Data Table on Germany - Year-over-year growth 2025-2030 (%)

12.4.2 Russia - Market size and forecast 2025-2030

Chart on Russia - Market size and forecast 2025-2030 ($ million)
Data Table on Russia - Market size and forecast 2025-2030 ($ million)
Chart on Russia - Year-over-year growth 2025-2030 (%)
Data Table on Russia - Year-over-year growth 2025-2030 (%)

12.4.3 France - Market size and forecast 2025-2030

Chart on France - Market size and forecast 2025-2030 ($ million)
Data Table on France - Market size and forecast 2025-2030 ($ million)
Chart on France - Year-over-year growth 2025-2030 (%)
Data Table on France - Year-over-year growth 2025-2030 (%)

12.4.4 Italy - Market size and forecast 2025-2030

Chart on Italy - Market size and forecast 2025-2030 ($ million)
Data Table on Italy - Market size and forecast 2025-2030 ($ million)
Chart on Italy - Year-over-year growth 2025-2030 (%)
Data Table on Italy - Year-over-year growth 2025-2030 (%)

12.4.5 Spain - Market size and forecast 2025-2030

Chart on Spain - Market size and forecast 2025-2030 ($ million)
Data Table on Spain - Market size and forecast 2025-2030 ($ million)
Chart on Spain - Year-over-year growth 2025-2030 (%)
Data Table on Spain - Year-over-year growth 2025-2030 (%)

12.4.6 The Netherlands - Market size and forecast 2025-2030

Chart on The Netherlands - Market size and forecast 2025-2030 ($ million)
Data Table on The Netherlands - Market size and forecast 2025-2030 ($ million)
Chart on The Netherlands - Year-over-year growth 2025-2030 (%)
Data Table on The Netherlands - Year-over-year growth 2025-2030 (%)

12.5 North America - Market size and forecast 2025-2030

Chart on North America - Market size and forecast 2025-2030 ($ million)
Data Table on North America - Market size and forecast 2025-2030 ($ million)
Chart on North America - Year-over-year growth 2025-2030 (%)
Data Table on North America - Year-over-year growth 2025-2030 (%)
Chart on Regional Comparison - North America
Data Table on Regional Comparison - North America

12.5.1 US - Market size and forecast 2025-2030

Chart on US - Market size and forecast 2025-2030 ($ million)
Data Table on US - Market size and forecast 2025-2030 ($ million)
Chart on US - Year-over-year growth 2025-2030 (%)
Data Table on US - Year-over-year growth 2025-2030 (%)

12.5.2 Canada - Market size and forecast 2025-2030

Chart on Canada - Market size and forecast 2025-2030 ($ million)
Data Table on Canada - Market size and forecast 2025-2030 ($ million)
Chart on Canada - Year-over-year growth 2025-2030 (%)
Data Table on Canada - Year-over-year growth 2025-2030 (%)

12.5.3 Mexico - Market size and forecast 2025-2030

Chart on Mexico - Market size and forecast 2025-2030 ($ million)
Data Table on Mexico - Market size and forecast 2025-2030 ($ million)
Chart on Mexico - Year-over-year growth 2025-2030 (%)
Data Table on Mexico - Year-over-year growth 2025-2030 (%)

12.6 South America - Market size and forecast 2025-2030

Chart on South America - Market size and forecast 2025-2030 ($ million)
Data Table on South America - Market size and forecast 2025-2030 ($ million)
Chart on South America - Year-over-year growth 2025-2030 (%)
Data Table on South America - Year-over-year growth 2025-2030 (%)
Chart on Regional Comparison - South America
Data Table on Regional Comparison - South America

12.6.1 Brazil - Market size and forecast 2025-2030

Chart on Brazil - Market size and forecast 2025-2030 ($ million)
Data Table on Brazil - Market size and forecast 2025-2030 ($ million)
Chart on Brazil - Year-over-year growth 2025-2030 (%)
Data Table on Brazil - Year-over-year growth 2025-2030 (%)

12.6.2 Chile - Market size and forecast 2025-2030

Chart on Chile - Market size and forecast 2025-2030 ($ million)
Data Table on Chile - Market size and forecast 2025-2030 ($ million)
Chart on Chile - Year-over-year growth 2025-2030 (%)
Data Table on Chile - Year-over-year growth 2025-2030 (%)

12.6.3 Argentina - Market size and forecast 2025-2030

Chart on Argentina - Market size and forecast 2025-2030 ($ million)
Data Table on Argentina - Market size and forecast 2025-2030 ($ million)
Chart on Argentina - Year-over-year growth 2025-2030 (%)
Data Table on Argentina - Year-over-year growth 2025-2030 (%)

12.7 Middle East and Africa - Market size and forecast 2025-2030

Chart on Middle East and Africa - Market size and forecast 2025-2030 ($ million)
Data Table on Middle East and Africa - Market size and forecast 2025-2030 ($ million)
Chart on Middle East and Africa - Year-over-year growth 2025-2030 (%)
Data Table on Middle East and Africa - Year-over-year growth 2025-2030 (%)
Chart on Regional Comparison - Middle East and Africa
Data Table on Regional Comparison - Middle East and Africa

12.7.1 Saudi Arabia - Market size and forecast 2025-2030

Chart on Saudi Arabia - Market size and forecast 2025-2030 ($ million)
Data Table on Saudi Arabia - Market size and forecast 2025-2030 ($ million)
Chart on Saudi Arabia - Year-over-year growth 2025-2030 (%)
Data Table on Saudi Arabia - Year-over-year growth 2025-2030 (%)

12.7.2 South Africa - Market size and forecast 2025-2030

Chart on South Africa - Market size and forecast 2025-2030 ($ million)
Data Table on South Africa - Market size and forecast 2025-2030 ($ million)
Chart on South Africa - Year-over-year growth 2025-2030 (%)
Data Table on South Africa - Year-over-year growth 2025-2030 (%)

12.7.3 Iran - Market size and forecast 2025-2030

Chart on Iran - Market size and forecast 2025-2030 ($ million)
Data Table on Iran - Market size and forecast 2025-2030 ($ million)
Chart on Iran - Year-over-year growth 2025-2030 (%)
Data Table on Iran - Year-over-year growth 2025-2030 (%)

12.7.4 UAE - Market size and forecast 2025-2030

Chart on UAE - Market size and forecast 2025-2030 ($ million)
Data Table on UAE - Market size and forecast 2025-2030 ($ million)
Chart on UAE - Year-over-year growth 2025-2030 (%)
Data Table on UAE - Year-over-year growth 2025-2030 (%)

12.7.5 Morocco - Market size and forecast 2025-2030

Chart on Morocco - Market size and forecast 2025-2030 ($ million)
Data Table on Morocco - Market size and forecast 2025-2030 ($ million)
Chart on Morocco - Year-over-year growth 2025-2030 (%)
Data Table on Morocco - Year-over-year growth 2025-2030 (%)

12.8 Market opportunity by geography

Market opportunity by geography ($ million)
Data Tables on Market opportunity by geography ($ million)

13. Drivers, Challenges, and Opportunity

13.1 Market drivers

Increasing use in chemical manufacturing processes
Growing demand for water treatment solutions
Expansion in pharmaceutical and healthcare applications

13.2 Market challenges

Availability of alternatives for sulfur dioxide
Stringent environmental regulations associated with sulfur dioxide emissions
Health hazards pertaining to sulfur dioxide

13.3 Impact of drivers and challenges

Impact of drivers and challenges in 2025 and 2030

13.4 Market opportunities

Expansion in food preservation and processing uses
Diversification into niche industrial applications worldwide
Rising demand for eco-friendly production methods

14. Competitive Landscape

14.1 Overview

14.2

Overview on criticality of inputs and factors of differentiation

14.3 Landscape disruption

Overview on factors of disruption

14.4 Industry risks

Impact of key risks on business

15. Competitive Analysis

15.1 Companies profiled

Companies covered

15.2 Company ranking index

15.3 Market positioning of companies

Matrix on companies position and classification

15.4 Aarti Industries Ltd.

Aarti Industries Ltd. - Overview
Aarti Industries Ltd. - Business segments
Aarti Industries Ltd. - Key offerings
Aarti Industries Ltd. - Segment focus
SWOT

15.5 Air Liquide SA

Air Liquide SA - Overview
Air Liquide SA - Product / Service
Air Liquide SA - Key news
Air Liquide SA - Key offerings
SWOT

15.6 Axcel Gases

Axcel Gases - Overview
Axcel Gases - Product / Service
Axcel Gases - Key offerings
SWOT

15.7 Boliden Group

Boliden Group - Overview
Boliden Group - Product / Service
Boliden Group - Key offerings
SWOT

15.8 ESSECO Srl

ESSECO Srl - Overview
ESSECO Srl - Product / Service
ESSECO Srl - Key offerings
SWOT

15.9 Grillo Werke AG

Grillo Werke AG - Overview
Grillo Werke AG - Product / Service
Grillo Werke AG - Key offerings
SWOT

15.10 INEOS Group Holdings S.A.

INEOS Group Holdings S.A. - Overview
INEOS Group Holdings S.A. - Product / Service
INEOS Group Holdings S.A. - Key news
INEOS Group Holdings S.A. - Key offerings
SWOT

15.11 Kemira Oyj

Kemira Oyj - Overview
Kemira Oyj - Business segments
Kemira Oyj - Key offerings
Kemira Oyj - Segment focus
SWOT

15.12 Linde Plc

Linde Plc - Overview
Linde Plc - Business segments
Linde Plc - Key news
Linde Plc - Key offerings
Linde Plc - Segment focus
SWOT

15.13 PVS Chemicals Inc.

PVS Chemicals Inc. - Overview
PVS Chemicals Inc. - Product / Service
PVS Chemicals Inc. - Key offerings
SWOT

15.14 Sarex Chemicals Ltd.

Sarex Chemicals Ltd. - Overview
Sarex Chemicals Ltd. - Product / Service
Sarex Chemicals Ltd. - Key offerings
SWOT

15.15 Sigma Aldrich Chemicals Ltd.

Sigma Aldrich Chemicals Ltd. - Overview
Sigma Aldrich Chemicals Ltd. - Product / Service
Sigma Aldrich Chemicals Ltd. - Key offerings
SWOT

15.16 Sumitomo Seika Chemicals Co

Sumitomo Seika Chemicals Co - Overview
Sumitomo Seika Chemicals Co - Business segments
Sumitomo Seika Chemicals Co - Key offerings
Sumitomo Seika Chemicals Co - Segment focus
SWOT

15.17 Tokyo Chemical Industry

Tokyo Chemical Industry - Overview
Tokyo Chemical Industry - Product / Service
Tokyo Chemical Industry - Key offerings
SWOT

15.18 WeylChem International GmbH

WeylChem International GmbH - Overview
WeylChem International GmbH - Product / Service
WeylChem International GmbH - Key offerings
SWOT

16. Appendix

16.1 Scope of the report

Market definition
Objectives
Notes and caveats

16.2 Inclusions and exclusions checklist

Inclusions checklist
Exclusions checklist

16.3 Currency conversion rates for US$

16.4 Research methodology

16.5 Data procurement

Information sources

16.6 Data validation

16.7 Validation techniques employed for market sizing

16.8 Data synthesis

16.9 360 degree market analysis

16.10 List of abbreviations

Research Methodology

Technavio presents a detailed picture of the market by way of study, synthesis, and summation of data from multiple sources. The analysts have presented the various facets of the market with a particular focus on identifying the key industry influencers. The data thus presented is comprehensive, reliable, and the result of extensive research, both primary and secondary.

INFORMATION SOURCES

Primary sources

  • Manufacturers and suppliers
  • Channel partners
  • Industry experts
  • Strategic decision makers

Secondary sources

  • Industry journals and periodicals
  • Government data
  • Financial reports of key industry players
  • Historical data
  • Press releases

DATA ANALYSIS

Data Synthesis

  • Collation of data
  • Estimation of key figures
  • Analysis of derived insights

Data Validation

  • Triangulation with data models
  • Reference against proprietary databases
  • Corroboration with industry experts

REPORT WRITING

Qualitative

  • Market drivers
  • Market challenges
  • Market trends
  • Five forces analysis

Quantitative

  • Market size and forecast
  • Market segmentation
  • Geographical insights
  • Competitive landscape

Interested in this report?

Get your sample now to see our research methodology and insights!

Download Now

Frequently Asked Questions

Sulfur Dioxide market growth will increase by USD 212.7 million during 2026-2030.

The Sulfur Dioxide market is expected to grow at a CAGR of 6.7% during 2026-2030.

Sulfur Dioxide market is segmented by Type (Gas, Liquid) End-user (Chemicals, Food and beverage, Pulp and paper, Pharmaceuticals, Others) Application (Preservatives, Bleaching agent, Winemaking, Others)

Aarti Industries Ltd., Air Liquide SA, Axcel Gases, Boliden Group, EGas Depot, ESSECO Srl, Grillo Werke AG, INEOS Group Holdings S.A., Jaysons Chemical Industries, Kemira Oyj, Linde Plc, Manufacturas Quimicas Juan, PVS Chemicals Inc., Sarex Chemicals Ltd., Sigma Aldrich Chemicals Ltd., Sumitomo Seika Chemicals Co, Tokyo Chemical Industry, WeylChem International GmbH are a few of the key vendors in the Sulfur Dioxide market.

APAC will register the highest growth rate of 48% among the other regions. Therefore, the Sulfur Dioxide market in APAC is expected to garner significant business opportunities for the vendors during the forecast period.

China, India, Japan, South Korea, Indonesia, Australia, Germany, Russia, France, Italy, Spain, The Netherlands, US, Canada, Mexico, Brazil, Chile, Argentina, Saudi Arabia, South Africa, Iran, UAE, Morocco

  • Increasing use in chemical manufacturing processes is the driving factor this market.

The Sulfur Dioxide market vendors should focus on grabbing business opportunities from the Type segment as it accounted for the largest market share in the base year.