Maritime Information Market Analysis, Size, and Forecast 2026-2030: Europe (Germany, UK, and The Netherlands), North America (US, Canada, and Mexico), APAC (China, Japan, and South Korea), Middle East and Africa (UAE, Saudi Arabia, and South Africa), South America (Brazil and Argentina), and Rest of World (ROW)

Maritime Information Market Analysis, Size, and Forecast 2026-2030:
Europe (Germany, UK, and The Netherlands), North America (US, Canada, and Mexico), APAC (China, Japan, and South Korea), Middle East and Africa (UAE, Saudi Arabia, and South Africa), South America (Brazil and Argentina), and Rest of World (ROW)

Published: Mar 2026 299 Pages SKU: IRTNTR40416

Market Overview at a Glance

$1.35 B
Market Opportunity
10.3%
CAGR 2025 - 2030
41.2%
Europe Growth
$1.12 B
Commercial segment 2024

Maritime Information Market Size 2026-2030

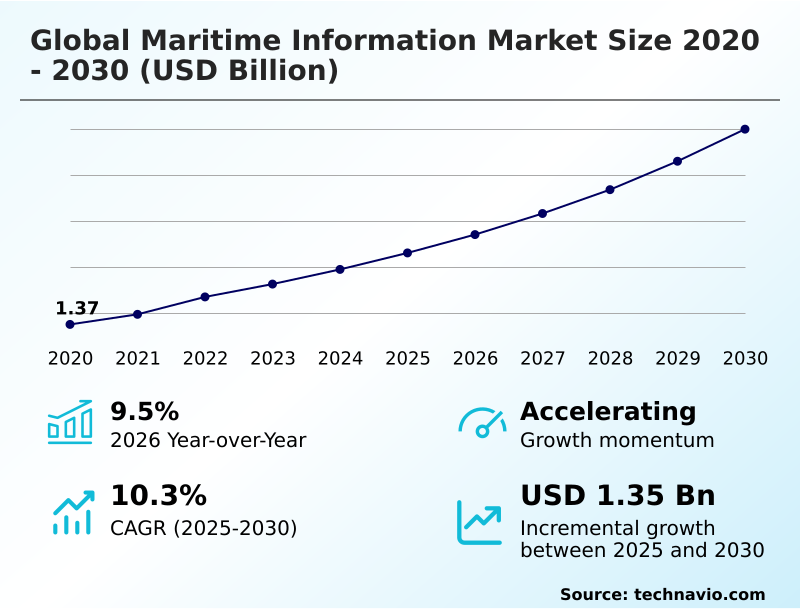
The maritime information market size is valued to increase by USD 1.35 billion, at a CAGR of 10.3% from 2025 to 2030. Accelerated digital transformation and integration of advanced technologies will drive the maritime information market.

Major Market Trends & Insights

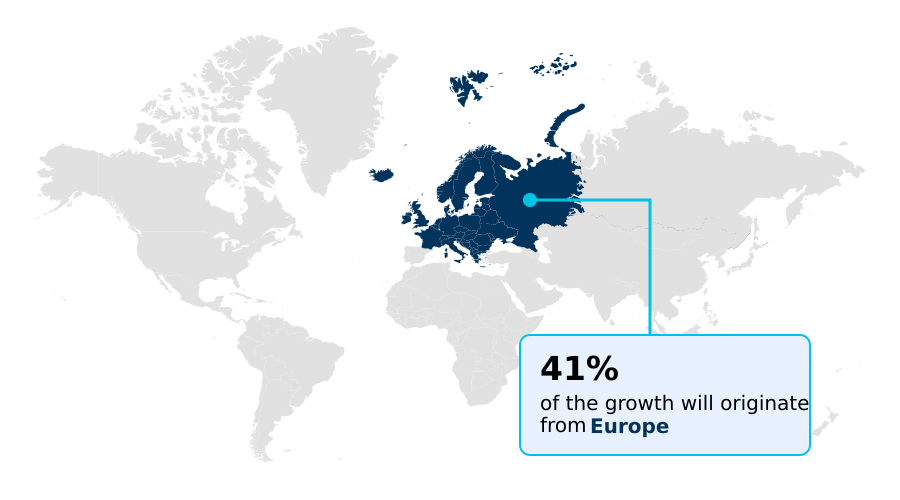
  • Europe dominated the market and accounted for a 41.2% growth during the forecast period.
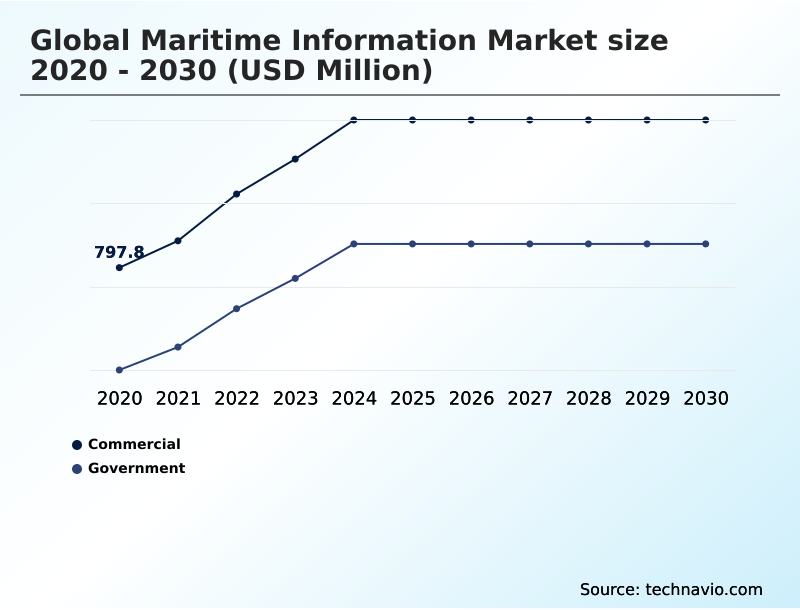
  • By End-user - Commercial segment was valued at USD 1.12 billion in 2024
  • By Application - MIA segment accounted for the largest market revenue share in 2024

Market Size & Forecast

  • Market Opportunities: USD 2.12 billion
  • Market Future Opportunities: USD 1.35 billion
  • CAGR from 2025 to 2030 : 10.3%

Market Summary

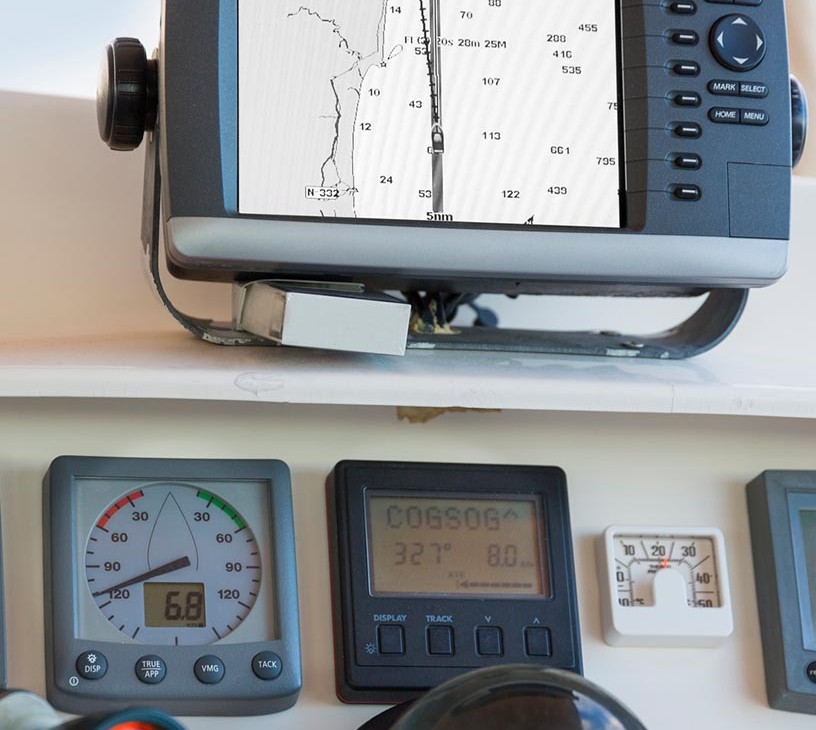
  • The maritime information market is undergoing a significant transformation, driven by the imperative for enhanced operational efficiency, safety, and regulatory compliance. The integration of technologies such as the automatic identification system, maritime iot sensors, and advanced weather analytics provides unprecedented levels of data, enabling a shift from reactive to predictive operations.
  • For instance, a global logistics operator can now use a supply chain visibility platform integrating satellite ais data and ai-powered predictive maintenance schedules to reroute vessels around developing storms while simultaneously arranging for preemptive engine servicing at the next port of call, significantly reducing unplanned downtime and ensuring cargo delivery timelines.
  • This data-driven approach, which also supports sanctions compliance screening and illegal fishing detection, is becoming essential for maintaining a competitive edge. However, the industry grapples with challenges like ensuring maritime cybersecurity for these interconnected systems and achieving port community system integration for seamless data exchange across the value chain.

What will be the Size of the Maritime Information Market during the forecast period?

Get Key Insights on Market Forecast (PDF) Request Free Sample

How is the Maritime Information Market Segmented?

The maritime information industry research report provides comprehensive data (region-wise segment analysis), with forecasts and estimates in "USD million" for the period 2026-2030, as well as historical data from 2020-2024 for the following segments.

  • End-user
    • Commercial
    • Government
  • Application
    • MIA
    • MIP
    • VT
    • AIS
  • Deployment
    • Cloud
    • On-premises
  • Geography
    • Europe
      • Germany
      • UK
      • The Netherlands
    • North America
      • US
      • Canada
      • Mexico
    • APAC
      • China
      • Japan
      • South Korea
    • Middle East and Africa
      • UAE
      • Saudi Arabia
      • South Africa
    • South America
      • Brazil
      • Argentina
    • Rest of World (ROW)

By End-user Insights

The commercial segment is estimated to witness significant growth during the forecast period.

The commercial segment is defined by a strong focus on operational efficiency. Shipping companies leverage predictive fleet analytics and voyage optimization algorithms for fleet performance optimization and advanced route planning.

Maritime IoT solutions enable real-time cargo monitoring, which, combined with real-time vessel tracking, forms the backbone of modern supply chain visibility platform architecture.

The establishment of a unified data platform and smart container network can improve schedule reliability by up to 90%.

Secure satellite communications ensure data integrity for critical systems like collision avoidance systems and platforms used for port call data analysis, driving down operational risks.

Request Free Sample

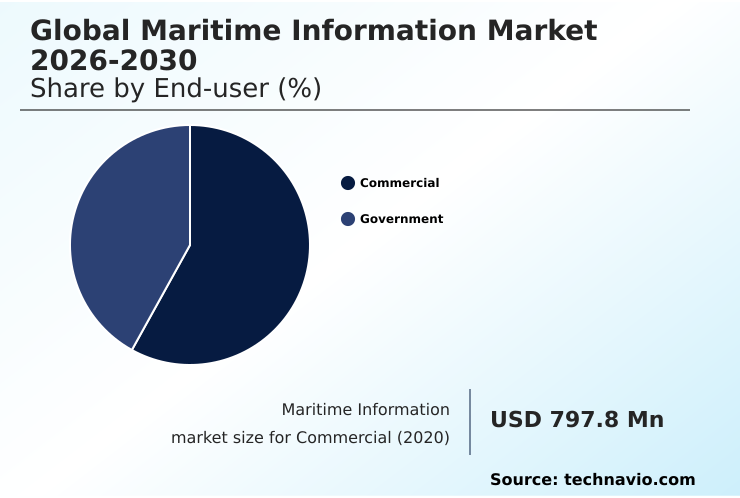
The Commercial segment was valued at USD 1.12 billion in 2024 and showed a gradual increase during the forecast period.

Request Free Sample

Regional Analysis

Europe is estimated to contribute 41.2% to the growth of the global market during the forecast period.Technavio’s analysts have elaborately explained the regional trends and drivers that shape the market during the forecast period.

See How Maritime Information Market Demand is Rising in Europe Request Free Sample

The global landscape for maritime information is led by North America and Europe, which together account for over 74% of market opportunities.

However, APAC is the fastest-growing region, with a projected CAGR of 10.8%, fueled by massive investments in smart port infrastructure. In Europe, the focus is on e-navigation systems and sustainable shipping initiatives.

North America prioritizes maritime domain awareness, leveraging drone-based surveillance and maritime data fusion from coastal surveillance systems. In APAC, the rapid adoption of port community systems is critical for managing the world's busiest shipping lanes.

Across all regions, maritime IoT sensors providing data to the automatic identification system are fundamental for everything from marine GPS navigation to climate risk scoring and dynamic routing advice.

Market Dynamics

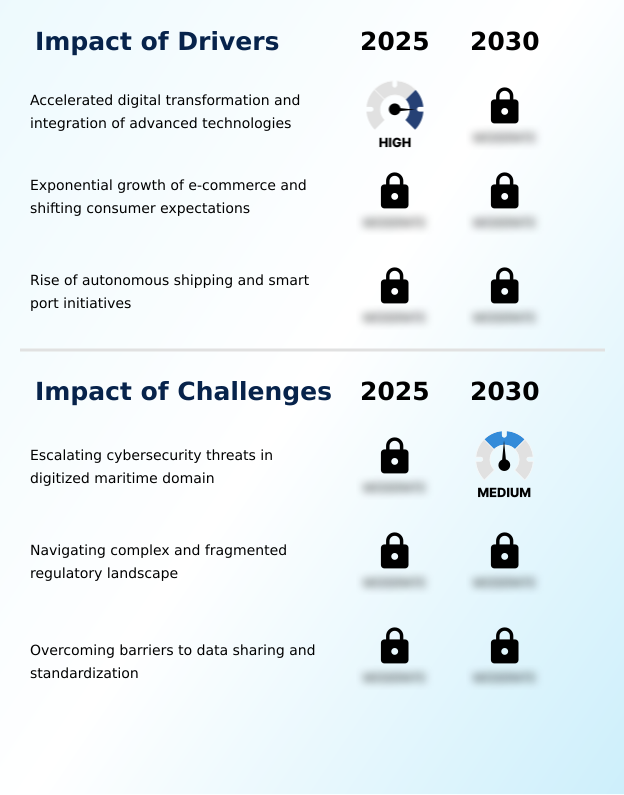
Our researchers analyzed the data with 2025 as the base year, along with the key drivers, trends, and challenges. A holistic analysis of drivers will help companies refine their marketing strategies to gain a competitive advantage.

  • The evolution of the global maritime information market 2026-2030 is increasingly shaped by specific technological applications and their strategic implications. Understanding the impact of 5G on smart port operations is crucial, as it enables the real-time data flow necessary for automated systems and role of digital twins in port optimization.
  • The cost-benefit of LEO vs GEO satellites is a central debate, with LEO constellations offering lower latency for services like integrating IoT for real-time cargo tracking, while GEO systems provide broad, stable coverage.
  • A key growth area is the global maritime information market 2026-2030 for autonomous shipping, which relies heavily on using AI for predictive vessel maintenance and advanced ais data for commodity trading insights. However, this raises significant cybersecurity risks in digitized maritime logistics. Consequently, improving GNSS resilience against spoofing and securing satellite communications for naval fleets are paramount.
  • Blockchain applications in maritime supply chain promise enhanced transparency, which complements regulatory technology for maritime compliance. The challenges of data standardization in shipping persist, hindering seamless data flow.
  • For security and environmental protection, analytics for IU-fishing pattern detection, enhancing maritime domain awareness with drones, using synthetic aperture radar for ice navigation, and systems for environmental compliance with emission tracking systems are becoming indispensable tools.
  • Predictive weather routing for fuel efficiency, the impact of AI on maritime law enforcement, and the use of maritime information portfolios for risk assessment are now core business functions, with integrated platforms demonstrating more than double the analytical capability of siloed systems.

What are the key market drivers leading to the rise in the adoption of Maritime Information Industry?

  • The industry-wide digital transformation, marked by the integration of advanced technologies like AI and IoT, is the primary driver of market growth.

  • Digitalization is a primary driver, with companies using maritime data analytics for maritime logistics optimization and improved fleet performance management.
  • The growth of e-commerce necessitates enhanced port logistics efficiency, pushing adoption of advanced onboard navigation systems that use satellite ais data. Regulatory pressures are also significant, compelling investment in real-time emissions tracking for environmental compliance monitoring.
  • The development of smart port infrastructure and autonomous shipping technology relies on a connected maritime ecosystem with robust maritime supply chain security measures, supported by satellite communication services.
  • This integration has shown to improve cargo handling speeds by up to 30% in automated terminals.

What are the market trends shaping the Maritime Information Industry?

  • The accelerated adoption of artificial intelligence and autonomous systems is a transformative trend, enhancing operational efficiency and redefining maritime logistics.

  • A key trend is the fusion of advanced weather analytics with AI in maritime operations to provide dynamic routing advice, which can reduce voyage times by up to 10%. The shift towards autonomous vessel navigation is accelerating, supported by high-frequency data services from low earth orbit satellites.
  • This enables new digital maritime services, including the creation of a digital twin for ports and enhanced port community system integration. Vessel performance characteristics are monitored in real-time for port call optimization and to enable remote diagnostics for ships, while improved crew welfare connectivity is becoming standard.
  • AI-powered predictive maintenance is also gaining traction, with some systems reducing critical equipment failures by 20%.

What challenges does the Maritime Information Industry face during its growth?

  • Escalating cybersecurity threats within the digitized maritime domain present a formidable challenge to operational integrity and security.

  • Maritime cybersecurity and cybersecurity for ot systems remain significant challenges, as platforms like vessel traffic management and remote crane operations expand the attack surface. The lack of data standardization hinders maritime big data platforms, complicating sanctions compliance screening and collaborative maritime risk management.
  • Ensuring GNSS resilience against spoofing is vital; while encrypted ais transponders help, they do not address all vulnerabilities. The industry also faces hurdles in iu-fishing prevention and illegal fishing detection, which requires sophisticated analysis of tools like maritime surveillance radar and synthetic aperture radar imagery to counter ais data manipulation detection.

Exclusive Technavio Analysis on Customer Landscape

The maritime information market forecasting report includes the adoption lifecycle of the market, covering from the innovator’s stage to the laggard’s stage. It focuses on adoption rates in different regions based on penetration. Furthermore, the maritime information market report also includes key purchase criteria and drivers of price sensitivity to help companies evaluate and develop their market growth analysis strategies.

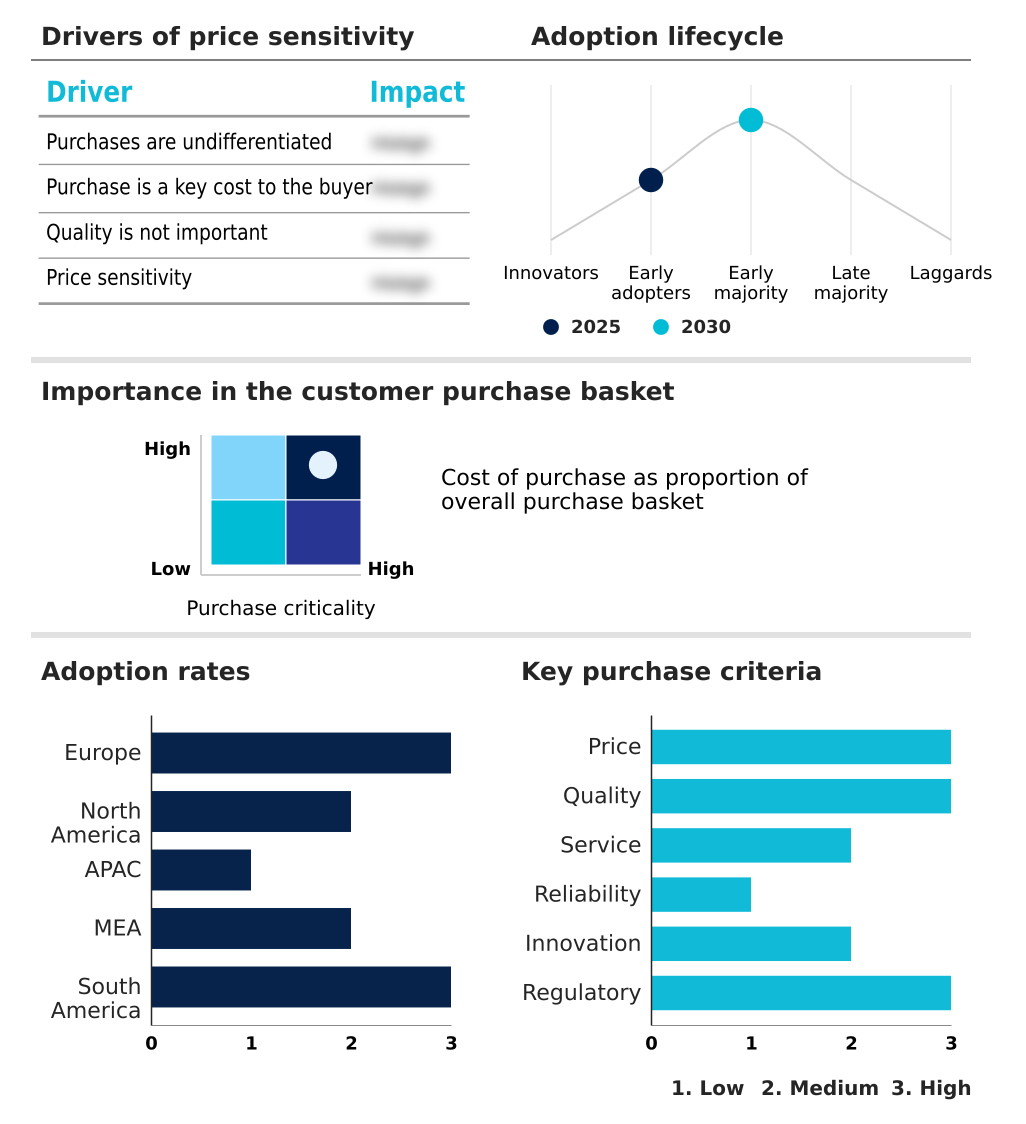
Customer Landscape of Maritime Information Industry

Competitive Landscape

Companies are implementing various strategies, such as strategic alliances, maritime information market forecast, partnerships, mergers and acquisitions, geographical expansion, and product/service launches, to enhance their presence in the industry.

BAE Systems Plc - Delivering integrated naval command, control, and surveillance systems that provide enhanced situational awareness and defense capabilities for maritime operations.

The industry research and growth report includes detailed analyses of the competitive landscape of the market and information about key companies, including:

  • BAE Systems Plc
  • Elbit Systems Ltd.
  • Garmin Ltd.
  • Inmarsat Global Ltd.
  • Intelsat US LLC
  • Kongsberg Gruppen ASA
  • L3Harris Technologies Inc.
  • Lockheed Martin Corp.
  • Northrop Grumman Corp.
  • ORBCOMM Inc.
  • RTX Corp.
  • Saab AB
  • Singapore Telecom Ltd.
  • Spire Global Inc.
  • Thales Group
  • Windward Ltd.

Qualitative and quantitative analysis of companies has been conducted to help clients understand the wider business environment as well as the strengths and weaknesses of key industry players. Data is qualitatively analyzed to categorize companies as pure play, category-focused, industry-focused, and diversified; it is quantitatively analyzed to categorize companies as dominant, leading, strong, tentative, and weak.

Recent Development and News in Maritime information market

  • In May 2025, the European Commission began enforcing new Corporate Sustainability Reporting Directive (CSRD) disclosure requirements, mandating detailed emissions tracking for maritime logistics providers in EU jurisdictions.
  • In April 2025, S&P Global finalized its acquisition of ORBCOMM's Automatic Identification System (AIS) business, integrating raw data sources with analytics platforms.
  • In March 2025, a partnership between Lloyd’s Register and Microsoft was announced to leverage generative AI for advancing the application of nuclear technology in the maritime sector.
  • In February 2025, the Gemini Cooperation, a new alliance between two major container shipping lines, officially launched its operations to enhance schedule reliability through improved data sharing.

Dive into Technavio’s robust research methodology, blending expert interviews, extensive data synthesis, and validated models for unparalleled Maritime Information Market insights. See full methodology.

Market Scope
Page number 299
Base year 2025
Historic period 2020-2024
Forecast period 2026-2030
Growth momentum & CAGR Accelerate at a CAGR of 10.3%
Market growth 2026-2030 USD 1350.5 million
Market structure Fragmented
YoY growth 2025-2026(%) 9.5%
Key countries Germany, UK, Norway, The Netherlands, France, Italy, US, Canada, Mexico, China, Japan, South Korea, Singapore, India, Australia, UAE, Saudi Arabia, South Africa, Egypt, Qatar, Brazil, Chile and Argentina
Competitive landscape Leading Companies, Market Positioning of Companies, Competitive Strategies, and Industry Risks

Request Free Sample

Research Analyst Overview

  • The maritime information market is advancing beyond simple tracking, creating a complex digital ecosystem centered on maritime data fusion. The proliferation of low earth orbit satellites is delivering high-frequency data services, enabling superior remote vessel monitoring and real-time cargo monitoring. This data feeds into port call optimization models and unified data platforms, which are crucial for efficient logistics.
  • Onboard, e-navigation systems and collision avoidance systems are standard, while AI-powered predictive maintenance is reducing vessel downtime by over 25%. The development of autonomous shipping technology, including remote crane operations, is heavily reliant on secure satellite communications and robust maritime cybersecurity.
  • For security, maritime surveillance radar, synthetic aperture radar imagery, and drone-based surveillance enhance maritime domain awareness, helping to counter threats identified through ais data manipulation detection. From a strategic perspective, boardroom decisions are now heavily influenced by the capabilities of these systems, especially in deploying digital twin for ports and smart container network infrastructure.
  • Technologies like encrypted ais transponders, onboard navigation systems, and GNSS resilience are no longer just operational tools but core components of risk management and competitive strategy, essential for maritime logistics optimization and fleet performance management.

What are the Key Data Covered in this Maritime Information Market Research and Growth Report?

  • What is the expected growth of the Maritime Information Market between 2026 and 2030?

    • USD 1.35 billion, at a CAGR of 10.3%

  • What segmentation does the market report cover?

    • The report is segmented by End-user (Commercial, and Government), Application (MIA, MIP, VT, and AIS), Deployment (Cloud, and On-premises) and Geography (Europe, North America, APAC, Middle East and Africa, South America)

  • Which regions are analyzed in the report?

    • Europe, North America, APAC, Middle East and Africa and South America

  • What are the key growth drivers and market challenges?

    • Accelerated digital transformation and integration of advanced technologies, Escalating cybersecurity threats in digitized maritime domain

  • Who are the major players in the Maritime Information Market?

    • BAE Systems Plc, Elbit Systems Ltd., Garmin Ltd., Inmarsat Global Ltd., Intelsat US LLC, Kongsberg Gruppen ASA, L3Harris Technologies Inc., Lockheed Martin Corp., Northrop Grumman Corp., ORBCOMM Inc., RTX Corp., Saab AB, Singapore Telecom Ltd., Spire Global Inc., Thales Group and Windward Ltd.

Market Research Insights

  • The adoption of maritime big data platforms is enabling significant gains, with some operators achieving a 15% reduction in fuel consumption through advanced route planning and fleet performance optimization. The use of AI in maritime operations for port call data analysis has cut vessel turnaround times by up to 20% in smart port infrastructure projects.
  • These digital maritime services are crucial for managing maritime risk management and ensuring maritime supply chain security. Enhanced crew welfare connectivity via new satellite communication services has also shown to improve crew retention rates by over 10%.
  • As the connected maritime ecosystem matures, the focus on sustainable shipping initiatives and cybersecurity for ot systems becomes paramount for long-term viability and operational resilience.

We can help! Our analysts can customize this maritime information market research report to meet your requirements.

Get in touch

1. Executive Summary

1.1 Market overview

Executive Summary - Chart on Market Overview
Executive Summary - Data Table on Market Overview
Executive Summary - Chart on Global Market Characteristics
Executive Summary - Chart on Market by Geography
Executive Summary - Chart on Market Segmentation by End-user
Executive Summary - Chart on Market Segmentation by Application
Executive Summary - Chart on Market Segmentation by Deployment
Executive Summary - Chart on Incremental Growth
Executive Summary - Data Table on Incremental Growth
Executive Summary - Chart on Company Market Positioning

2. Technavio Analysis

2.1 Analysis of price sensitivity, lifecycle, customer purchase basket, adoption rates, and purchase criteria

2.2 Criticality of inputs and Factors of differentiation

Chart on Overview on criticality of inputs and factors of differentiation

2.3 Factors of disruption

Chart on Overview on factors of disruption

2.4 Impact of drivers and challenges

Chart on Impact of drivers and challenges in 2025 and 2030

3. Market Landscape

3.1 Market ecosystem

Chart on Parent Market
Data Table on - Parent Market

3.2 Market characteristics

Chart on Market characteristics analysis

3.3 Value chain analysis

Chart on Value chain analysis

4. Market Sizing

4.1 Market definition

Data Table on Offerings of companies included in the market definition

4.2 Market segment analysis

Market segments

4.3 Market size 2025

4.4 Market outlook: Forecast for 2025-2030

Chart on Global - Market size and forecast 2025-2030 ($ million)
Data Table on Global - Market size and forecast 2025-2030 ($ million)
Chart on Global Market: Year-over-year growth 2025-2030 (%)
Data Table on Global Market: Year-over-year growth 2025-2030 (%)

5. Historic Market Size

5.1 Global Maritime Information Market 2020 - 2024

Historic Market Size - Data Table on Global Maritime Information Market 2020 - 2024 ($ million)

5.2 End-user segment analysis 2020 - 2024

Historic Market Size - End-user Segment 2020 - 2024 ($ million)

5.3 Application segment analysis 2020 - 2024

Historic Market Size - Application Segment 2020 - 2024 ($ million)

5.4 Deployment segment analysis 2020 - 2024

Historic Market Size - Deployment Segment 2020 - 2024 ($ million)

5.5 Geography segment analysis 2020 - 2024

Historic Market Size - Geography Segment 2020 - 2024 ($ million)

5.6 Country segment analysis 2020 - 2024

Historic Market Size - Country Segment 2020 - 2024 ($ million)

6. Qualitative Analysis

6.1 Impact of AI in global maritime information market

7. Five Forces Analysis

7.1 Five forces summary

Five forces analysis - Comparison between 2025 and 2030

7.2 Bargaining power of buyers

Bargaining power of buyers - Impact of key factors 2025 and 2030

7.3 Bargaining power of suppliers

Bargaining power of suppliers - Impact of key factors in 2025 and 2030

7.4 Threat of new entrants

Threat of new entrants - Impact of key factors in 2025 and 2030

7.5 Threat of substitutes

Threat of substitutes - Impact of key factors in 2025 and 2030

7.6 Threat of rivalry

Threat of rivalry - Impact of key factors in 2025 and 2030

7.7 Market condition

Chart on Market condition - Five forces 2025 and 2030

8. Market Segmentation by End-user

8.1 Market segments

Chart on End-user - Market share 2025-2030 (%)
Data Table on End-user - Market share 2025-2030 (%)

8.2 Comparison by End-user

Chart on Comparison by End-user
Data Table on Comparison by End-user

8.3 Commercial - Market size and forecast 2025-2030

Chart on Commercial - Market size and forecast 2025-2030 ($ million)
Data Table on Commercial - Market size and forecast 2025-2030 ($ million)
Chart on Commercial - Year-over-year growth 2025-2030 (%)
Data Table on Commercial - Year-over-year growth 2025-2030 (%)

8.4 Government - Market size and forecast 2025-2030

Chart on Government - Market size and forecast 2025-2030 ($ million)
Data Table on Government - Market size and forecast 2025-2030 ($ million)
Chart on Government - Year-over-year growth 2025-2030 (%)
Data Table on Government - Year-over-year growth 2025-2030 (%)

8.5 Market opportunity by End-user

Market opportunity by End-user ($ million)
Data Table on Market opportunity by End-user ($ million)

9. Market Segmentation by Application

9.1 Market segments

Chart on Application - Market share 2025-2030 (%)
Data Table on Application - Market share 2025-2030 (%)

9.2 Comparison by Application

Chart on Comparison by Application
Data Table on Comparison by Application

9.3 MIA - Market size and forecast 2025-2030

Chart on MIA - Market size and forecast 2025-2030 ($ million)
Data Table on MIA - Market size and forecast 2025-2030 ($ million)
Chart on MIA - Year-over-year growth 2025-2030 (%)
Data Table on MIA - Year-over-year growth 2025-2030 (%)

9.4 MIP - Market size and forecast 2025-2030

Chart on MIP - Market size and forecast 2025-2030 ($ million)
Data Table on MIP - Market size and forecast 2025-2030 ($ million)
Chart on MIP - Year-over-year growth 2025-2030 (%)
Data Table on MIP - Year-over-year growth 2025-2030 (%)

9.5 VT - Market size and forecast 2025-2030

Chart on VT - Market size and forecast 2025-2030 ($ million)
Data Table on VT - Market size and forecast 2025-2030 ($ million)
Chart on VT - Year-over-year growth 2025-2030 (%)
Data Table on VT - Year-over-year growth 2025-2030 (%)

9.6 AIS - Market size and forecast 2025-2030

Chart on AIS - Market size and forecast 2025-2030 ($ million)
Data Table on AIS - Market size and forecast 2025-2030 ($ million)
Chart on AIS - Year-over-year growth 2025-2030 (%)
Data Table on AIS - Year-over-year growth 2025-2030 (%)

9.7 Market opportunity by Application

Market opportunity by Application ($ million)
Data Table on Market opportunity by Application ($ million)

10. Market Segmentation by Deployment

10.1 Market segments

Chart on Deployment - Market share 2025-2030 (%)
Data Table on Deployment - Market share 2025-2030 (%)

10.2 Comparison by Deployment

Chart on Comparison by Deployment
Data Table on Comparison by Deployment

10.3 Cloud - Market size and forecast 2025-2030

Chart on Cloud - Market size and forecast 2025-2030 ($ million)
Data Table on Cloud - Market size and forecast 2025-2030 ($ million)
Chart on Cloud - Year-over-year growth 2025-2030 (%)
Data Table on Cloud - Year-over-year growth 2025-2030 (%)

10.4 On-premises - Market size and forecast 2025-2030

Chart on On-premises - Market size and forecast 2025-2030 ($ million)
Data Table on On-premises - Market size and forecast 2025-2030 ($ million)
Chart on On-premises - Year-over-year growth 2025-2030 (%)
Data Table on On-premises - Year-over-year growth 2025-2030 (%)

10.5 Market opportunity by Deployment

Market opportunity by Deployment ($ million)
Data Table on Market opportunity by Deployment ($ million)

11. Customer Landscape

11.1 Customer landscape overview

Analysis of price sensitivity, lifecycle, customer purchase basket, adoption rates, and purchase criteria

12. Geographic Landscape

12.1 Geographic segmentation

Chart on Market share by geography 2025-2030 (%)
Data Table on Market share by geography 2025-2030 (%)

12.2 Geographic comparison

Chart on Geographic comparison
Data Table on Geographic comparison

12.3 Europe - Market size and forecast 2025-2030

Chart on Europe - Market size and forecast 2025-2030 ($ million)
Data Table on Europe - Market size and forecast 2025-2030 ($ million)
Chart on Europe - Year-over-year growth 2025-2030 (%)
Data Table on Europe - Year-over-year growth 2025-2030 (%)
Chart on Regional Comparison - Europe
Data Table on Regional Comparison - Europe

12.3.1 Germany - Market size and forecast 2025-2030

Chart on Germany - Market size and forecast 2025-2030 ($ million)
Data Table on Germany - Market size and forecast 2025-2030 ($ million)
Chart on Germany - Year-over-year growth 2025-2030 (%)
Data Table on Germany - Year-over-year growth 2025-2030 (%)

12.3.2 UK - Market size and forecast 2025-2030

Chart on UK - Market size and forecast 2025-2030 ($ million)
Data Table on UK - Market size and forecast 2025-2030 ($ million)
Chart on UK - Year-over-year growth 2025-2030 (%)
Data Table on UK - Year-over-year growth 2025-2030 (%)

12.3.3 Norway - Market size and forecast 2025-2030

Chart on Norway - Market size and forecast 2025-2030 ($ million)
Data Table on Norway - Market size and forecast 2025-2030 ($ million)
Chart on Norway - Year-over-year growth 2025-2030 (%)
Data Table on Norway - Year-over-year growth 2025-2030 (%)

12.3.4 The Netherlands - Market size and forecast 2025-2030

Chart on The Netherlands - Market size and forecast 2025-2030 ($ million)
Data Table on The Netherlands - Market size and forecast 2025-2030 ($ million)
Chart on The Netherlands - Year-over-year growth 2025-2030 (%)
Data Table on The Netherlands - Year-over-year growth 2025-2030 (%)

12.3.5 France - Market size and forecast 2025-2030

Chart on France - Market size and forecast 2025-2030 ($ million)
Data Table on France - Market size and forecast 2025-2030 ($ million)
Chart on France - Year-over-year growth 2025-2030 (%)
Data Table on France - Year-over-year growth 2025-2030 (%)

12.3.6 Italy - Market size and forecast 2025-2030

Chart on Italy - Market size and forecast 2025-2030 ($ million)
Data Table on Italy - Market size and forecast 2025-2030 ($ million)
Chart on Italy - Year-over-year growth 2025-2030 (%)
Data Table on Italy - Year-over-year growth 2025-2030 (%)

12.4 North America - Market size and forecast 2025-2030

Chart on North America - Market size and forecast 2025-2030 ($ million)
Data Table on North America - Market size and forecast 2025-2030 ($ million)
Chart on North America - Year-over-year growth 2025-2030 (%)
Data Table on North America - Year-over-year growth 2025-2030 (%)
Chart on Regional Comparison - North America
Data Table on Regional Comparison - North America

12.4.1 US - Market size and forecast 2025-2030

Chart on US - Market size and forecast 2025-2030 ($ million)
Data Table on US - Market size and forecast 2025-2030 ($ million)
Chart on US - Year-over-year growth 2025-2030 (%)
Data Table on US - Year-over-year growth 2025-2030 (%)

12.4.2 Canada - Market size and forecast 2025-2030

Chart on Canada - Market size and forecast 2025-2030 ($ million)
Data Table on Canada - Market size and forecast 2025-2030 ($ million)
Chart on Canada - Year-over-year growth 2025-2030 (%)
Data Table on Canada - Year-over-year growth 2025-2030 (%)

12.4.3 Mexico - Market size and forecast 2025-2030

Chart on Mexico - Market size and forecast 2025-2030 ($ million)
Data Table on Mexico - Market size and forecast 2025-2030 ($ million)
Chart on Mexico - Year-over-year growth 2025-2030 (%)
Data Table on Mexico - Year-over-year growth 2025-2030 (%)

12.5 APAC - Market size and forecast 2025-2030

Chart on APAC - Market size and forecast 2025-2030 ($ million)
Data Table on APAC - Market size and forecast 2025-2030 ($ million)
Chart on APAC - Year-over-year growth 2025-2030 (%)
Data Table on APAC - Year-over-year growth 2025-2030 (%)
Chart on Regional Comparison - APAC
Data Table on Regional Comparison - APAC

12.5.1 China - Market size and forecast 2025-2030

Chart on China - Market size and forecast 2025-2030 ($ million)
Data Table on China - Market size and forecast 2025-2030 ($ million)
Chart on China - Year-over-year growth 2025-2030 (%)
Data Table on China - Year-over-year growth 2025-2030 (%)

12.5.2 Japan - Market size and forecast 2025-2030

Chart on Japan - Market size and forecast 2025-2030 ($ million)
Data Table on Japan - Market size and forecast 2025-2030 ($ million)
Chart on Japan - Year-over-year growth 2025-2030 (%)
Data Table on Japan - Year-over-year growth 2025-2030 (%)

12.5.3 South Korea - Market size and forecast 2025-2030

Chart on South Korea - Market size and forecast 2025-2030 ($ million)
Data Table on South Korea - Market size and forecast 2025-2030 ($ million)
Chart on South Korea - Year-over-year growth 2025-2030 (%)
Data Table on South Korea - Year-over-year growth 2025-2030 (%)

12.5.4 Singapore - Market size and forecast 2025-2030

Chart on Singapore - Market size and forecast 2025-2030 ($ million)
Data Table on Singapore - Market size and forecast 2025-2030 ($ million)
Chart on Singapore - Year-over-year growth 2025-2030 (%)
Data Table on Singapore - Year-over-year growth 2025-2030 (%)

12.5.5 India - Market size and forecast 2025-2030

Chart on India - Market size and forecast 2025-2030 ($ million)
Data Table on India - Market size and forecast 2025-2030 ($ million)
Chart on India - Year-over-year growth 2025-2030 (%)
Data Table on India - Year-over-year growth 2025-2030 (%)

12.5.6 Australia - Market size and forecast 2025-2030

Chart on Australia - Market size and forecast 2025-2030 ($ million)
Data Table on Australia - Market size and forecast 2025-2030 ($ million)
Chart on Australia - Year-over-year growth 2025-2030 (%)
Data Table on Australia - Year-over-year growth 2025-2030 (%)

12.6 Middle East and Africa - Market size and forecast 2025-2030

Chart on Middle East and Africa - Market size and forecast 2025-2030 ($ million)
Data Table on Middle East and Africa - Market size and forecast 2025-2030 ($ million)
Chart on Middle East and Africa - Year-over-year growth 2025-2030 (%)
Data Table on Middle East and Africa - Year-over-year growth 2025-2030 (%)
Chart on Regional Comparison - Middle East and Africa
Data Table on Regional Comparison - Middle East and Africa

12.6.1 UAE - Market size and forecast 2025-2030

Chart on UAE - Market size and forecast 2025-2030 ($ million)
Data Table on UAE - Market size and forecast 2025-2030 ($ million)
Chart on UAE - Year-over-year growth 2025-2030 (%)
Data Table on UAE - Year-over-year growth 2025-2030 (%)

12.6.2 Saudi Arabia - Market size and forecast 2025-2030

Chart on Saudi Arabia - Market size and forecast 2025-2030 ($ million)
Data Table on Saudi Arabia - Market size and forecast 2025-2030 ($ million)
Chart on Saudi Arabia - Year-over-year growth 2025-2030 (%)
Data Table on Saudi Arabia - Year-over-year growth 2025-2030 (%)

12.6.3 South Africa - Market size and forecast 2025-2030

Chart on South Africa - Market size and forecast 2025-2030 ($ million)
Data Table on South Africa - Market size and forecast 2025-2030 ($ million)
Chart on South Africa - Year-over-year growth 2025-2030 (%)
Data Table on South Africa - Year-over-year growth 2025-2030 (%)

12.6.4 Egypt - Market size and forecast 2025-2030

Chart on Egypt - Market size and forecast 2025-2030 ($ million)
Data Table on Egypt - Market size and forecast 2025-2030 ($ million)
Chart on Egypt - Year-over-year growth 2025-2030 (%)
Data Table on Egypt - Year-over-year growth 2025-2030 (%)

12.6.5 Qatar - Market size and forecast 2025-2030

Chart on Qatar - Market size and forecast 2025-2030 ($ million)
Data Table on Qatar - Market size and forecast 2025-2030 ($ million)
Chart on Qatar - Year-over-year growth 2025-2030 (%)
Data Table on Qatar - Year-over-year growth 2025-2030 (%)

12.7 South America - Market size and forecast 2025-2030

Chart on South America - Market size and forecast 2025-2030 ($ million)
Data Table on South America - Market size and forecast 2025-2030 ($ million)
Chart on South America - Year-over-year growth 2025-2030 (%)
Data Table on South America - Year-over-year growth 2025-2030 (%)
Chart on Regional Comparison - South America
Data Table on Regional Comparison - South America

12.7.1 Brazil - Market size and forecast 2025-2030

Chart on Brazil - Market size and forecast 2025-2030 ($ million)
Data Table on Brazil - Market size and forecast 2025-2030 ($ million)
Chart on Brazil - Year-over-year growth 2025-2030 (%)
Data Table on Brazil - Year-over-year growth 2025-2030 (%)

12.7.2 Chile - Market size and forecast 2025-2030

Chart on Chile - Market size and forecast 2025-2030 ($ million)
Data Table on Chile - Market size and forecast 2025-2030 ($ million)
Chart on Chile - Year-over-year growth 2025-2030 (%)
Data Table on Chile - Year-over-year growth 2025-2030 (%)

12.7.3 Argentina - Market size and forecast 2025-2030

Chart on Argentina - Market size and forecast 2025-2030 ($ million)
Data Table on Argentina - Market size and forecast 2025-2030 ($ million)
Chart on Argentina - Year-over-year growth 2025-2030 (%)
Data Table on Argentina - Year-over-year growth 2025-2030 (%)

12.8 Market opportunity by geography

Market opportunity by geography ($ million)
Data Tables on Market opportunity by geography ($ million)

13. Drivers, Challenges, and Opportunity

13.1 Market drivers

Accelerated digital transformation and integration of advanced technologies
Exponential growth of e-commerce and shifting consumer expectations
Rise of autonomous shipping and smart port initiatives

13.2 Market challenges

Escalating cybersecurity threats in digitized maritime domain
Navigating complex and fragmented regulatory landscape
Overcoming barriers to data sharing and standardization

13.3 Impact of drivers and challenges

Impact of drivers and challenges in 2025 and 2030

13.4 Market opportunities

Accelerated adoption of artificial intelligence and autonomous systems
Revolution in maritime connectivity in advanced satellite communications
Climate change adaptation and advanced weather analytics

14. Competitive Landscape

14.1 Overview

14.2

Overview on criticality of inputs and factors of differentiation

14.3 Landscape disruption

Overview on factors of disruption

14.4 Industry risks

Impact of key risks on business

15. Competitive Analysis

15.1 Companies profiled

Companies covered

15.2 Company ranking index

15.3 Market positioning of companies

Matrix on companies position and classification

15.4 BAE Systems Plc

BAE Systems Plc - Overview
BAE Systems Plc - Business segments
BAE Systems Plc - Key news
BAE Systems Plc - Key offerings
BAE Systems Plc - Segment focus
SWOT

15.5 Elbit Systems Ltd.

Elbit Systems Ltd. - Overview
Elbit Systems Ltd. - Product / Service
Elbit Systems Ltd. - Key news
Elbit Systems Ltd. - Key offerings
SWOT

15.6 Garmin Ltd.

Garmin Ltd. - Overview
Garmin Ltd. - Business segments
Garmin Ltd. - Key news
Garmin Ltd. - Key offerings
Garmin Ltd. - Segment focus
SWOT

15.7 Inmarsat Global Ltd.

Inmarsat Global Ltd. - Overview
Inmarsat Global Ltd. - Product / Service
Inmarsat Global Ltd. - Key news
Inmarsat Global Ltd. - Key offerings
SWOT

15.8 Intelsat US LLC

Intelsat US LLC - Overview
Intelsat US LLC - Product / Service
Intelsat US LLC - Key offerings
SWOT

15.9 Kongsberg Gruppen ASA

Kongsberg Gruppen ASA - Overview
Kongsberg Gruppen ASA - Business segments
Kongsberg Gruppen ASA - Key news
Kongsberg Gruppen ASA - Key offerings
Kongsberg Gruppen ASA - Segment focus
SWOT

15.10 L3Harris Technologies Inc.

L3Harris Technologies Inc. - Overview
L3Harris Technologies Inc. - Business segments
L3Harris Technologies Inc. - Key news
L3Harris Technologies Inc. - Key offerings
L3Harris Technologies Inc. - Segment focus
SWOT

15.11 Lockheed Martin Corp.

Lockheed Martin Corp. - Overview
Lockheed Martin Corp. - Business segments
Lockheed Martin Corp. - Key news
Lockheed Martin Corp. - Key offerings
Lockheed Martin Corp. - Segment focus
SWOT

15.12 Northrop Grumman Corp.

Northrop Grumman Corp. - Overview
Northrop Grumman Corp. - Business segments
Northrop Grumman Corp. - Key news
Northrop Grumman Corp. - Key offerings
Northrop Grumman Corp. - Segment focus
SWOT

15.13 ORBCOMM Inc.

ORBCOMM Inc. - Overview
ORBCOMM Inc. - Product / Service
ORBCOMM Inc. - Key offerings
SWOT

15.14 RTX Corp.

RTX Corp. - Overview
RTX Corp. - Business segments
RTX Corp. - Key news
RTX Corp. - Key offerings
RTX Corp. - Segment focus
SWOT

15.15 Saab AB

Saab AB - Overview
Saab AB - Business segments
Saab AB - Key news
Saab AB - Key offerings
Saab AB - Segment focus
SWOT

15.16 Singapore Telecom Ltd.

Singapore Telecom Ltd. - Overview
Singapore Telecom Ltd. - Business segments
Singapore Telecom Ltd. - Key offerings
Singapore Telecom Ltd. - Segment focus
SWOT

15.17 Spire Global Inc.

Spire Global Inc. - Overview
Spire Global Inc. - Product / Service
Spire Global Inc. - Key offerings
SWOT

15.18 Thales Group

Thales Group - Overview
Thales Group - Business segments
Thales Group - Key news
Thales Group - Key offerings
Thales Group - Segment focus
SWOT

16. Appendix

16.1 Scope of the report

Market definition
Objectives
Notes and caveats

16.2 Inclusions and exclusions checklist

Inclusions checklist
Exclusions checklist

16.3 Currency conversion rates for US$

16.4 Research methodology

16.5 Data procurement

Information sources

16.6 Data validation

16.7 Validation techniques employed for market sizing

16.8 Data synthesis

16.9 360 degree market analysis

16.10 List of abbreviations

Research Methodology

Technavio presents a detailed picture of the market by way of study, synthesis, and summation of data from multiple sources. The analysts have presented the various facets of the market with a particular focus on identifying the key industry influencers. The data thus presented is comprehensive, reliable, and the result of extensive research, both primary and secondary.

INFORMATION SOURCES

Primary sources

  • Manufacturers and suppliers
  • Channel partners
  • Industry experts
  • Strategic decision makers

Secondary sources

  • Industry journals and periodicals
  • Government data
  • Financial reports of key industry players
  • Historical data
  • Press releases

DATA ANALYSIS

Data Synthesis

  • Collation of data
  • Estimation of key figures
  • Analysis of derived insights

Data Validation

  • Triangulation with data models
  • Reference against proprietary databases
  • Corroboration with industry experts

REPORT WRITING

Qualitative

  • Market drivers
  • Market challenges
  • Market trends
  • Five forces analysis

Quantitative

  • Market size and forecast
  • Market segmentation
  • Geographical insights
  • Competitive landscape

Interested in this report?

Get your sample now to see our research methodology and insights!

Download Now

Frequently Asked Questions

Maritime Information market growth will increase by USD 1350.5 million during 2026-2030.

The Maritime Information market is expected to grow at a CAGR of 10.3% during 2026-2030.

Maritime Information market is segmented by End-user (Commercial, Government) Application (MIA, MIP, VT, AIS) Deployment (Cloud, On-premises)

BAE Systems Plc, Elbit Systems Ltd., Garmin Ltd., Inmarsat Global Ltd., Intelsat US LLC, Kongsberg Gruppen ASA, L3Harris Technologies Inc., Lockheed Martin Corp., Northrop Grumman Corp., ORBCOMM Inc., RTX Corp., Saab AB, Singapore Telecom Ltd., Spire Global Inc., Thales Group, Windward Ltd. are a few of the key vendors in the Maritime Information market.

Europe will register the highest growth rate of 41.2% among the other regions. Therefore, the Maritime Information market in Europe is expected to garner significant business opportunities for the vendors during the forecast period.

Germany, UK, Norway, The Netherlands, France, Italy, US, Canada, Mexico, China, Japan, South Korea, Singapore, India, Australia, UAE, Saudi Arabia, South Africa, Egypt, Qatar, Brazil, Chile, Argentina

  • Accelerated digital transformation and integration of advanced technologies is the driving factor this market.

The Maritime Information market vendors should focus on grabbing business opportunities from the End-user segment as it accounted for the largest market share in the base year.
RIA - Research AI Assistant
Ask RIA