
Mastopexy Market Size 2025-2029
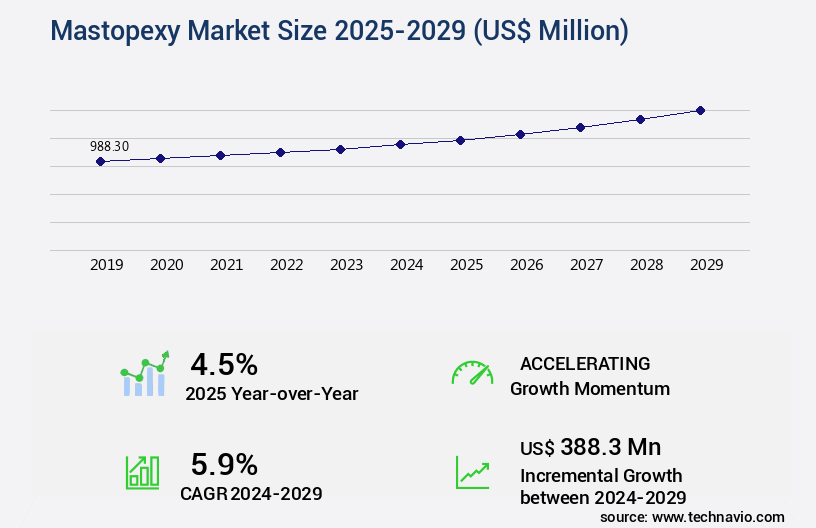
The mastopexy market size is valued to increase by USD 388.3 million, at a CAGR of 5.9% from 2024 to 2029. Growing demand for aesthetic surgery will drive the mastopexy market.
Major Market Trends & Insights
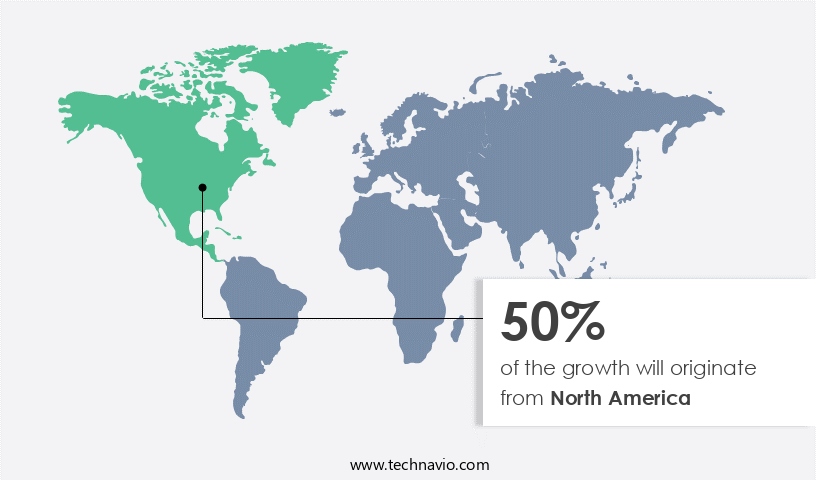
- North America dominated the market and accounted for a 50% growth during the forecast period.
- By Type - Surgical mastopexy segment was valued at USD 854.80 million in 2023
- By End-user - Aesthetic segment accounted for the largest market revenue share in 2023
Market Size & Forecast
- Market Opportunities: USD 58.09 million
- Market Future Opportunities: USD 388.30 million
- CAGR from 2024 to 2029: 5.9%
Market Summary
- The market witnesses continuous expansion, fueled by the increasing preference for physical appearance enhancement. According to the International Society of Aesthetic Plastic Surgery, over 112,000 mastopexy procedures were performed globally in 2019, underscoring the market's significant size and potential. Companies in this sector capitalize on this trend by campaigning for their advanced solutions, which address various breast concerns, including sagging, asymmetry, and size discrepancies. Despite the market's growth, stringent government regulations pose a challenge. These regulations ensure patient safety and ethical practices, but they also increase the complexity of market entry and product approval. As a result, companies must invest heavily in research and development to meet regulatory requirements and maintain a competitive edge.
- Additionally, advancements in technology, such as the use of 3D simulation software and minimally invasive techniques, contribute to the market's evolution. These innovations enhance the functionality and precision of mastopexy procedures, making them more accessible and desirable for an increasingly diverse patient population. Overall, the market's future direction lies in continuous innovation and regulatory compliance, ensuring both patient satisfaction and business growth.
What will be the Size of the Mastopexy Market during the forecast period?
Get Key Insights on Market Forecast (PDF) Request Free Sample
How is the Mastopexy Market Segmented?
The mastopexy industry research report provides comprehensive data (region-wise segment analysis), with forecasts and estimates in "USD million" for the period 2025-2029, as well as historical data from 2019-2023 for the following segments.
- Type
- Surgical mastopexy
- Non-surgical mastopexy
- End-user
- Aesthetic
- Reconstructive
- Geography
- North America
- US
- Canada
- Europe
- France
- Germany
- Italy
- Spain
- UK
- APAC
- China
- Japan
- South Korea
- Rest of World (ROW)
- North America
By Type Insights
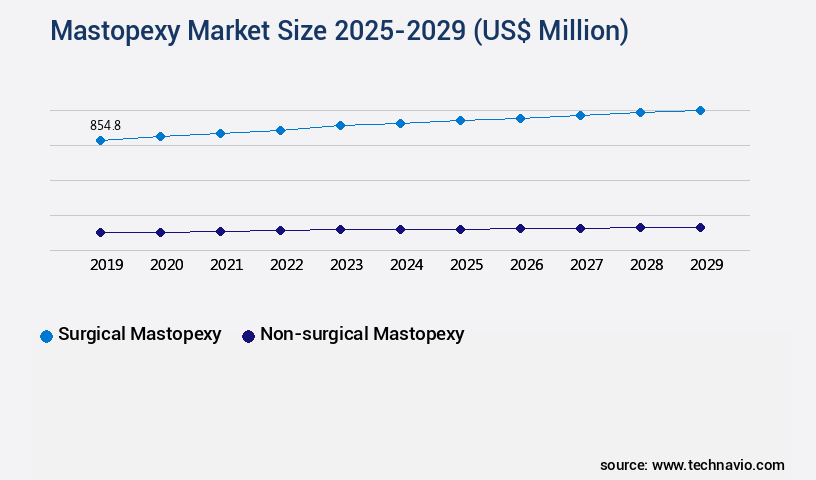
The surgical mastopexy segment is estimated to witness significant growth during the forecast period.
The market continues to evolve, with surgical mastopexy, or breast lift surgery, being a significant segment. This procedure, which addresses breast ptosis through skin excision and tissue repositioning, has seen ongoing advancements. In September 2024, Establishment Labs secured FDA approval for their Motiva breast implants, suitable for both primary and revision mastopexies. These implants offer improved options for patients undergoing the procedure. Complication rates remain a focus, with long-term results and recovery time crucial considerations. Postoperative care, including pain management and scar revision, is essential for optimal aesthetic outcome. Surgical planning involves various techniques, such as vertical mastopexy, superior and inferior pedicle, and periareolar incisions.
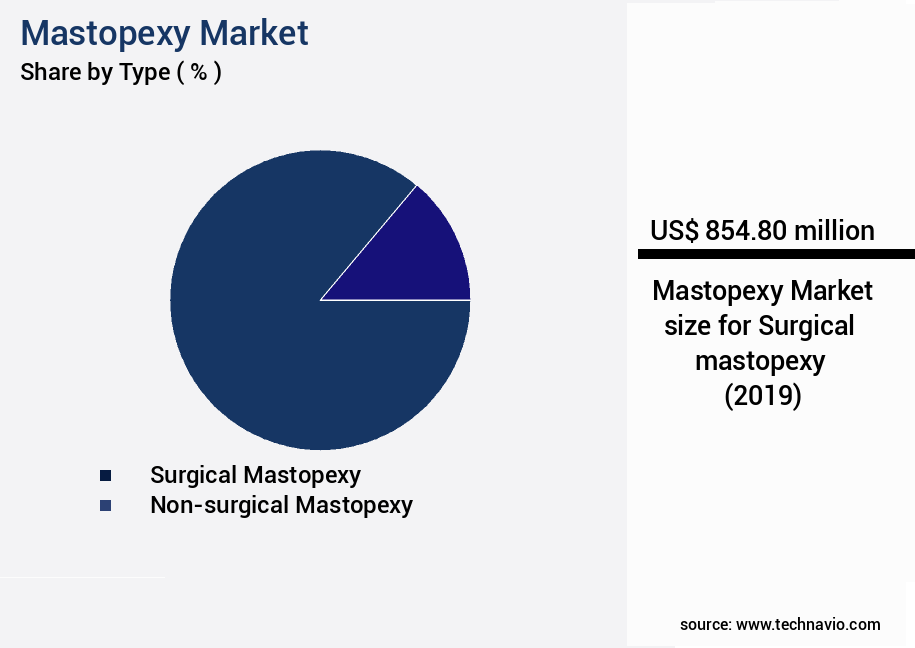
The Surgical mastopexy segment was valued at USD 854.80 million in 2019 and showed a gradual increase during the forecast period.
Anesthesia techniques, including local and general, also play a role. Key surgical planning tools include 3D imaging, computer modeling, and preoperative assessment. Patient satisfaction remains a priority, with factors like wound healing, tissue repositioning, and areolar repositioning influencing overall success. Notably, the use of suspension sutures, fat grafting, and image guidance has gained popularity in recent years. A study published in the Aesthetic Surgery Journal reported a 93% patient satisfaction rate for breast lift procedures, underscoring the procedure's effectiveness.
Regional Analysis
North America is estimated to contribute 50% to the growth of the global market during the forecast period. Technavio's analysts have elaborately explained the regional trends and drivers that shape the market during the forecast period.
See How Mastopexy Market Demand is Rising in North America Request Free Sample
The North American market has displayed impressive resilience and expansion, bucking economic headwinds such as increased interest rates and stringent budgets. In the year 2023, Americans demonstrated a strong dedication to cosmetic procedures as part of their self-care regimens, reflecting a broader cultural shift prioritizing personal appearance and well-being. According to the 2023 Procedural Statistics published by the American Society of Plastic Surgeons (ASPS), there was a noteworthy 5% surge in plastic surgeries and a 7% uptick in minimally invasive procedures compared to the preceding year.
This data underscores the burgeoning demand for aesthetic enhancements despite economic pressures. Among these procedures, breast lift treatments, a significant segment within the market, experienced considerable growth in 2023.
Market Dynamics
Our researchers analyzed the data with 2024 as the base year, along with the key drivers, trends, and challenges. A holistic analysis of drivers will help companies refine their marketing strategies to gain a competitive advantage.
The market is experiencing significant growth due to the increasing demand for breast lift procedures to address sagging and loss of volume in the breasts. Minimally invasive mastopexy techniques, such as periareolar incision mastopexy and image-guided surgical planning, have gained popularity for their reduced recovery time and scar visibility. However, each technique comes with its unique advantages and disadvantages. For instance, periareolar incision mastopexy may yield excellent outcomes in terms of scar placement, but vertical scar mastopexy, although associated with more prominent scars, offers greater versatility in reshaping the breast. Patient selection criteria for breast lift surgery are crucial in ensuring optimal results and minimizing complications. Factors affecting mastopexy longevity include aging, weight fluctuations, and pregnancy. Reducing risks of complications includes meticulous surgical planning, careful patient selection, and addressing potential complications, such as inferior pedicle mastopexy's risk of nipple necrosis and superior pedicle mastopexy's risk of implant malposition. Advanced suture techniques, fat grafting, and a combination of breast lift and augmentation procedures are increasingly used to enhance patient satisfaction and improve long-term aesthetic results. Surgical techniques for addressing breast asymmetry and managing post-operative complications are essential components of a comprehensive mastopexy approach. The choice of anesthesia type can also impact mastopexy recovery time and patient experience. In conclusion, the market is driven by the desire for improved breast aesthetics and the development of innovative techniques and technologies. Patient-specific surgical planning, careful selection, and addressing potential complications are essential in ensuring optimal outcomes and patient satisfaction. Continued research and advancements in mastopexy procedures will further expand the market's growth potential.
What are the key market drivers leading to the rise in the adoption of Mastopexy Industry?
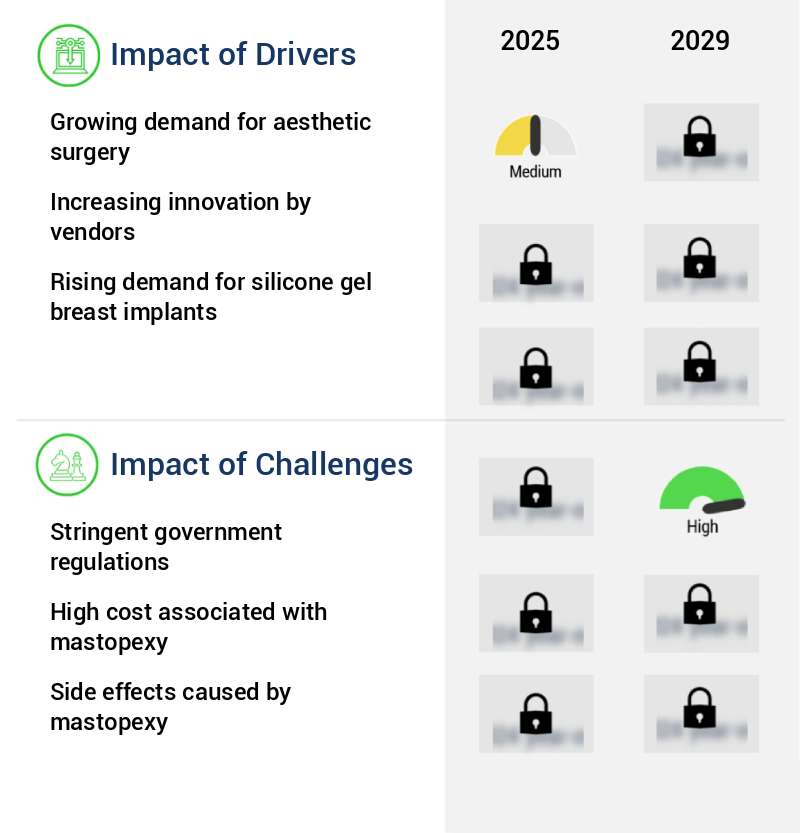
- The increasing preference for aesthetic enhancements is the primary market catalyst, driving significant growth in the aesthetic surgery industry.
- The market is experiencing robust growth, fueled by the increasing demand for aesthetic surgery. Among all aesthetic procedures, breast augmentation holds the second position as the most frequently performed worldwide. This trend is driven by women's desire to enhance their body proportions, leading to improved self-confidence and a better quality of life. As per the International Society of Aesthetic Plastic Surgery (ISAPS) data from 2023, approximately 1.9 million women underwent breast augmentation using silicone implants. This substantial number underscores the widespread acceptance and popularity of aesthetic breast surgeries.
- Factors contributing to this growing demand include the increasing acceptance of cosmetic procedures, advancements in surgical techniques, and rising disposable income.
What are the market trends shaping the Mastopexy Industry?
- Campaigning is becoming a market trend for companies. This practice is mandatory in the professional business world.
- The market is undergoing a transformation, with companies adopting personalized and inclusive marketing strategies. Allergan Aesthetics, a leading player, recently launched the For Every BODY campaign, emphasizing the individual nature of breast surgery decisions. This initiative showcases the diverse experiences of patients and highlights the customization offered by their Natrelle breast implant portfolio. This shift towards personalized marketing reflects a broader trend in the market, aiming to connect with a diverse customer base.
- The market is expected to continue evolving, with an increasing focus on individualized solutions. Companies are leveraging new visual assets and imagery to cater to a wide range of body shapes and sizes, underscoring the importance of inclusivity in marketing efforts.
What challenges does the Mastopexy Industry face during its growth?
- The strict implementation of government regulations poses a significant challenge to the expansion of the industry.
- The market continues to evolve, presenting both opportunities and challenges for manufacturers and healthcare providers. Strict regulatory oversight, as exemplified by the Food and Drug Administration's (FDA) recent warning to healthcare professionals regarding breast surgical mesh products, is a significant factor influencing market dynamics. This regulatory scrutiny can hinder the adoption and utilization of innovative surgical solutions. In 2022, the global breast implant market was valued at approximately USD 3.8 billion, while the breast lift procedure market was estimated to be around USD 1.5 billion.
- These figures underscore the market's potential, despite the regulatory hurdles. The FDA's commitment to ensuring the safety and efficacy of medical devices used in breast surgery underscores the importance of adhering to regulatory guidelines.
Exclusive Technavio Analysis on Customer Landscape
The mastopexy market forecasting report includes the adoption lifecycle of the market, covering from the innovator's stage to the laggard's stage. It focuses on adoption rates in different regions based on penetration. Furthermore, the mastopexy market report also includes key purchase criteria and drivers of price sensitivity to help companies evaluate and develop their market growth analysis strategies.

Customer Landscape of Mastopexy Industry
Competitive Landscape
Companies are implementing various strategies, such as strategic alliances, mastopexy market forecast, partnerships, mergers and acquisitions, geographical expansion, and product/service launches, to enhance their presence in the industry.
AbbVie Inc. - The company specializes in providing high-quality breast implant solutions, including the Natrelle brand.
The industry research and growth report includes detailed analyses of the competitive landscape of the market and information about key companies, including:
- AbbVie Inc.
- Bausch Health Companies Inc.
- Coppergate Clinic
- Cynosure Aesthetics Plastic Surgery Clinics
- Dr. Benjamin Sarfati
- Establishment Labs Holdings Inc.
- Global Consolidated Aesthetics Ltd.
- Gulf Coast Plastic Surgery
- Hologic Inc.
- Medicover Hospitals
- Mentor Worldwide LLC
- MOOI Clinic
- POLYTECH Health and Aesthetics GmbH
- Sientra Inc.
- Spire Healthcare Group Plc
- University of Pennsylvania Health System
- UT Health East Texas
Qualitative and quantitative analysis of companies has been conducted to help clients understand the wider business environment as well as the strengths and weaknesses of key industry players. Data is qualitatively analyzed to categorize companies as pure play, category-focused, industry-focused, and diversified; it is quantitatively analyzed to categorize companies as dominant, leading, strong, tentative, and weak.
Recent Development and News in Mastopexy Market
- In January 2024, Allergan Aesthetics, a leading player in the aesthetic market, received FDA approval for its new breast lift implant, Natrelle Inspira Mammoplasty Implants. These implants combine a breast lift with the benefits of silicone gel breast implants, addressing the dual concerns of breast sagging and volume loss (Allergan Aesthetics Press Release).
- In March 2024, Sientra, Inc., a leading medical aesthetics company, announced a strategic partnership with Macy's, allowing Sientra's breast implant products to be sold through Macy's Beauty, a division of Macy's, Inc. This collaboration expanded Sientra's reach into the retail sector, providing greater accessibility to their products (Sientra, Inc. Press Release).
- In May 2024, Mentor Worldwide LLC, a Johnson & Johnson company, secured a USD 100 million investment from EQT, a leading global investment firm, to support the growth of its medical aesthetics business, including its breast implant and mastopexy product lines (Johnson & Johnson Press Release).
- In February 2025, the European Commission approved the use of the innovative breast lift technique, the Aptos Thread Lift, for marketing and sales in the European Union. This approval marked a significant technological advancement in the market, offering a less invasive alternative to traditional surgical procedures (Aptos Corporation Press Release).
Dive into Technavio's robust research methodology, blending expert interviews, extensive data synthesis, and validated models for unparalleled Mastopexy Market insights. See full methodology.
|
Market Scope |
|
|
Report Coverage |
Details |
|
Page number |
195 |
|
Base year |
2024 |
|
Historic period |
2019-2023 |
|
Forecast period |
2025-2029 |
|
Growth momentum & CAGR |
Accelerate at a CAGR of 5.9% |
|
Market growth 2025-2029 |
USD 388.3 million |
|
Market structure |
Fragmented |
|
YoY growth 2024-2025(%) |
4.5 |
|
Key countries |
US, Germany, France, South Korea, UK, Japan, Italy, China, Spain, and Canada |
|
Competitive landscape |
Leading Companies, Market Positioning of Companies, Competitive Strategies, and Industry Risks |
Research Analyst Overview
- The market continues to evolve, driven by advancements in surgical techniques and patient demand for improved breast aesthetics. Breast ptosis, or sagging, affects many women, leading to an increasing number of breast lift surgeries each year. According to industry reports, the global breast lift surgery market is projected to grow at a steady rate, reaching a value of over 3.5 billion USD by 2027. Surgical planning plays a crucial role in the success of mastopexy procedures. Advanced tools such as 3D imaging and computer modeling enable surgeons to visualize the desired outcome before the procedure, ensuring accurate implant placement and incision techniques.
- For instance, vertical mastopexy, or a "lollipop" incision, has gained popularity due to its minimal scarring and effective breast lifting capabilities. Despite these advancements, complications remain a concern. Complication rates for breast lift surgery can vary, but proper postoperative care and pain management are essential for optimal recovery. Long-term results also depend on factors such as skin excision techniques, nipple repositioning, and tissue repositioning. One study reported a patient satisfaction rate of 93% for breast lift surgery using local anesthesia and superior pedicle techniques, demonstrating the importance of anesthesia techniques and scar revision methods in enhancing patient experience.
- With ongoing research and advancements, the market is poised for continued growth and innovation.
What are the Key Data Covered in this Mastopexy Market Research and Growth Report?
-
What is the expected growth of the Mastopexy Market between 2025 and 2029?
-
USD 388.3 million, at a CAGR of 5.9%
-
-
What segmentation does the market report cover?
-
The report is segmented by Type (Surgical mastopexy and Non-surgical mastopexy), End-user (Aesthetic and Reconstructive), and Geography (North America, Europe, Asia, and Rest of World (ROW))
-
-
Which regions are analyzed in the report?
-
North America, Europe, Asia, and Rest of World (ROW)
-
-
What are the key growth drivers and market challenges?
-
Growing demand for aesthetic surgery, Stringent government regulations
-
-
Who are the major players in the Mastopexy Market?
-
AbbVie Inc., Bausch Health Companies Inc., Coppergate Clinic, Cynosure Aesthetics Plastic Surgery Clinics, Dr. Benjamin Sarfati, Establishment Labs Holdings Inc., Global Consolidated Aesthetics Ltd., Gulf Coast Plastic Surgery, Hologic Inc., Medicover Hospitals, Mentor Worldwide LLC, MOOI Clinic, POLYTECH Health and Aesthetics GmbH, Sientra Inc., Spire Healthcare Group Plc, University of Pennsylvania Health System, and UT Health East Texas
-
Market Research Insights
- The market for mastopexy, or breast lift surgery, continues to evolve as advancements in surgical techniques and patient education drive demand. Two notable trends include the increasing use of implant placement techniques, such as submuscular and subglandular, and the growing emphasis on patient education and scar management. For instance, a study published in the Aesthetic Surgery Journal found that submuscular implant placement resulted in a 27% decrease in capsular contracture compared to subglandular placement. Furthermore, industry experts anticipate a 5% annual growth rate for the market over the next five years, driven by factors like rising awareness of breast aesthetics and an aging population seeking to address tissue laxity.
- These trends reflect the ongoing efforts to improve patient outcomes and satisfaction, with a focus on minimizing complications, optimizing breast shape, and reducing scar visibility. Suture materials, suturing techniques, and skin elasticity play crucial roles in these advancements, as surgeons strive for precise implant positioning and optimal tissue repositioning. Additionally, physical therapy, tension adjustment, and post-op care have become essential components of the mastopexy process to ensure a smooth recovery and long-term results.
We can help! Our analysts can customize this mastopexy market research report to meet your requirements.
 RIA -
RIA - 
