Menstrual Drugs Market Analysis, Size, and Forecast 2026-2030: North America (US, Canada, and Mexico), Europe (Germany, UK, and France), APAC (China, Japan, and India), Middle East and Africa (UAE, South Africa, and Saudi Arabia), South America (Brazil), Asia, Rest of World (ROW)

Menstrual Drugs Market Analysis, Size, and Forecast 2026-2030:
North America (US, Canada, and Mexico), Europe (Germany, UK, and France), APAC (China, Japan, and India), Middle East and Africa (UAE, South Africa, and Saudi Arabia), South America (Brazil), Asia, Rest of World (ROW)

Published: Dec 2025 313 Pages SKU: IRTNTR80128

Market Overview at a Glance

$4.60 B
Market Opportunity
8.4%
CAGR 2025 - 2030
35.6%
North America Growth
$2.13 B
Hormonal treatments segment 2024

Menstrual Drugs Market Size 2026-2030

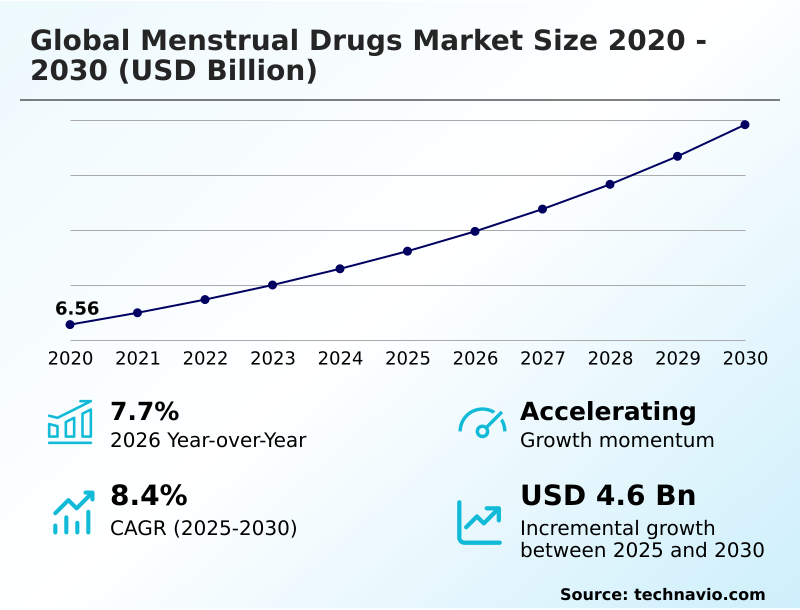
The menstrual drugs market size is valued to increase by USD 4.60 billion, at a CAGR of 8.4% from 2025 to 2030. Increasing global awareness and improved diagnosis of menstrual health disorders will drive the menstrual drugs market.

Major Market Trends & Insights

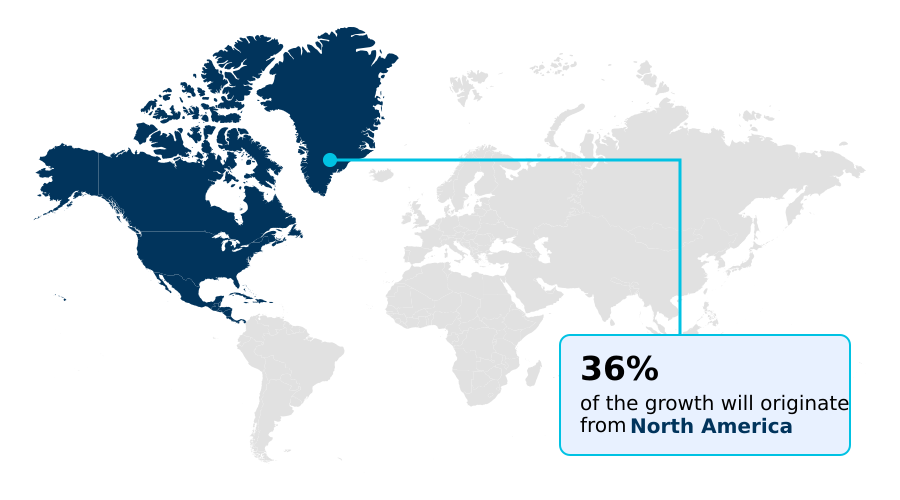
  • North America dominated the market and accounted for a 35.6% growth during the forecast period.
  • By Type - Hormonal treatments segment was valued at USD 2.13 billion in 2024
  • By Route of Administration - Oral medications segment accounted for the largest market revenue share in 2024

Market Size & Forecast

  • Market Opportunities: USD 7.27 billion
  • Market Future Opportunities: USD 4.60 billion
  • CAGR from 2025 to 2030 : 8.4%

Market Summary

  • The menstrual drugs market is undergoing a significant transformation, moving beyond basic symptomatic relief to embrace more sophisticated and patient-centric therapeutic strategies. This evolution is driven by a convergence of factors, including heightened public awareness, destigmatization of women's health issues, and significant pharmaceutical innovation.
  • As a result, conditions such as endometriosis, menorrhagia, and premenstrual dysphoric disorder (PMDD) are being diagnosed more frequently, creating robust demand for targeted treatments like GnRH antagonists and selective serotonin reuptake inhibitors (SSRIs). A key trend is the development of non-hormonal treatment modalities, addressing a clear need for effective options without the side effects of hormonal interventions.
  • For instance, a business scenario involves leveraging digital health platforms that track patient-reported outcomes for a new non-hormonal therapy. Analysis of this data can demonstrate a 20% improvement in quality-of-life scores compared to existing treatments, providing crucial evidence for formulary inclusion and payer negotiations.
  • However, the market faces challenges from stringent regulatory pathways and payer resistance to premium pricing for novel drugs, which can slow the adoption of innovative therapies despite their clinical benefits.

What will be the Size of the Menstrual Drugs Market during the forecast period?

Get Key Insights on Market Forecast (PDF) Request Free Sample

How is the Menstrual Drugs Market Segmented?

The menstrual drugs industry research report provides comprehensive data (region-wise segment analysis), with forecasts and estimates in "USD million" for the period 2026-2030, as well as historical data from 2020-2024 for the following segments.
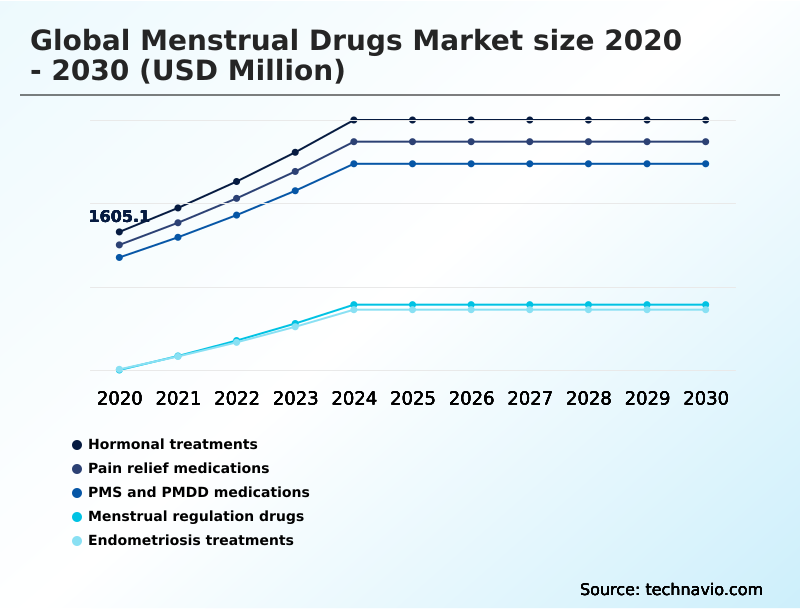
  • Type
    • Hormonal treatments
    • Pain relief medications
    • PMS and PMDD medications
    • Menstrual regulation drugs
    • Endometriosis treatments
  • Route of administration
    • Oral medications
    • Injectables
    • Topical applications
  • Distribution channel
    • Retail pharmacies
    • Hospital pharmacies
    • Online pharmacies
  • Geography
    • North America
      • US
      • Canada
      • Mexico
    • Europe
      • Germany
      • UK
      • France
    • Asia
    • Rest of World (ROW)

By Type Insights

The hormonal treatments segment is estimated to witness significant growth during the forecast period.

Hormonal treatments form a cornerstone of the market, addressing a wide array of cycle-related conditions through endocrine system modulation.

This segment, which includes various forms of oral contraceptives and long-acting reversible contraceptives, is critical for managing dysfunctional uterine bleeding and providing menstrual cycle regulation.

While mature, the segment sees continuous innovation in formulations aimed at improving patient adherence and safety, such as the development of progestin-only pills and lower-dose options to mitigate side effects.

These hormonal interventions are frontline therapies for conditions like polycystic ovary syndrome (PCOS).

The strategic focus on a rx-to-otc switch for certain products has expanded access, contributing to North America's position, which accounts for over 35% of the market's incremental growth, reflecting a shift toward greater patient autonomy in managing gynecological care access and menstrual health.

Request Free Sample

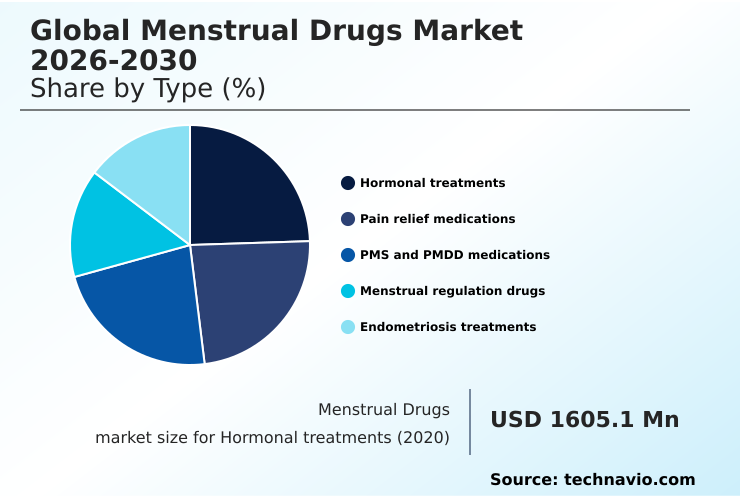
The Hormonal treatments segment was valued at USD 2.13 billion in 2024 and showed a gradual increase during the forecast period.

Request Free Sample

Regional Analysis

North America is estimated to contribute 35.6% to the growth of the global market during the forecast period.Technavio’s analysts have elaborately explained the regional trends and drivers that shape the market during the forecast period.

See How Menstrual Drugs Market Demand is Rising in North America Request Free Sample

The geographic landscape of the market is diverse, with North America and Europe representing mature regions focused on innovation and value-based care.

North America contributes approximately 35.6% of the incremental growth, driven by high awareness and advanced healthcare infrastructure that supports direct-to-consumer advertising and rapid uptake of novel therapies.

In contrast, Asia is the fastest-growing region, with a growth rate of 9.2%, fueled by rising incomes, urbanization, and increasing health literacy that helps in overcoming menstrual stigma.

European markets, which account for about 27% of growth, are characterized by stringent health technology assessment processes, where formulary inclusion often depends on therapies demonstrating clear pharmacoeconomic value.

These assessments prioritize innovative drug delivery systems and treatments that can reduce hospital stays by at least 10%, creating a distinct competitive environment focused on both clinical efficacy and cost-effectiveness.

Market Dynamics

Our researchers analyzed the data with 2025 as the base year, along with the key drivers, trends, and challenges. A holistic analysis of drivers will help companies refine their marketing strategies to gain a competitive advantage.

  • The strategic focus of the market is increasingly on addressing specific, complex patient needs, moving beyond generalized treatments. There is a significant push for developing non-hormonal options for heavy bleeding and advanced treatments for refractory dysmenorrhea, as many patients seek alternatives to traditional hormonal therapy.
  • Managing side effects of hormonal therapy remains a critical concern, driving research into next-generation non-opioid pain relief and targeted therapies for uterine fibroids. The approval of oral GnRH antagonists for endometriosis has set a new standard, while the development of disease-modifying therapies for endometriosis progression represents the next frontier.
  • The use of SSRIs for premenstrual dysphoric disorder is well-established, but research continues into drug development for neuroactive steroid modulation for more personalized treatment for PMDD symptoms. The availability of long-acting injectables for cycle control is growing, with firms comparing transdermal patches and vaginal rings to optimize delivery.
  • Digital tools for PMS and PMDD tracking are becoming vital, with telehealth platforms for menstrual health improving access to care. The advent of OTC progestin-only pill access marks a major shift in patient autonomy, though navigating formulary restrictions for menstrual drugs remains a challenge for newer, premium-priced products.
  • Efforts to improve adherence to endometriosis medication are critical, as are therapies for PCOS-related menstrual irregularity, which can reduce endometrial hyperplasia risk in PCOS by over 60% with consistent treatment.

What are the key market drivers leading to the rise in the adoption of Menstrual Drugs Industry?

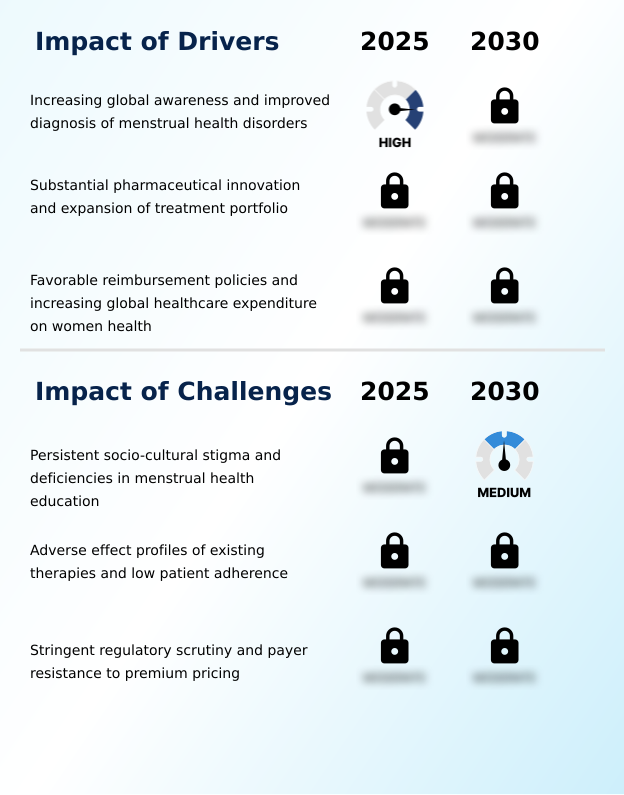
  • Increasing global awareness and improved diagnosis of menstrual health disorders are primary drivers expanding the demand for effective pharmaceutical interventions.

  • The market's expansion is significantly fueled by rising global awareness and improved diagnostic capabilities for menstrual disorders.
  • Increased patient education, amplified by digital health platforms, empowers individuals to seek specialized gynecological care for conditions once normalized, such as menorrhagia and dysmenorrhea. This shift transforms passive sufferers into active consumers, directly increasing prescription rates for targeted therapies.
  • Enhanced medical training equips providers to more accurately diagnose complex conditions like endometriosis and polycystic ovary syndrome (PCOS), leading to a 20% rise in accurate first-time diagnoses in some clinics.
  • Favorable reimbursement policies and greater healthcare spending on women's health further drive growth, making innovative treatments more accessible. This supportive ecosystem, built on destigmatization and improved access, is a foundational driver for sustained market growth and women's healthcare innovation.

What are the market trends shaping the Menstrual Drugs Industry?

  • A defining market trend is the strategic ascendancy of non-hormonal treatment modalities. This shift addresses growing patient demand for therapies with more favorable side-effect profiles.

  • A defining trend is the strategic pivot towards non-hormonal treatment modalities, driven by patient demand for symptom control without the hormonal burden. This shift addresses the needs of individuals with contraindications or preferences against hormonal interventions like oral contraceptives.
  • Pharmaceutical R&D is exploring novel targets for visceral pain management, independent of the endocrine system, to treat conditions such as endometriosis-associated pain and refractory menstrual pain. The development of new neurokinin 3 receptor antagonist drugs is a prime example of this innovation.
  • This pursuit of personalized medicine in gynecology is supported by advancements in female technology (femtech) integration, where digital platforms improve clinical trial endpoint selection, leading to a 15% faster data validation process. These targeted drug delivery systems promise greater efficacy and tolerability, reshaping the competitive landscape for managing chronic gynecological conditions.

What challenges does the Menstrual Drugs Industry face during its growth?

  • Persistent socio-cultural stigma and inadequate menstrual health education remain significant challenges, fundamentally suppressing market potential by hindering diagnosis and treatment-seeking behaviors.

  • A primary challenge is the stringent regulatory scrutiny and payer resistance to premium pricing for innovative therapies, which can stifle women's healthcare innovation. The high bar for approval, requiring extensive clinical trials with subjective endpoints like pain reduction, presents a significant investment risk.
  • Post-approval, new therapies face intense pharmacoeconomic value assessment, with payers often favoring cheaper, generic nonsteroidal anti-inflammatory drugs (NSAIDs). Gaining favorable reimbursement requires demonstrating substantial clinical advantage, a difficult task that can limit market access. For example, some new treatments achieve formulary inclusion in less than 40% of targeted health plans in their first year.
  • This pressure has a chilling effect on R&D for PMDD therapeutic agents and other novel treatments, as companies weigh the risk of low returns on investment, ultimately constraining the options available to patients.

Exclusive Technavio Analysis on Customer Landscape

The menstrual drugs market forecasting report includes the adoption lifecycle of the market, covering from the innovator’s stage to the laggard’s stage. It focuses on adoption rates in different regions based on penetration. Furthermore, the menstrual drugs market report also includes key purchase criteria and drivers of price sensitivity to help companies evaluate and develop their market growth analysis strategies.

Customer Landscape of Menstrual Drugs Industry

Competitive Landscape

Companies are implementing various strategies, such as strategic alliances, menstrual drugs market forecast, partnerships, mergers and acquisitions, geographical expansion, and product/service launches, to enhance their presence in the industry.

AbbVie Inc. - Highlights include an FDA-approved oral medication for heavy menstrual bleeding, underscoring innovation in targeted therapies for specific and underserved gynecological conditions.

The industry research and growth report includes detailed analyses of the competitive landscape of the market and information about key companies, including:

  • AbbVie Inc.
  • Adorefem
  • Bayer AG
  • Cipla Inc.
  • Dr Reddys Laboratories Ltd.
  • GlaxoSmithKline Plc
  • Haleon Plc
  • Johnson and Johnson Services
  • Leeford Healthcare Ltd.
  • Mallinckrodt Plc
  • Maxwellia Ltd.
  • Perrigo Co. Plc
  • Pfizer Inc.
  • Reckitt Benckiser Group Plc
  • Sanofi SA
  • Sumitomo Chemical Co. Ltd.
  • Teva Pharmaceutical Ltd.
  • The Himalaya Drug Co.
  • Walgreens Boots Alliance Inc.
  • Zydus Lifesciences Ltd.

Qualitative and quantitative analysis of companies has been conducted to help clients understand the wider business environment as well as the strengths and weaknesses of key industry players. Data is qualitatively analyzed to categorize companies as pure play, category-focused, industry-focused, and diversified; it is quantitatively analyzed to categorize companies as dominant, leading, strong, tentative, and weak.

Recent Development and News in Menstrual drugs market

  • In October 2024, Bayer AG announced the FDA granted Fast Track designation for its novel non-hormonal investigational drug for the treatment of pain associated with endometriosis, based on promising Phase II data.
  • In January 2025, Pfizer Inc. entered a strategic partnership with a leading digital health platform to integrate its menstrual cycle tracking data into clinical trials for a new PMDD therapy, aiming to improve endpoint accuracy and patient-reported outcomes.
  • In March 2025, Organon & Co. launched its new long-acting subcutaneous injectable contraceptive, offering a six-month dosing interval, in several key European markets, expanding options for long-term menstrual cycle management.
  • In April 2025, AbbVie Inc. completed its acquisition of a clinical-stage biotechnology firm for approximately $1.2 billion, gaining control of a promising portfolio of first-in-class disease-modifying therapies for endometriosis.

Dive into Technavio’s robust research methodology, blending expert interviews, extensive data synthesis, and validated models for unparalleled Menstrual Drugs Market insights. See full methodology.

Market Scope
Page number 313
Base year 2025
Historic period 2020-2024
Forecast period 2026-2030
Growth momentum & CAGR Accelerate at a CAGR of 8.4%
Market growth 2026-2030 USD 4597.4 million
Market structure Fragmented
YoY growth 2025-2026(%) 7.7%
Key countries US, Canada, Mexico, Germany, UK, France, Italy, Spain, The Netherlands, Russia, China, Japan, India, South Korea, Indonesia, Thailand, Singapore, Australia, UAE, Brazil, South Africa, Saudi Arabia and Turkey
Competitive landscape Leading Companies, Market Positioning of Companies, Competitive Strategies, and Industry Risks

Request Free Sample

Research Analyst Overview

  • The menstrual drugs market is advancing beyond symptomatic treatment towards precision-based care, driven by a deeper understanding of underlying pathologies. Key developments center on non-hormonal treatment modalities and disease-modifying therapies, particularly for chronic conditions like endometriosis and uterine fibroids.
  • The introduction of oral gonadotropin releasing hormone (GnRH) antagonists, such as elagolix and relugolix combination therapy, marks a significant milestone, offering targeted management of endometriosis-associated pain. Concurrently, there is a strong pipeline for therapies addressing premenstrual dysphoric disorder (PMDD), including selective serotonin reuptake inhibitors (SSRIs) and novel approaches involving allopregnanolone modulation and GABA-A receptor interaction.
  • For boardroom consideration, the trend of Rx-to-OTC switch strategies is critical; successfully transitioning a product can expand the addressable market by over 30%, but it requires careful navigation of regulatory pathways.
  • The market is also defined by innovation in delivery systems, including transdermal contraceptive patches, intravaginal rings, and long-acting subcutaneous formulations, which aim to improve adherence by avoiding first-pass hepatic metabolism. This push for innovation is balanced by the need to demonstrate value through health technology assessments to secure favorable formulary inclusion and navigate clinical practice guidelines.

What are the Key Data Covered in this Menstrual Drugs Market Research and Growth Report?

  • What is the expected growth of the Menstrual Drugs Market between 2026 and 2030?

    • USD 4.60 billion, at a CAGR of 8.4%

  • What segmentation does the market report cover?

    • The report is segmented by Type (Hormonal treatments, Pain relief medications, PMS and PMDD medications, Menstrual regulation drugs, and Endometriosis treatments), Route of Administration (Oral medications, Injectables, and Topical applications), Distribution Channel (Retail pharmacies, Hospital pharmacies, and Online pharmacies) and Geography (North America, Europe, Asia, Rest of World (ROW))

  • Which regions are analyzed in the report?

    • North America, Europe, Asia and Rest of World (ROW)

  • What are the key growth drivers and market challenges?

    • Increasing global awareness and improved diagnosis of menstrual health disorders, Persistent socio-cultural stigma and deficiencies in menstrual health education

  • Who are the major players in the Menstrual Drugs Market?

    • AbbVie Inc., Adorefem, Bayer AG, Cipla Inc., Dr Reddys Laboratories Ltd., GlaxoSmithKline Plc, Haleon Plc, Johnson and Johnson Services, Leeford Healthcare Ltd., Mallinckrodt Plc, Maxwellia Ltd., Perrigo Co. Plc, Pfizer Inc., Reckitt Benckiser Group Plc, Sanofi SA, Sumitomo Chemical Co. Ltd., Teva Pharmaceutical Ltd., The Himalaya Drug Co., Walgreens Boots Alliance Inc. and Zydus Lifesciences Ltd.

Market Research Insights

  • The market's dynamism is driven by a strategic pivot towards addressing unmet needs in women's healthcare innovation. Advances in personalized medicine in gynecology are enabling more effective long-term endometriosis management and treatments for refractory menstrual pain. The integration of female technology (femtech) is improving patient adherence, with some digital platforms demonstrating a 15% increase in compliance rates for chronic therapies.
  • This focus on improving patient quality of life is evident as companies explore non-hormonal options for PCOS and other neuroendocrine disorder treatments. The transition of certain prescription drugs to over-the-counter status has broadened access, increasing the user base for some therapies by over 25% in initial launch regions.
  • This shift, combined with targeted drug delivery systems, is reshaping the landscape for chronic pain management solutions and specialized gynecological care.

We can help! Our analysts can customize this menstrual drugs market research report to meet your requirements.

Get in touch

1. Executive Summary

1.1 Market overview

Executive Summary - Chart on Market Overview
Executive Summary - Data Table on Market Overview
Executive Summary - Chart on Global Market Characteristics
Executive Summary - Chart on Market by Geography
Executive Summary - Chart on Market Segmentation by Type
Executive Summary - Chart on Market Segmentation by Route of Administration
Executive Summary - Chart on Market Segmentation by Distribution Channel
Executive Summary - Chart on Incremental Growth
Executive Summary - Data Table on Incremental Growth
Executive Summary - Chart on Company Market Positioning

2. Technavio Analysis

2.1 Analysis of price sensitivity, lifecycle, customer purchase basket, adoption rates, and purchase criteria

2.2 Criticality of inputs and Factors of differentiation

Chart on Overview on criticality of inputs and factors of differentiation

2.3 Factors of disruption

Chart on Overview on factors of disruption

2.4 Impact of drivers and challenges

Chart on Impact of drivers and challenges in 2025 and 2030

3. Market Landscape

3.1 Market ecosystem

Chart on Parent Market
Data Table on - Parent Market

3.2 Market characteristics

Chart on Market characteristics analysis

3.3 Value chain analysis

Chart on Value chain analysis

4. Market Sizing

4.1 Market definition

Data Table on Offerings of companies included in the market definition

4.2 Market segment analysis

Market segments

4.3 Market size 2025

4.4 Market outlook: Forecast for 2025-2030

Chart on Global - Market size and forecast 2025-2030 ($ million)
Data Table on Global - Market size and forecast 2025-2030 ($ million)
Chart on Global Market: Year-over-year growth 2025-2030 (%)
Data Table on Global Market: Year-over-year growth 2025-2030 (%)

5. Historic Market Size

5.1 Global Menstrual Drugs Market 2020 - 2024

Historic Market Size - Data Table on Global Menstrual Drugs Market 2020 - 2024 ($ million)

5.2 Type segment analysis 2020 - 2024

Historic Market Size - Type Segment 2020 - 2024 ($ million)

5.3 Route of Administration segment analysis 2020 - 2024

Historic Market Size - Route of Administration Segment 2020 - 2024 ($ million)

5.4 Distribution Channel segment analysis 2020 - 2024

Historic Market Size - Distribution Channel Segment 2020 - 2024 ($ million)

5.5 Geography segment analysis 2020 - 2024

Historic Market Size - Geography Segment 2020 - 2024 ($ million)

5.6 Country segment analysis 2020 - 2024

Historic Market Size - Country Segment 2020 - 2024 ($ million)

6. Qualitative Analysis

6.1 The AI impact on global menstrual drugs market

7. Five Forces Analysis

7.1 Five forces summary

Five forces analysis - Comparison between 2025 and 2030

7.2 Bargaining power of buyers

Bargaining power of buyers - Impact of key factors 2025 and 2030

7.3 Bargaining power of suppliers

Bargaining power of suppliers - Impact of key factors in 2025 and 2030

7.4 Threat of new entrants

Threat of new entrants - Impact of key factors in 2025 and 2030

7.5 Threat of substitutes

Threat of substitutes - Impact of key factors in 2025 and 2030

7.6 Threat of rivalry

Threat of rivalry - Impact of key factors in 2025 and 2030

7.7 Market condition

Chart on Market condition - Five forces 2025 and 2030

8. Market Segmentation by Type

8.1 Market segments

Chart on Type - Market share 2025-2030 (%)
Data Table on Type - Market share 2025-2030 (%)

8.2 Comparison by Type

Chart on Comparison by Type
Data Table on Comparison by Type

8.3 Hormonal treatments - Market size and forecast 2025-2030

Chart on Hormonal treatments - Market size and forecast 2025-2030 ($ million)
Data Table on Hormonal treatments - Market size and forecast 2025-2030 ($ million)
Chart on Hormonal treatments - Year-over-year growth 2025-2030 (%)
Data Table on Hormonal treatments - Year-over-year growth 2025-2030 (%)

8.4 Pain relief medications - Market size and forecast 2025-2030

Chart on Pain relief medications - Market size and forecast 2025-2030 ($ million)
Data Table on Pain relief medications - Market size and forecast 2025-2030 ($ million)
Chart on Pain relief medications - Year-over-year growth 2025-2030 (%)
Data Table on Pain relief medications - Year-over-year growth 2025-2030 (%)

8.5 PMS and PMDD medications - Market size and forecast 2025-2030

Chart on PMS and PMDD medications - Market size and forecast 2025-2030 ($ million)
Data Table on PMS and PMDD medications - Market size and forecast 2025-2030 ($ million)
Chart on PMS and PMDD medications - Year-over-year growth 2025-2030 (%)
Data Table on PMS and PMDD medications - Year-over-year growth 2025-2030 (%)

8.6 Menstrual regulation drugs - Market size and forecast 2025-2030

Chart on Menstrual regulation drugs - Market size and forecast 2025-2030 ($ million)
Data Table on Menstrual regulation drugs - Market size and forecast 2025-2030 ($ million)
Chart on Menstrual regulation drugs - Year-over-year growth 2025-2030 (%)
Data Table on Menstrual regulation drugs - Year-over-year growth 2025-2030 (%)

8.7 Endometriosis treatments - Market size and forecast 2025-2030

Chart on Endometriosis treatments - Market size and forecast 2025-2030 ($ million)
Data Table on Endometriosis treatments - Market size and forecast 2025-2030 ($ million)
Chart on Endometriosis treatments - Year-over-year growth 2025-2030 (%)
Data Table on Endometriosis treatments - Year-over-year growth 2025-2030 (%)

8.8 Market opportunity by Type

Market opportunity by Type ($ million)
Data Table on Market opportunity by Type ($ million)

9. Market Segmentation by Route of Administration

9.1 Market segments

Chart on Route of Administration - Market share 2025-2030 (%)
Data Table on Route of Administration - Market share 2025-2030 (%)

9.2 Comparison by Route of Administration

Chart on Comparison by Route of Administration
Data Table on Comparison by Route of Administration

9.3 Oral medications - Market size and forecast 2025-2030

Chart on Oral medications - Market size and forecast 2025-2030 ($ million)
Data Table on Oral medications - Market size and forecast 2025-2030 ($ million)
Chart on Oral medications - Year-over-year growth 2025-2030 (%)
Data Table on Oral medications - Year-over-year growth 2025-2030 (%)

9.4 Injectables - Market size and forecast 2025-2030

Chart on Injectables - Market size and forecast 2025-2030 ($ million)
Data Table on Injectables - Market size and forecast 2025-2030 ($ million)
Chart on Injectables - Year-over-year growth 2025-2030 (%)
Data Table on Injectables - Year-over-year growth 2025-2030 (%)

9.5 Topical applications - Market size and forecast 2025-2030

Chart on Topical applications - Market size and forecast 2025-2030 ($ million)
Data Table on Topical applications - Market size and forecast 2025-2030 ($ million)
Chart on Topical applications - Year-over-year growth 2025-2030 (%)
Data Table on Topical applications - Year-over-year growth 2025-2030 (%)

9.6 Market opportunity by Route of Administration

Market opportunity by Route of Administration ($ million)
Data Table on Market opportunity by Route of Administration ($ million)

10. Market Segmentation by Distribution Channel

10.1 Market segments

Chart on Distribution Channel - Market share 2025-2030 (%)
Data Table on Distribution Channel - Market share 2025-2030 (%)

10.2 Comparison by Distribution Channel

Chart on Comparison by Distribution Channel
Data Table on Comparison by Distribution Channel

10.3 Retail pharmacies - Market size and forecast 2025-2030

Chart on Retail pharmacies - Market size and forecast 2025-2030 ($ million)
Data Table on Retail pharmacies - Market size and forecast 2025-2030 ($ million)
Chart on Retail pharmacies - Year-over-year growth 2025-2030 (%)
Data Table on Retail pharmacies - Year-over-year growth 2025-2030 (%)

10.4 Hospital pharmacies - Market size and forecast 2025-2030

Chart on Hospital pharmacies - Market size and forecast 2025-2030 ($ million)
Data Table on Hospital pharmacies - Market size and forecast 2025-2030 ($ million)
Chart on Hospital pharmacies - Year-over-year growth 2025-2030 (%)
Data Table on Hospital pharmacies - Year-over-year growth 2025-2030 (%)

10.5 Online pharmacies - Market size and forecast 2025-2030

Chart on Online pharmacies - Market size and forecast 2025-2030 ($ million)
Data Table on Online pharmacies - Market size and forecast 2025-2030 ($ million)
Chart on Online pharmacies - Year-over-year growth 2025-2030 (%)
Data Table on Online pharmacies - Year-over-year growth 2025-2030 (%)

10.6 Market opportunity by Distribution Channel

Market opportunity by Distribution Channel ($ million)
Data Table on Market opportunity by Distribution Channel ($ million)

11. Customer Landscape

11.1 Customer landscape overview

Analysis of price sensitivity, lifecycle, customer purchase basket, adoption rates, and purchase criteria

12. Geographic Landscape

12.1 Geographic segmentation

Chart on Market share by geography 2025-2030 (%)
Data Table on Market share by geography 2025-2030 (%)

12.2 Geographic comparison

Chart on Geographic comparison
Data Table on Geographic comparison

12.3 North America - Market size and forecast 2025-2030

Chart on North America - Market size and forecast 2025-2030 ($ million)
Data Table on North America - Market size and forecast 2025-2030 ($ million)
Chart on North America - Year-over-year growth 2025-2030 (%)
Data Table on North America - Year-over-year growth 2025-2030 (%)
Chart on Regional Comparison - North America
Data Table on Regional Comparison - North America

12.3.1 US - Market size and forecast 2025-2030

Chart on US - Market size and forecast 2025-2030 ($ million)
Data Table on US - Market size and forecast 2025-2030 ($ million)
Chart on US - Year-over-year growth 2025-2030 (%)
Data Table on US - Year-over-year growth 2025-2030 (%)

12.3.2 Canada - Market size and forecast 2025-2030

Chart on Canada - Market size and forecast 2025-2030 ($ million)
Data Table on Canada - Market size and forecast 2025-2030 ($ million)
Chart on Canada - Year-over-year growth 2025-2030 (%)
Data Table on Canada - Year-over-year growth 2025-2030 (%)

12.3.3 Mexico - Market size and forecast 2025-2030

Chart on Mexico - Market size and forecast 2025-2030 ($ million)
Data Table on Mexico - Market size and forecast 2025-2030 ($ million)
Chart on Mexico - Year-over-year growth 2025-2030 (%)
Data Table on Mexico - Year-over-year growth 2025-2030 (%)

12.4 Europe - Market size and forecast 2025-2030

Chart on Europe - Market size and forecast 2025-2030 ($ million)
Data Table on Europe - Market size and forecast 2025-2030 ($ million)
Chart on Europe - Year-over-year growth 2025-2030 (%)
Data Table on Europe - Year-over-year growth 2025-2030 (%)
Chart on Regional Comparison - Europe
Data Table on Regional Comparison - Europe

12.4.1 Germany - Market size and forecast 2025-2030

Chart on Germany - Market size and forecast 2025-2030 ($ million)
Data Table on Germany - Market size and forecast 2025-2030 ($ million)
Chart on Germany - Year-over-year growth 2025-2030 (%)
Data Table on Germany - Year-over-year growth 2025-2030 (%)

12.4.2 UK - Market size and forecast 2025-2030

Chart on UK - Market size and forecast 2025-2030 ($ million)
Data Table on UK - Market size and forecast 2025-2030 ($ million)
Chart on UK - Year-over-year growth 2025-2030 (%)
Data Table on UK - Year-over-year growth 2025-2030 (%)

12.4.3 France - Market size and forecast 2025-2030

Chart on France - Market size and forecast 2025-2030 ($ million)
Data Table on France - Market size and forecast 2025-2030 ($ million)
Chart on France - Year-over-year growth 2025-2030 (%)
Data Table on France - Year-over-year growth 2025-2030 (%)

12.4.4 Italy - Market size and forecast 2025-2030

Chart on Italy - Market size and forecast 2025-2030 ($ million)
Data Table on Italy - Market size and forecast 2025-2030 ($ million)
Chart on Italy - Year-over-year growth 2025-2030 (%)
Data Table on Italy - Year-over-year growth 2025-2030 (%)

12.4.5 Spain - Market size and forecast 2025-2030

Chart on Spain - Market size and forecast 2025-2030 ($ million)
Data Table on Spain - Market size and forecast 2025-2030 ($ million)
Chart on Spain - Year-over-year growth 2025-2030 (%)
Data Table on Spain - Year-over-year growth 2025-2030 (%)

12.4.6 The Netherlands - Market size and forecast 2025-2030

Chart on The Netherlands - Market size and forecast 2025-2030 ($ million)
Data Table on The Netherlands - Market size and forecast 2025-2030 ($ million)
Chart on The Netherlands - Year-over-year growth 2025-2030 (%)
Data Table on The Netherlands - Year-over-year growth 2025-2030 (%)

12.4.7 Russia - Market size and forecast 2025-2030

Chart on Russia - Market size and forecast 2025-2030 ($ million)
Data Table on Russia - Market size and forecast 2025-2030 ($ million)
Chart on Russia - Year-over-year growth 2025-2030 (%)
Data Table on Russia - Year-over-year growth 2025-2030 (%)

12.5 Asia - Market size and forecast 2025-2030

Chart on Asia - Market size and forecast 2025-2030 ($ million)
Data Table on Asia - Market size and forecast 2025-2030 ($ million)
Chart on Asia - Year-over-year growth 2025-2030 (%)
Data Table on Asia - Year-over-year growth 2025-2030 (%)
Chart on Regional Comparison - Asia
Data Table on Regional Comparison - Asia

12.5.1 China - Market size and forecast 2025-2030

Chart on China - Market size and forecast 2025-2030 ($ million)
Data Table on China - Market size and forecast 2025-2030 ($ million)
Chart on China - Year-over-year growth 2025-2030 (%)
Data Table on China - Year-over-year growth 2025-2030 (%)

12.5.2 Japan - Market size and forecast 2025-2030

Chart on Japan - Market size and forecast 2025-2030 ($ million)
Data Table on Japan - Market size and forecast 2025-2030 ($ million)
Chart on Japan - Year-over-year growth 2025-2030 (%)
Data Table on Japan - Year-over-year growth 2025-2030 (%)

12.5.3 India - Market size and forecast 2025-2030

Chart on India - Market size and forecast 2025-2030 ($ million)
Data Table on India - Market size and forecast 2025-2030 ($ million)
Chart on India - Year-over-year growth 2025-2030 (%)
Data Table on India - Year-over-year growth 2025-2030 (%)

12.5.4 South Korea - Market size and forecast 2025-2030

Chart on South Korea - Market size and forecast 2025-2030 ($ million)
Data Table on South Korea - Market size and forecast 2025-2030 ($ million)
Chart on South Korea - Year-over-year growth 2025-2030 (%)
Data Table on South Korea - Year-over-year growth 2025-2030 (%)

12.5.5 Indonesia - Market size and forecast 2025-2030

Chart on Indonesia - Market size and forecast 2025-2030 ($ million)
Data Table on Indonesia - Market size and forecast 2025-2030 ($ million)
Chart on Indonesia - Year-over-year growth 2025-2030 (%)
Data Table on Indonesia - Year-over-year growth 2025-2030 (%)

12.5.6 Thailand - Market size and forecast 2025-2030

Chart on Thailand - Market size and forecast 2025-2030 ($ million)
Data Table on Thailand - Market size and forecast 2025-2030 ($ million)
Chart on Thailand - Year-over-year growth 2025-2030 (%)
Data Table on Thailand - Year-over-year growth 2025-2030 (%)

12.5.7 Singapore - Market size and forecast 2025-2030

Chart on Singapore - Market size and forecast 2025-2030 ($ million)
Data Table on Singapore - Market size and forecast 2025-2030 ($ million)
Chart on Singapore - Year-over-year growth 2025-2030 (%)
Data Table on Singapore - Year-over-year growth 2025-2030 (%)

12.6 Rest of World (ROW) - Market size and forecast 2025-2030

Chart on Rest of World (ROW) - Market size and forecast 2025-2030 ($ million)
Data Table on Rest of World (ROW) - Market size and forecast 2025-2030 ($ million)
Chart on Rest of World (ROW) - Year-over-year growth 2025-2030 (%)
Data Table on Rest of World (ROW) - Year-over-year growth 2025-2030 (%)
Chart on Regional Comparison - Rest of World (ROW)
Data Table on Regional Comparison - Rest of World (ROW)

12.6.1 Australia - Market size and forecast 2025-2030

Chart on Australia - Market size and forecast 2025-2030 ($ million)
Data Table on Australia - Market size and forecast 2025-2030 ($ million)
Chart on Australia - Year-over-year growth 2025-2030 (%)
Data Table on Australia - Year-over-year growth 2025-2030 (%)

12.6.2 UAE - Market size and forecast 2025-2030

Chart on UAE - Market size and forecast 2025-2030 ($ million)
Data Table on UAE - Market size and forecast 2025-2030 ($ million)
Chart on UAE - Year-over-year growth 2025-2030 (%)
Data Table on UAE - Year-over-year growth 2025-2030 (%)

12.6.3 Brazil - Market size and forecast 2025-2030

Chart on Brazil - Market size and forecast 2025-2030 ($ million)
Data Table on Brazil - Market size and forecast 2025-2030 ($ million)
Chart on Brazil - Year-over-year growth 2025-2030 (%)
Data Table on Brazil - Year-over-year growth 2025-2030 (%)

12.6.4 South Africa - Market size and forecast 2025-2030

Chart on South Africa - Market size and forecast 2025-2030 ($ million)
Data Table on South Africa - Market size and forecast 2025-2030 ($ million)
Chart on South Africa - Year-over-year growth 2025-2030 (%)
Data Table on South Africa - Year-over-year growth 2025-2030 (%)

12.6.5 Saudi Arabia - Market size and forecast 2025-2030

Chart on Saudi Arabia - Market size and forecast 2025-2030 ($ million)
Data Table on Saudi Arabia - Market size and forecast 2025-2030 ($ million)
Chart on Saudi Arabia - Year-over-year growth 2025-2030 (%)
Data Table on Saudi Arabia - Year-over-year growth 2025-2030 (%)

12.6.6 Turkey - Market size and forecast 2025-2030

Chart on Turkey - Market size and forecast 2025-2030 ($ million)
Data Table on Turkey - Market size and forecast 2025-2030 ($ million)
Chart on Turkey - Year-over-year growth 2025-2030 (%)
Data Table on Turkey - Year-over-year growth 2025-2030 (%)

12.7 Market opportunity by geography

Market opportunity by geography ($ million)
Data Tables on Market opportunity by geography ($ million)

13. Drivers, Challenges, and Opportunity

13.1 Market drivers

Increasing global awareness and improved diagnosis of menstrual health disorders
Substantial pharmaceutical innovation and expansion of treatment portfolio
Favorable reimbursement policies and increasing global healthcare expenditure on women health

13.2 Market challenges

Persistent socio-cultural stigma and deficiencies in menstrual health education
Adverse effect profiles of existing therapies and low patient adherence
Stringent regulatory scrutiny and payer resistance to premium pricing

13.3 Impact of drivers and challenges

Impact of drivers and challenges in 2025 and 2030

13.4 Market opportunities

Ascendancy of non-hormonal treatment modalities
Integration of digital health and pursuit of personalized medicine
Strategic focus on disease-modifying therapies over symptomatic relief

14. Competitive Landscape

14.1 Overview

14.2

Overview on criticality of inputs and factors of differentiation

14.3 Landscape disruption

Overview on factors of disruption

14.4 Industry risks

Impact of key risks on business

15. Competitive Analysis

15.1 Companies profiled

Companies covered

15.2 Company ranking index

15.3 Market positioning of companies

Matrix on companies position and classification

15.4 AbbVie Inc.

AbbVie Inc. - Overview
AbbVie Inc. - Product / Service
AbbVie Inc. - Key news
AbbVie Inc. - Key offerings
SWOT

15.5 Bayer AG

Bayer AG - Overview
Bayer AG - Business segments
Bayer AG - Key news
Bayer AG - Key offerings
Bayer AG - Segment focus
SWOT

15.6 Cipla Inc.

Cipla Inc. - Overview
Cipla Inc. - Business segments
Cipla Inc. - Key news
Cipla Inc. - Key offerings
Cipla Inc. - Segment focus
SWOT

15.7 Dr Reddys Laboratories Ltd.

Dr Reddys Laboratories Ltd. - Overview
Dr Reddys Laboratories Ltd. - Business segments
Dr Reddys Laboratories Ltd. - Key news
Dr Reddys Laboratories Ltd. - Key offerings
Dr Reddys Laboratories Ltd. - Segment focus
SWOT

15.8 GlaxoSmithKline Plc

GlaxoSmithKline Plc - Overview
GlaxoSmithKline Plc - Business segments
GlaxoSmithKline Plc - Key news
GlaxoSmithKline Plc - Key offerings
GlaxoSmithKline Plc - Segment focus
SWOT

15.9 Haleon Plc

Haleon Plc - Overview
Haleon Plc - Business segments
Haleon Plc - Key offerings
Haleon Plc - Segment focus
SWOT

15.10 Johnson and Johnson Services

Johnson and Johnson Services - Overview
Johnson and Johnson Services - Business segments
Johnson and Johnson Services - Key news
Johnson and Johnson Services - Key offerings
Johnson and Johnson Services - Segment focus
SWOT

15.11 Mallinckrodt Plc

Mallinckrodt Plc - Overview
Mallinckrodt Plc - Business segments
Mallinckrodt Plc - Key news
Mallinckrodt Plc - Key offerings
Mallinckrodt Plc - Segment focus
SWOT

15.12 Perrigo Co. Plc

Perrigo Co. Plc - Overview
Perrigo Co. Plc - Business segments
Perrigo Co. Plc - Key offerings
Perrigo Co. Plc - Segment focus
SWOT

15.13 Pfizer Inc.

Pfizer Inc. - Overview
Pfizer Inc. - Product / Service
Pfizer Inc. - Key news
Pfizer Inc. - Key offerings
SWOT

15.14 Reckitt Benckiser Group Plc

Reckitt Benckiser Group Plc - Overview
Reckitt Benckiser Group Plc - Business segments
Reckitt Benckiser Group Plc - Key news
Reckitt Benckiser Group Plc - Key offerings
Reckitt Benckiser Group Plc - Segment focus
SWOT

15.15 Sanofi SA

Sanofi SA - Overview
Sanofi SA - Business segments
Sanofi SA - Key news
Sanofi SA - Key offerings
Sanofi SA - Segment focus
SWOT

15.16 Sumitomo Chemical Co. Ltd.

Sumitomo Chemical Co. Ltd. - Overview
Sumitomo Chemical Co. Ltd. - Business segments
Sumitomo Chemical Co. Ltd. - Key offerings
Sumitomo Chemical Co. Ltd. - Segment focus
SWOT

15.17 Teva Pharmaceutical Ltd.

Teva Pharmaceutical Ltd. - Overview
Teva Pharmaceutical Ltd. - Business segments
Teva Pharmaceutical Ltd. - Key news
Teva Pharmaceutical Ltd. - Key offerings
Teva Pharmaceutical Ltd. - Segment focus
SWOT

15.18 Zydus Lifesciences Ltd.

Zydus Lifesciences Ltd. - Overview
Zydus Lifesciences Ltd. - Business segments
Zydus Lifesciences Ltd. - Key news
Zydus Lifesciences Ltd. - Key offerings
Zydus Lifesciences Ltd. - Segment focus
SWOT

16. Appendix

16.1 Scope of the report

Market definition
Objectives
Notes and caveats

16.2 Inclusions and exclusions checklist

Inclusions checklist
Exclusions checklist

16.3 Currency conversion rates for US$

16.4 Research methodology

16.5 Data procurement

Information sources

16.6 Data validation

16.7 Validation techniques employed for market sizing

16.8 Data synthesis

16.9 360 degree market analysis

16.10 List of abbreviations

Research Methodology

Technavio presents a detailed picture of the market by way of study, synthesis, and summation of data from multiple sources. The analysts have presented the various facets of the market with a particular focus on identifying the key industry influencers. The data thus presented is comprehensive, reliable, and the result of extensive research, both primary and secondary.

INFORMATION SOURCES

Primary sources

  • Manufacturers and suppliers
  • Channel partners
  • Industry experts
  • Strategic decision makers

Secondary sources

  • Industry journals and periodicals
  • Government data
  • Financial reports of key industry players
  • Historical data
  • Press releases

DATA ANALYSIS

Data Synthesis

  • Collation of data
  • Estimation of key figures
  • Analysis of derived insights

Data Validation

  • Triangulation with data models
  • Reference against proprietary databases
  • Corroboration with industry experts

REPORT WRITING

Qualitative

  • Market drivers
  • Market challenges
  • Market trends
  • Five forces analysis

Quantitative

  • Market size and forecast
  • Market segmentation
  • Geographical insights
  • Competitive landscape

Interested in this report?

Get your sample now to see our research methodology and insights!

Download Now

Frequently Asked Questions

Menstrual Drugs market growth will increase by USD 4597.4 million during 2026-2030 .

The Menstrual Drugs market is expected to grow at a CAGR of 8.4% during 2026-2030 .

Menstrual Drugs market is segmented by Type (Hormonal treatments, Pain relief medications, PMS and PMDD medications, Menstrual regulation drugs, Endometriosis treatments) Route of administration (Oral medications, Injectables, Topical applications) Distribution channel (Retail pharmacies, Hospital pharmacies, Online pharmacies)

AbbVie Inc., Adorefem, Bayer AG, Cipla Inc., Dr Reddys Laboratories Ltd., GlaxoSmithKline Plc, Haleon Plc, Johnson and Johnson Services, Leeford Healthcare Ltd., Mallinckrodt Plc, Maxwellia Ltd., Perrigo Co. Plc, Pfizer Inc., Reckitt Benckiser Group Plc, Sanofi SA, Sumitomo Chemical Co. Ltd., Teva Pharmaceutical Ltd., The Himalaya Drug Co., Walgreens Boots Alliance Inc., Zydus Lifesciences Ltd. are a few of the key vendors in the Menstrual Drugs market.

North America will register the highest growth rate of 35.6% among the other regions. Therefore, the Menstrual Drugs market in North America is expected to garner significant business opportunities for the vendors during the forecast period.

US, Canada, Mexico, Germany, UK, France, Italy, Spain, The Netherlands, Russia, China, Japan, India, South Korea, Indonesia, Thailand, Singapore, Australia, UAE, Brazil, South Africa, Saudi Arabia, Turkey

  • Increasing global awareness and improved diagnosis of menstrual health disorders is the driving factor this market.

The Menstrual Drugs market vendors should focus on grabbing business opportunities from the Type segment as it accounted for the largest market share in the base year.