Metal Deactivator Market Size 2026-2030
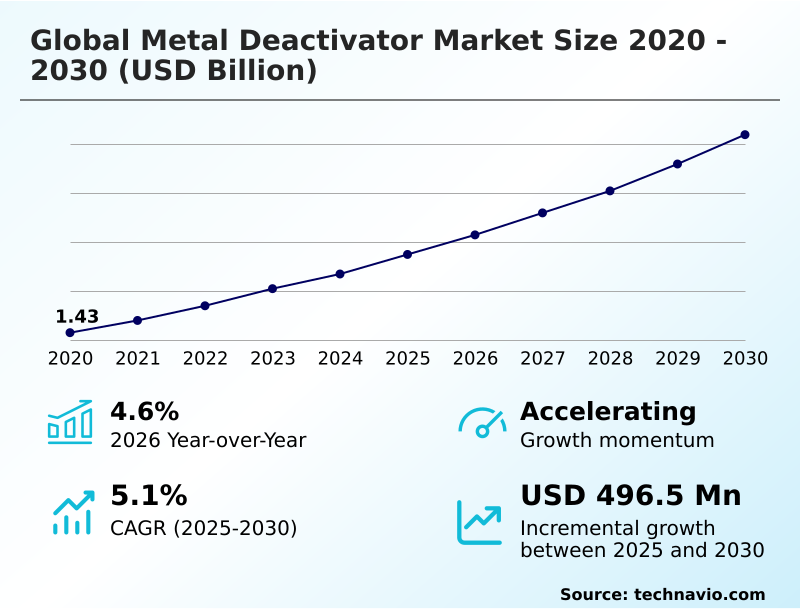
The metal deactivator market size is valued to increase by USD 496.5 million, at a CAGR of 5.1% from 2025 to 2030. Increasing need for reliable machinery and its effective maintenance will drive the metal deactivator market.
Major Market Trends & Insights
- APAC dominated the market and accounted for a 38.5% growth during the forecast period.
- By Formulation - Oil soluble segment was valued at USD 1.07 billion in 2024
- By End-user - Automotive segment accounted for the largest market revenue share in 2024
Market Size & Forecast
- Market Opportunities: USD 815.9 million
- Market Future Opportunities: USD 496.5 million
- CAGR from 2025 to 2030 : 5.1%
Market Summary
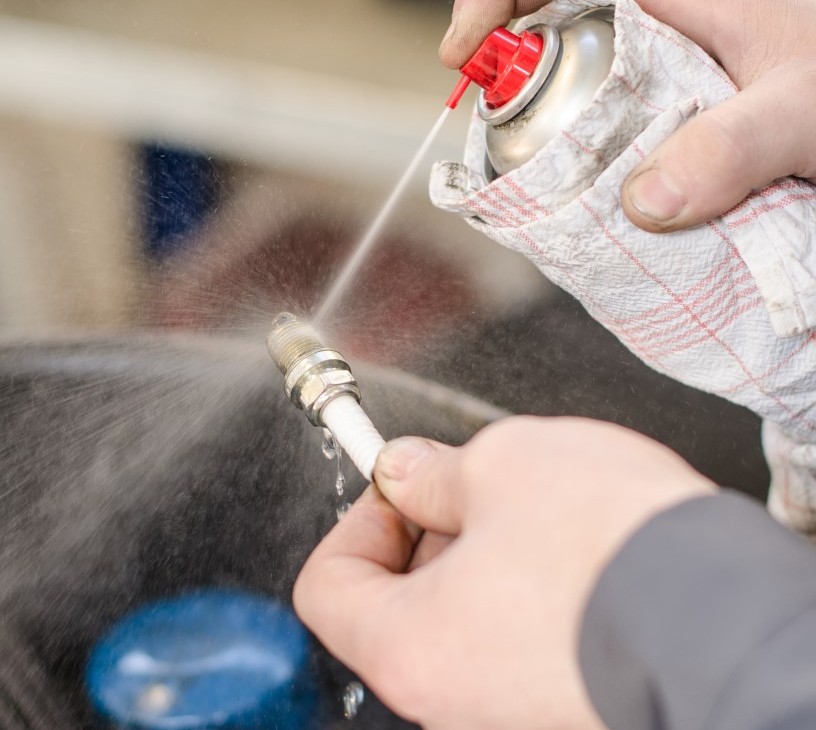
- The metal deactivator market is centered on advanced chemical additives essential for preventing the oxidative degradation of fuels, lubricants, and industrial fluids. These products function through metal ion stabilization, neutralizing catalytic metal ions that would otherwise accelerate the formation of harmful sludge and varnish.
- Key drivers include the increasing demand for high-performance lubricants in modern machinery and the need for greater fuel stability in both conventional and alternative energy systems. A significant trend is the shift toward sustainable metal deactivators and multifunctional additive packages that offer comprehensive protection. For instance, an industrial plant manager incorporates advanced preventive maintenance chemicals into their lubrication schedules.
- This strategy not only protects high-value assets from premature wear but also extends maintenance cycles, leading to significant reductions in operational downtime and costs. However, the market faces challenges from volatile raw material pricing tied to crude oil and stringent environmental regulations demanding low-toxicity, biodegradable solutions.
What will be the Size of the Metal Deactivator Market during the forecast period?
Get Key Insights on Market Forecast (PDF) Get Free Sample
How is the Metal Deactivator Market Segmented?
The metal deactivator industry research report provides comprehensive data (region-wise segment analysis), with forecasts and estimates in "USD million" for the period 2026-2030, as well as historical data from 2020-2024 for the following segments.
- Formulation
- Oil soluble
- Water soluble
- End-user
- Automotive
- Industrial
- Aviation
- Marine
- Others
- Type
- Fuel additives
- Lubricant additives
- Others
- Geography
- APAC
- China
- Japan
- India
- North America
- US
- Canada
- Mexico
- Europe
- Germany
- UK
- France
- South America
- Brazil
- Argentina
- Colombia
- Middle East and Africa
- Saudi Arabia
- UAE
- South Africa
- Rest of World (ROW)
- APAC
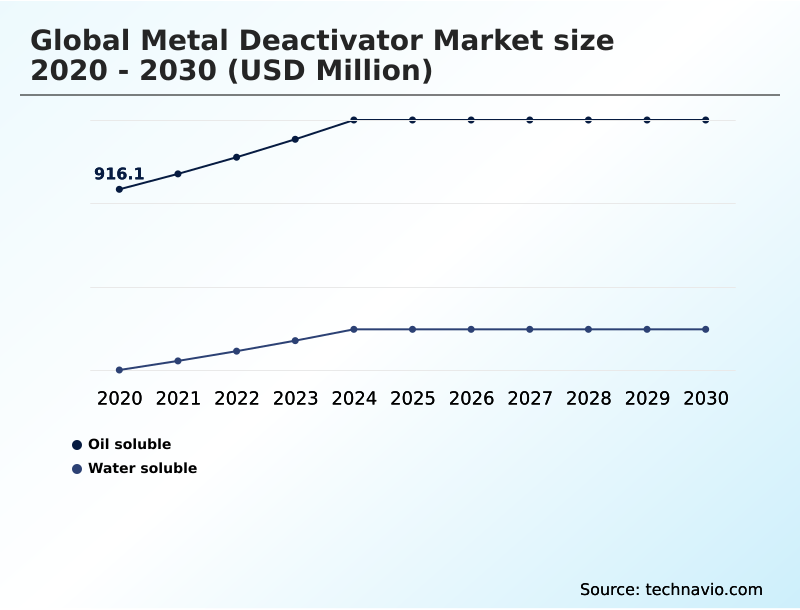
By Formulation Insights
The oil soluble segment is estimated to witness significant growth during the forecast period.
The oil-soluble segment is critical for protecting high-value machinery and fuel systems. An oil-soluble deactivator functions by creating a passive layer on metal surfaces, neutralizing the catalytic effect of copper and iron that accelerates the oxidation of lubricants and fuels.
This process of metal ion stabilization is essential for preventing the formation of sludge and varnish, ensuring equipment operates efficiently. As automotive and industrial systems demand higher performance under extreme thermal stress, these additives are vital.
Formulations are designed for seamless integration into refinery processes, with innovations focused on multifunctional additives that combine corrosion protection with metal deactivation.
Adopting these advanced chemistries can improve fluid stability by up to 40%, directly extending asset life and reducing maintenance costs.
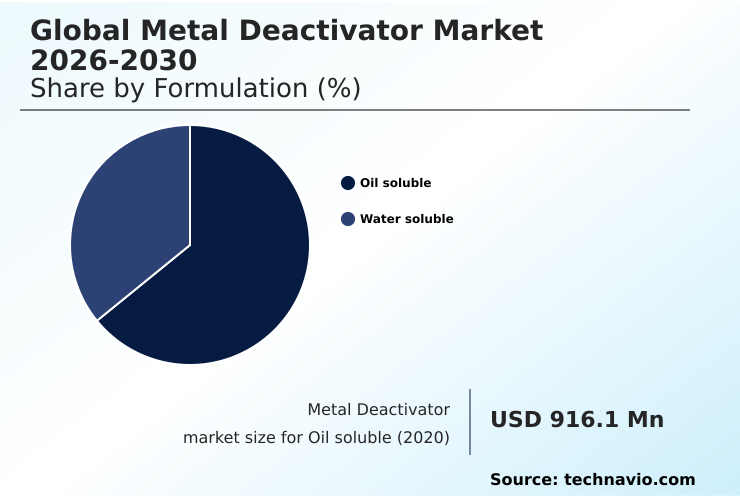
The Oil soluble segment was valued at USD 1.07 billion in 2024 and showed a gradual increase during the forecast period.
Regional Analysis
APAC is estimated to contribute 38.5% to the growth of the global market during the forecast period.Technavio’s analysts have elaborately explained the regional trends and drivers that shape the market during the forecast period.
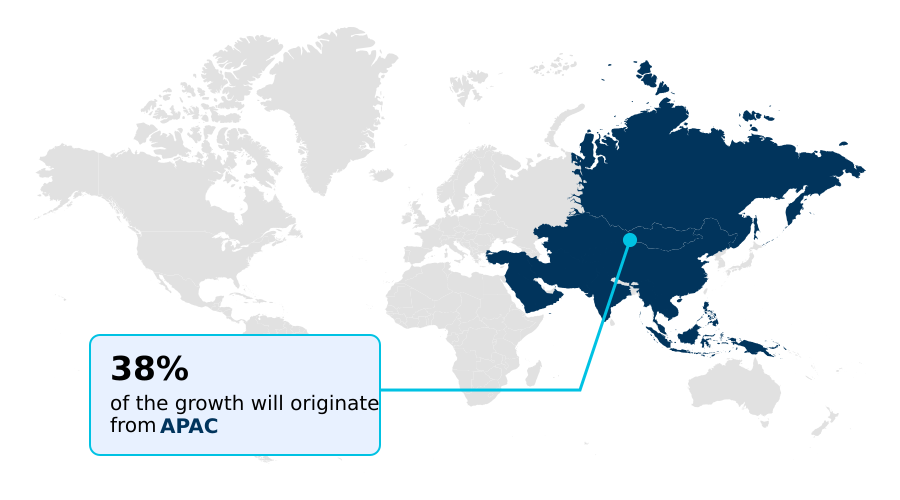
See How Metal Deactivator Market Demand is Rising in APAC Get Free Sample
The global geographic landscape is led by APAC, which accounts for over 38% of the incremental growth, driven by rapid industrialization and automotive sector expansion in countries like China and India.
The region's demand for high-performance lubricants and industrial gear oils fuels the need for robust metal deactivator solutions.
North America remains a key market, characterized by mature industrial applications and stringent regulatory standards that push innovation in areas like jet fuel thermal stability and ashless metal deactivators.
Europe focuses heavily on sustainability and regulatory compliance, fostering the development of low VOC metal deactivators and biodegradable chelating agents.
The market in this region benefits from a strong focus on high-performance engine oil additives, with companies achieving a 20% improvement in additive efficiency to meet emissions standards.
Market Dynamics
Our researchers analyzed the data with 2025 as the base year, along with the key drivers, trends, and challenges. A holistic analysis of drivers will help companies refine their marketing strategies to gain a competitive advantage.
- Understanding the metal deactivator market requires a nuanced look at its diverse applications and the economic factors influencing its trajectory. A primary question is how metal deactivators prevent fuel oxidation; they work by forming a passive film on metal surfaces, sequestering catalytic ions that accelerate degradation.
- This function is critical in modern applications, with metal deactivator performance in high-temperature engines being a key differentiator for suppliers. The role of chelating agents in lubricant stability is equally important, as they prevent the formation of sludge and varnish that impair machinery.
- Industry stakeholders are increasingly realizing the benefits of multifunctional additives in fuels, which combine deactivation with corrosion inhibition and other protective properties. This approach can streamline supply chains, with some formulators reporting up to a 15% reduction in inventory management costs compared to using separate additives.
- However, the environmental impact of traditional metal deactivators remains a significant concern, driving demand for greener alternatives. The selection of an ashless metal deactivator for turbine oils or water-soluble deactivators for EV coolants is now guided by both performance and sustainability criteria. Similarly, selecting metal deactivators for biodiesel is essential to ensure fuel stability.
- Effective strategies for preventing copper corrosion in hydraulic systems are crucial for industrial maintenance. Finally, the impact of crude oil prices on additive costs is a constant challenge, forcing manufacturers to innovate and optimize formulations to maintain profitability.
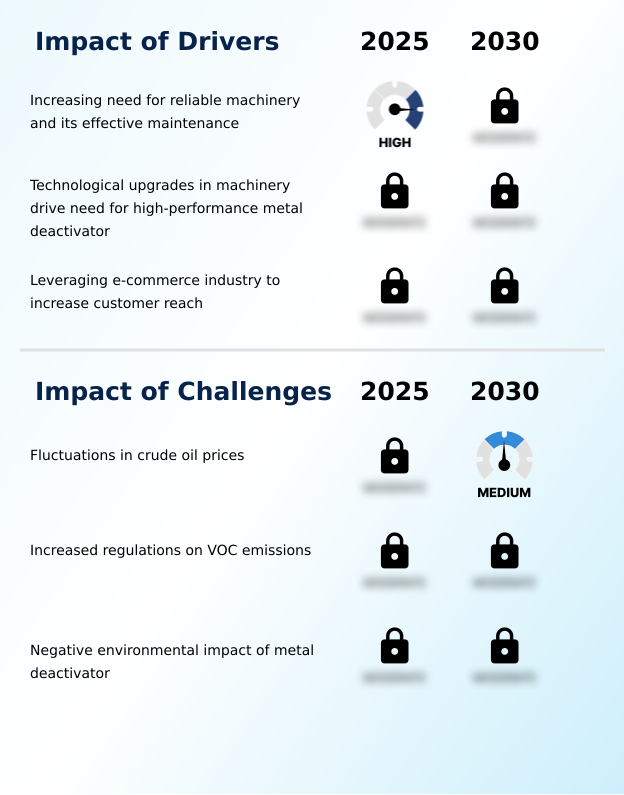
What are the key market drivers leading to the rise in the adoption of Metal Deactivator Industry?
- The increasing need for reliable machinery and its effective maintenance is a key driver for the metal deactivator market, as industries seek to extend asset life and improve operational efficiency.
- The primary driver for the metal deactivator market is the increasing need for reliable machinery and effective preventive maintenance chemicals.
- As industrial equipment and automotive engines operate at higher temperatures, the demand for high-temperature lubricant additives and solutions providing hydraulic fluid protection has intensified.
- Utilizing advanced metal deactivators can reduce equipment downtime by up to 30% by preventing catalytic degradation and sludge formation. Technological advancements in machinery also necessitate superior chemical protection, pushing formulators to develop more robust solutions.
- Concurrently, the rise of e-commerce platforms has expanded market access, enabling smaller enterprises to procure specialized additives and increasing sales in previously underserved segments by more than 15%, thereby broadening the customer base globally.
What are the market trends shaping the Metal Deactivator Industry?
- The growing demand for sustainable metal deactivators is a significant upcoming market trend, driven by global initiatives for environmental preservation and the reduction of toxic industrial waste.
- The metal deactivator market is increasingly shaped by the demand for sustainable and high-performance solutions. A major trend is the development of multifunctional additive packages, which combine rust inhibitors and metal ion stabilization capabilities, reducing formulation complexity for lubricant blenders by over 30%.
- The push for sustainability is driving innovation in biodegradable chelating agents and bio-based formulas, particularly for applications in sensitive environments. The adoption of such green chemistries is accelerating, with certain advanced formulations demonstrating up to 95% biodegradability.
- Furthermore, rapid industrialization in emerging economies is expanding the use of these additives in applications ranging from industrial coolants to marine fuel stabilizers, supporting the need for enhanced equipment protection and longevity. This evolution underscores a market focused on both efficiency and environmental responsibility.
What challenges does the Metal Deactivator Industry face during its growth?
- Fluctuations in crude oil prices present a key challenge affecting the growth of the metal deactivator industry, as raw material costs are directly linked to petrochemical feedstock pricing.
- Key challenges in the metal deactivator market stem from economic volatility and stringent regulatory pressures. The direct link to petrochemical feedstocks means that raw material costs for synthesizing additives can fluctuate by as much as 25% in a single quarter, impacting profitability and pricing stability.
- Concurrently, heightened regulations on emissions have necessitated a shift toward low VOC metal deactivators, a transition that increases R&D expenditure by approximately 20% for reformulation and certification.
- This move also pressures manufacturers to develop water-soluble metal passivator technologies and other eco-friendly alternatives to traditional solvent-based systems, requiring significant investment in green chemistry to balance performance with environmental compliance and address concerns over the negative impact of conventional additives.
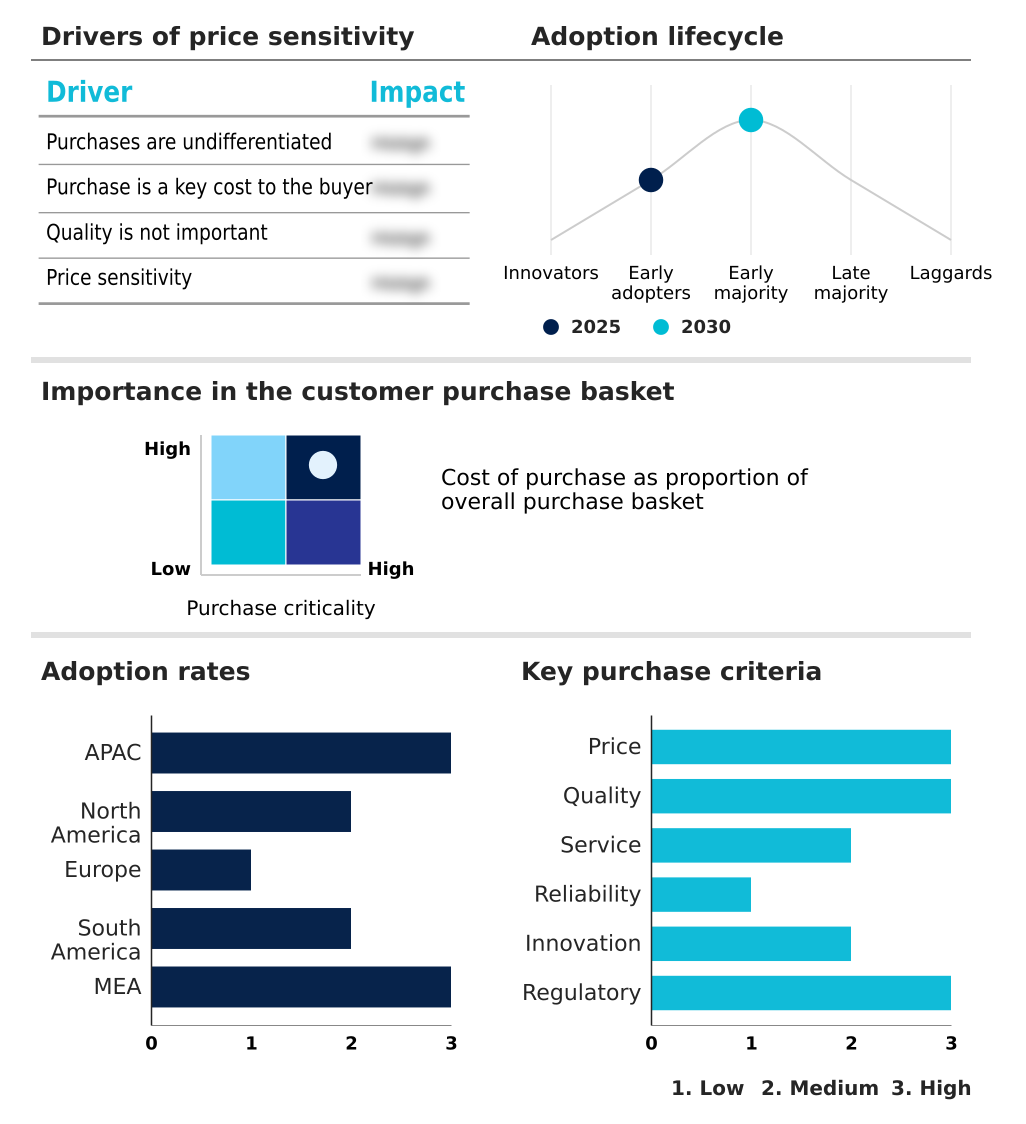
Exclusive Technavio Analysis on Customer Landscape
The metal deactivator market forecasting report includes the adoption lifecycle of the market, covering from the innovator’s stage to the laggard’s stage. It focuses on adoption rates in different regions based on penetration. Furthermore, the metal deactivator market report also includes key purchase criteria and drivers of price sensitivity to help companies evaluate and develop their market growth analysis strategies.
Customer Landscape of Metal Deactivator Industry
Competitive Landscape
Companies are implementing various strategies, such as strategic alliances, metal deactivator market forecast, partnerships, mergers and acquisitions, geographical expansion, and product/service launches, to enhance their presence in the industry.
ADEKA Corp. - Specialized additives neutralize catalytic metal effects, effectively reducing gum and sediment formation in high-performance fuel and lubricant systems to ensure operational stability and extend equipment life.
The industry research and growth report includes detailed analyses of the competitive landscape of the market and information about key companies, including:
- ADEKA Corp.
- Afton Chemical
- BASF SE
- Clariant International Ltd.
- Dorf Ketal Chemicals Ltd.
- Dow Chemical Co.
- Eastman Chemical Co.
- Innospec Inc.
- King Industries Inc.
- Lanxess AG
- Mayzo Inc.
- Metall-Chemie Holding GmbH
- Reaxis Inc.
- Shell plc
- SI Group Inc.
- Songwon Industrial Co. Ltd.
- The Lubrizol Corp.
- Vanderbilt Holding Co. Inc.
Qualitative and quantitative analysis of companies has been conducted to help clients understand the wider business environment as well as the strengths and weaknesses of key industry players. Data is qualitatively analyzed to categorize companies as pure play, category-focused, industry-focused, and diversified; it is quantitatively analyzed to categorize companies as dominant, leading, strong, tentative, and weak.
Recent Development and News in Metal deactivator market
- In August 2024, Innospec announced on its official website the successful certification of a new generation of metal deactivators designed specifically for use in high altitude and low temperature environments typical of modern jet travel.
- In November 2024, Lubrizol updated its online technical portfolio to include a new series of passivators specifically designed for high performance dielectric fluids and sustainable transformer oils.
- In December 2024, Songwon Industrial Group updated its specialty chemicals section to highlight its latest range of metal deactivators specifically optimized for high purity electronic grade fluids used in server cooling.
- In February 2025, Lanxess AG announced a new bio-based metal deactivator developed for biodiesel blends, designed to improve oxidative stability and support sustainability goals in renewable fuels.
- In April 2025, BASF SE completed the expansion of its metal deactivator production capacity at its Ludwigshafen site to address increasing demand from the global automotive and industrial lubricant markets.
- In May 2025, Vanderbilt Chemicals LLC released new performance data for its Biltrex series of water-soluble metal deactivators, showcasing their effectiveness in providing copper passivation for electric vehicle thermal management fluids.
- In June 2025, Clariant AG formed a strategic partnership with a major North American lubricant formulator to co-develop advanced multifunctional additive packages combining metal deactivation and corrosion inhibition for complex industrial fluids.
Dive into Technavio’s robust research methodology, blending expert interviews, extensive data synthesis, and validated models for unparalleled Metal Deactivator Market insights. See full methodology.
| Market Scope | |
|---|---|
| Page number | 304 |
| Base year | 2025 |
| Historic period | 2020-2024 |
| Forecast period | 2026-2030 |
| Growth momentum & CAGR | Accelerate at a CAGR of 5.1% |
| Market growth 2026-2030 | USD 496.5 million |
| Market structure | Fragmented |
| YoY growth 2025-2026(%) | 4.6% |
| Key countries | China, Japan, India, South Korea, Australia, Indonesia, US, Canada, Mexico, Germany, UK, France, Italy, Spain, The Netherlands, Brazil, Argentina, Colombia, Saudi Arabia, UAE, South Africa, Israel and Turkey |
| Competitive landscape | Leading Companies, Market Positioning of Companies, Competitive Strategies, and Industry Risks |
Research Analyst Overview
- The metal deactivator market is centered on the critical function of specialized chelating agents in preventing lubricant degradation and ensuring fuel stability. These additives work by neutralizing catalytic metal ions, thereby inhibiting oxidative degradation and delivering superior thermal oxidation resistance.
- This process is essential for yellow metal protection and non-ferrous metal corrosion prevention across various applications, including industrial gear oils and hydraulic fluid protection. A key industry development is the integration of these compounds as an antioxidant synergist, which significantly enhances performance.
- For boardroom consideration, the growing regulatory pressure for sustainable chemistry has made the adoption of advanced, eco-friendly formulations a strategic imperative for ESG compliance, with new additives achieving up to a 50% extension in fluid service life.
- Innovations include ashless thiadiazole chemistries for sludge formation prevention and specialized formulas for transformer oil stabilization and jet fuel thermal stability, addressing the demanding requirements of modern industrial and aerospace systems. This focus on performance and sustainability drives market evolution.
What are the Key Data Covered in this Metal Deactivator Market Research and Growth Report?
-
What is the expected growth of the Metal Deactivator Market between 2026 and 2030?
-
USD 496.5 million, at a CAGR of 5.1%
-
-
What segmentation does the market report cover?
-
The report is segmented by Formulation (Oil soluble, and Water soluble), End-user (Automotive, Industrial, Aviation, Marine, and Others), Type (Fuel additives, Lubricant additives, and Others) and Geography (APAC, North America, Europe, South America, Middle East and Africa)
-
-
Which regions are analyzed in the report?
-
APAC, North America, Europe, South America and Middle East and Africa
-
-
What are the key growth drivers and market challenges?
-
Increasing need for reliable machinery and its effective maintenance, Fluctuations in crude oil prices
-
-
Who are the major players in the Metal Deactivator Market?
-
ADEKA Corp., Afton Chemical, BASF SE, Clariant International Ltd., Dorf Ketal Chemicals Ltd., Dow Chemical Co., Eastman Chemical Co., Innospec Inc., King Industries Inc., Lanxess AG, Mayzo Inc., Metall-Chemie Holding GmbH, Reaxis Inc., Shell plc, SI Group Inc., Songwon Industrial Co. Ltd., The Lubrizol Corp. and Vanderbilt Holding Co. Inc.
-
Market Research Insights
- The metal deactivator market is shaped by a dual focus on performance enhancement and sustainability. The development of a multifunctional additive package is a key dynamic, with formulations now capable of reducing lubricant oxidation rates by over 25% while also providing corrosion inhibition. This trend simplifies blending processes for formulators and offers end-users a more comprehensive protective solution.
- Concurrently, the rise of electric vehicles is creating new demand for specialized electric vehicle coolant additives and synthetic oil stabilization. These applications require high-purity, low-conductivity deactivators to ensure system integrity.
- The adoption of biodegradable chelating agents is also accelerating, with these greener alternatives now constituting over 15% of new product developments in response to tightening environmental regulations, demonstrating a clear market shift toward high-performance, sustainable chemistry.
We can help! Our analysts can customize this metal deactivator market research report to meet your requirements.
 RIA -
RIA - 
