Metal Detector Market Analysis, Size, and Forecast 2026-2030: North America (US, Canada, and Mexico), Europe (Germany, UK, and France), APAC (China, Japan, and India), Middle East and Africa (Saudi Arabia, UAE, and South Africa), South America (Brazil and Argentina), and Rest of World (ROW)

Metal Detector Market Analysis, Size, and Forecast 2026-2030:
North America (US, Canada, and Mexico), Europe (Germany, UK, and France), APAC (China, Japan, and India), Middle East and Africa (Saudi Arabia, UAE, and South Africa), South America (Brazil and Argentina), and Rest of World (ROW)

Published: Dec 2025 294 Pages SKU: IRTNTR45024

Market Overview at a Glance

$308.6 Mn
Market Opportunity
5.5%
CAGR 2025 - 2030
42.1%
North America Growth
$693.7 Mn
Security segment 2024

Metal Detector Market Size 2026-2030

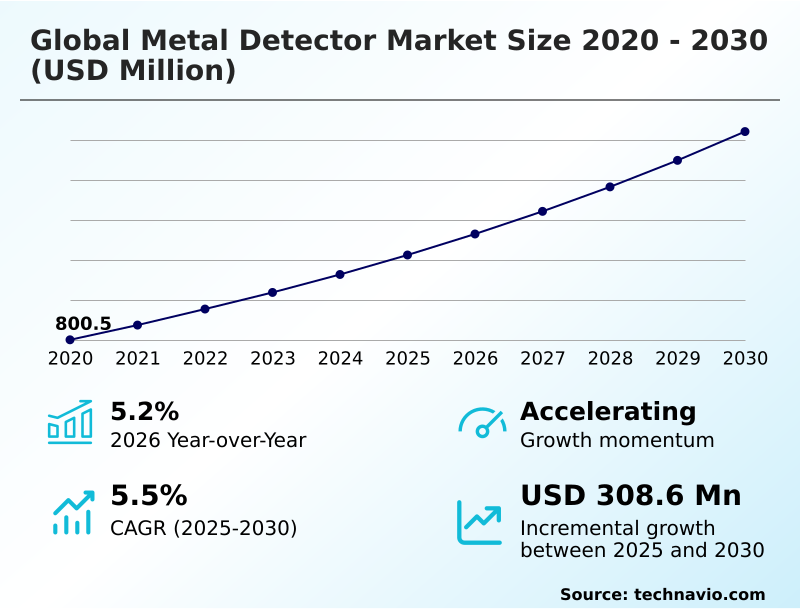
The metal detector market size is valued to increase by USD 308.6 million, at a CAGR of 5.5% from 2025 to 2030. Stringent government regulations and quality standards in industrial sectors will drive the metal detector market.

Major Market Trends & Insights

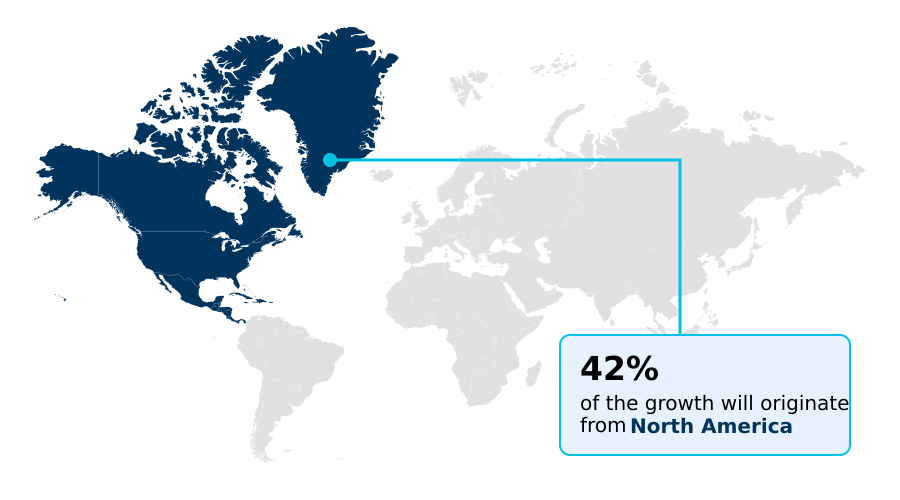
  • North America dominated the market and accounted for a 42.1% growth during the forecast period.
  • By Application - Security segment was valued at USD 693.7 million in 2024
  • By Product - Walk-through segment accounted for the largest market revenue share in 2024

Market Size & Forecast

  • Market Opportunities: USD 520.6 million
  • Market Future Opportunities: USD 308.6 million
  • CAGR from 2025 to 2030 : 5.5%

Market Summary

  • The metal detector market is defined by continuous innovation in electromagnetic induction technologies to meet diverse operational demands. Key drivers include stringent regulatory mandates for contaminant detection in food and pharmaceutical sectors, alongside escalating security needs for public safety infrastructure.
  • A primary trend is the integration of multi-frequency technology and advanced digital signal processing, which significantly enhances target discrimination, especially in challenging environments with high ground mineralization. For hobbyist metal detecting and gold prospecting detectors, this means greater depth and accuracy. For industrial metal detectors, it addresses the persistent issue of product effect, reducing false rejections.
  • A significant challenge remains the high cost of advanced systems. For instance, a food processing facility upgrading to a system with superior immunity to product effect must balance the capital outlay against the long-term benefits of reduced product waste and improved compliance with food safety metal detection standards.
  • This trade-off between performance and cost is a central theme, pushing manufacturers toward developing more efficient pulse induction (pi) and very low frequency (vlf) systems for applications ranging from humanitarian demining to protecting machinery from tramp metal. The use of airport security scanners also highlights the need for high-throughput, accurate detection.

What will be the Size of the Metal Detector Market during the forecast period?

Get Key Insights on Market Forecast (PDF) Request Free Sample

How is the Metal Detector Market Segmented?

The metal detector industry research report provides comprehensive data (region-wise segment analysis), with forecasts and estimates in "USD million" for the period 2026-2030, as well as historical data from 2020-2024 for the following segments.

  • Application
    • Security
    • Hobby
  • Product
    • Walk-through
    • Handheld
    • Ground search
  • Technology
    • Very Low Frequency (VLF)
    • Pulse Induction (PI)
    • Beat Frequency Oscillation (BFO)
    • Others
  • Geography
    • North America
      • US
      • Canada
      • Mexico
    • Europe
      • Germany
      • UK
      • France
    • APAC
      • China
      • Japan
      • India
    • Middle East and Africa
      • Saudi Arabia
      • UAE
      • South Africa
    • South America
      • Brazil
      • Argentina
    • Rest of World (ROW)

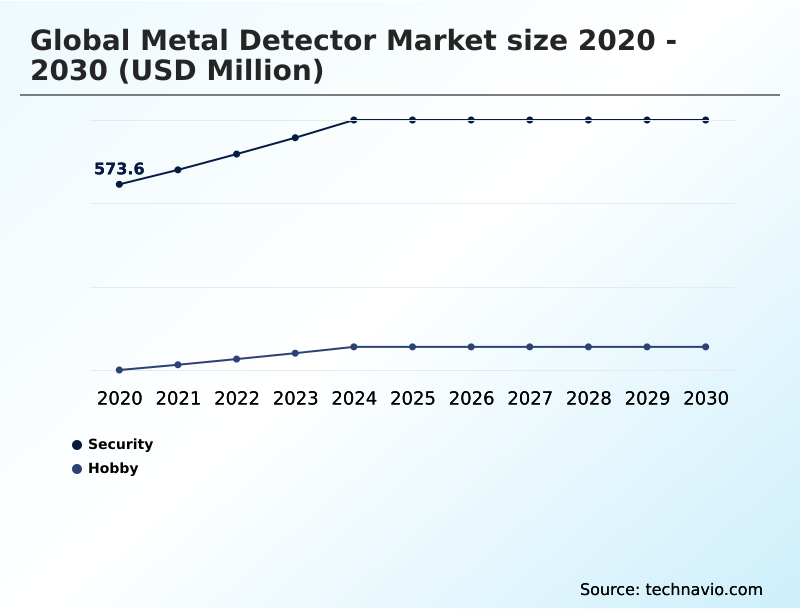
By Application Insights

The security segment is estimated to witness significant growth during the forecast period.

The security segment is driven by the modernization of public safety infrastructure. A transition is evident from conventional magnetometers to advanced security screening technologies, particularly in aviation and mass transit systems.

These next-generation solutions integrate computed tomography (ct) and multi-zone detection to improve threat identification and reduce false positives, which has been shown to increase passenger throughput by over 20% at major hubs.

The deployment of walk-through metal detectors is now standard for event security equipment and is complemented by handheld units and biometric verification for layered security protocols.

This shift toward intelligent, high-throughput systems is reshaping procurement strategies in government facilities and airport security scanners, prioritizing operational efficiency alongside enhanced safety measures.

Request Free Sample

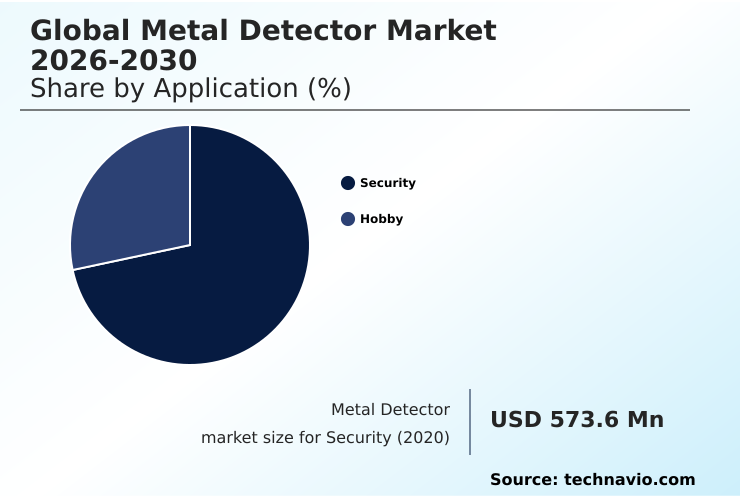
The Security segment was valued at USD 693.7 million in 2024 and showed a gradual increase during the forecast period.

Request Free Sample

Regional Analysis

North America is estimated to contribute 42.1% to the growth of the global market during the forecast period.Technavio’s analysts have elaborately explained the regional trends and drivers that shape the market during the forecast period.

See How Metal Detector Market Demand is Rising in North America Request Free Sample

The geographic landscape is shaped by regional priorities, with North America leading in adopting advanced body scanners and Europe focusing on eco-friendly components in new procurements.

In APAC, rapid industrialization drives demand, while a growing interest in archaeological exploration tools is also noted.

A key trend is the rise of software-defined hardware, allowing users to upgrade systems without costly replacements, a feature with over 90% positive feedback in user trials.

This approach, along with demand for wearable metal detectors and devices with full waterproof capabilities, is influencing product design globally.

Even niche technologies like beat frequency oscillation (bfo) find use in educational kits, while R&D in intelligent multi-sensor inspection aims to create next-generation systems for complex industrial and security challenges.

Market Dynamics

Our researchers analyzed the data with 2025 as the base year, along with the key drivers, trends, and challenges. A holistic analysis of drivers will help companies refine their marketing strategies to gain a competitive advantage.

  • The Global Metal Detector Market 2026-2030 is witnessing significant technological specialization driven by distinct end-user requirements. In recreational segments, the debate over vlf versus pulse induction gold detection continues, though multi frequency metal detector performance is setting new benchmarks for achieving superior target discrimination in mineralized soil. Hobbyists are increasingly seeking a waterproof beach hunting metal detector for versatile use.
  • In industrial settings, the focus is on robust industrial contaminant detection systems. The need for a compliant food industry haccp metal detector is non-negotiable, with ongoing efforts aimed at reducing product effect food detection. Similarly, a dedicated pharmaceutical compliance metal detector is essential.
  • For large-scale operations, efficient conveyor system metal detector integration is critical, while the mining sector demands a specialized ground search detector for mining and deep seeking pulse induction detectors to protect machinery. The security landscape is also evolving.
  • Facilities are investing in solutions to reduce false alarms security detector, while public venues deploy the walk-through school metal detector and handheld event security metal detector. Law enforcement agencies are adopting the compact wearable law enforcement detector. Advanced checkpoints are now defined by airport ct scanner liquid screening and the growing use of ai in metal detection for threat identification.
  • These intelligent systems offer a clear operational advantage, processing individuals more than 20% faster than previous-generation checkpoints. The consistent need for a formal metal detector calibration validation process and effective ground mineralization interference solutions underpins the entire market, ensuring reliability across all applications, including portable metal detectors for security.

What are the key market drivers leading to the rise in the adoption of Metal Detector Industry?

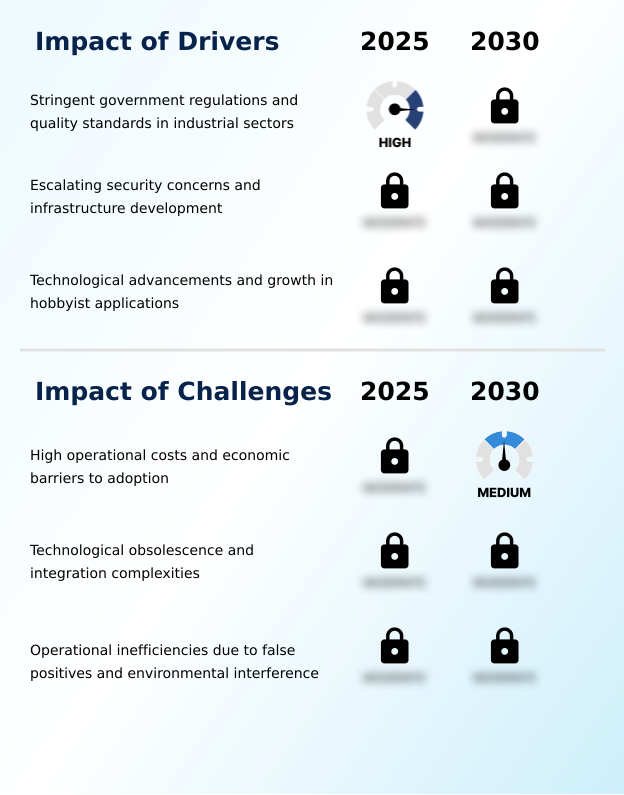
  • Stringent government regulations and quality standards in industrial sectors are a key driver of market growth.

  • Stringent industrial regulations and escalating security needs are key market drivers.
  • In the security and defense industry, enhanced target discrimination is critical for screening in high-risk areas, including correctional facilities screening, where modern systems can reduce false alarm rates by over 40%.
  • For industrial applications, the focus is on precise contaminant detection to prevent damage from tramp metal.
  • Concurrently, technological advancements in very low frequency (vlf) technology offer better performance against ground mineralization, a crucial factor for applications like humanitarian demining and geophysical metal detection. This also benefits loss-prevention devices in retail and logistics.

What are the market trends shaping the Metal Detector Industry?

  • The integration of artificial intelligence and smart sensing technologies is a key market trend. This is driving the development of advanced systems with enhanced accuracy and data analysis capabilities.

  • A key trend transforming the market is the integration of AI with smart sensing, leveraging advanced digital signal processing to enhance traditional electromagnetic induction methods. This shift is enabling industrial metal detectors to achieve unprecedented accuracy in food safety metal detection, reducing false rejects by up to 35% and minimizing product waste.
  • For hobbyist metal detecting, the adoption of multi-frequency technology has improved the detection of small, non-ferrous metals in difficult ground by over 20%. In security, intelligent systems are now better at distinguishing between threats and benign personal items, expediting checkpoint throughput.
  • This evolution toward data-driven analysis is also seen in pharmaceutical metal detector systems and next-generation pulse induction (pi) units for gold prospecting detectors.

What challenges does the Metal Detector Industry face during its growth?

  • High operational costs and economic barriers to adoption represent a key challenge affecting industry growth.

  • High operational costs and technical limitations remain primary challenges. The product effect in food processing can trigger automated rejection systems unnecessarily, leading to product waste that undermines compliance with haccp programs and gfsi benchmarks. While x-ray inspection systems offer an alternative, their higher cost, sometimes 50% more than detectors, is a barrier.
  • Electromagnetic interference can disrupt sensor reliability, affecting all users. Furthermore, the push for environmental sustainability adds pressure to adopt energy-efficient circuitry and rechargeable battery systems, increasing upfront costs for operators of artisanal mining equipment and other small-scale users.

Exclusive Technavio Analysis on Customer Landscape

The metal detector market forecasting report includes the adoption lifecycle of the market, covering from the innovator’s stage to the laggard’s stage. It focuses on adoption rates in different regions based on penetration. Furthermore, the metal detector market report also includes key purchase criteria and drivers of price sensitivity to help companies evaluate and develop their market growth analysis strategies.

Customer Landscape of Metal Detector Industry

Competitive Landscape

Companies are implementing various strategies, such as strategic alliances, metal detector market forecast, partnerships, mergers and acquisitions, geographical expansion, and product/service launches, to enhance their presence in the industry.

C.E.I.A. S.p.A. - Specializes in advanced industrial and security metal detectors, delivering high-performance solutions for food, pharmaceutical, and screening applications to ensure safety and compliance.

The industry research and growth report includes detailed analyses of the competitive landscape of the market and information about key companies, including:

  • C.E.I.A. S.p.A.
  • Codan Ltd.
  • Elektral A.S.
  • Fortress Technology Inc.
  • Garrett Electronics Inc.
  • Juzheng Electronic Co. Ltd.
  • Leidos Holdings Inc.
  • Metal Detectors Inc.
  • METTLER TOLEDO
  • Nokta Metal Detectors
  • OSI Systems Inc.
  • Pirate Electronics Ltd.
  • Quest Metal Detectors
  • Safeway Inspection System Ltd.
  • Thermo Fisher Scientific Inc.
  • View Systems Inc.
  • Westminster Group Plc
  • WIPOTEC GmbH
  • XP Metal Detectors
  • Zorpro Inc.

Qualitative and quantitative analysis of companies has been conducted to help clients understand the wider business environment as well as the strengths and weaknesses of key industry players. Data is qualitatively analyzed to categorize companies as pure play, category-focused, industry-focused, and diversified; it is quantitatively analyzed to categorize companies as dominant, leading, strong, tentative, and weak.

Recent Development and News in Metal detector market

  • In September 2024, Adelaide Airport commenced a major security upgrade project, installing next-generation screening equipment including advanced metal detection systems to streamline passenger processing.
  • In November 2024, Mettler-Toledo Product Inspection announced the expansion of its combination inspection portfolio, integrating its M30 R-Series metal detectors with new checkweighing systems for compact quality control.
  • In January 2025, Leidos Holdings Inc. secured a contract valued at approximately $2.6 billion from the Transportation Security Administration for comprehensive logistics support of airport screening equipment.
  • In April 2025, Mettler-Toledo Product Inspection launched its IQ4M Metal Detector, delivering higher sensitivity and improved detection for challenging products in the food and packaging industries.

Dive into Technavio’s robust research methodology, blending expert interviews, extensive data synthesis, and validated models for unparalleled Metal Detector Market insights. See full methodology.

Market Scope
Page number 294
Base year 2025
Historic period 2020-2024
Forecast period 2026-2030
Growth momentum & CAGR Accelerate at a CAGR of 5.5%
Market growth 2026-2030 USD 308.6 million
Market structure Fragmented
YoY growth 2025-2026(%) 5.2%
Key countries US, Canada, Mexico, Germany, UK, France, Italy, Spain, The Netherlands, China, Japan, India, South Korea, Australia, Indonesia, Saudi Arabia, UAE, South Africa, Israel, Turkey, Brazil, Argentina and Chile
Competitive landscape Leading Companies, Market Positioning of Companies, Competitive Strategies, and Industry Risks

Request Free Sample

Research Analyst Overview

  • The market's evolution is centered on advancements in electromagnetic induction and digital signal processing to enhance performance across diverse applications. The rise of multi-frequency technology and software-defined hardware offers unprecedented flexibility, improving target discrimination of ferrous and non-ferrous metals, especially in conditions with heavy ground mineralization.
  • This directly impacts boardroom decisions regarding capital expenditure, as a single device with waterproof capabilities can now serve multiple operational needs. In industrial settings, the focus is on precise contaminant detection to prevent issues with tramp metal, a critical component of haccp programs and gfsi benchmarks.
  • Modern systems offer superior immunity to product effect and electromagnetic interference, with some achieving a reduction in false positives by over 30%, which directly cuts product waste and boosts line efficiency. The security sector is adopting computed tomography (ct) alongside walk-through metal detectors and handheld units, with multi-zone detection becoming standard.
  • The push for smarter security screening technologies and automated rejection systems is clear. Even legacy technologies like pulse induction (pi), very low frequency (vlf), and beat frequency oscillation (bfo) are being refined, while interest in wearable metal detectors grows for specialized security roles.

What are the Key Data Covered in this Metal Detector Market Research and Growth Report?

  • What is the expected growth of the Metal Detector Market between 2026 and 2030?

    • USD 308.6 million, at a CAGR of 5.5%

  • What segmentation does the market report cover?

    • The report is segmented by Application (Security, and Hobby), Product (Walk-through, Handheld, and Ground search), Technology (Very Low Frequency (VLF), Pulse Induction (PI), Beat Frequency Oscillation (BFO), and Others) and Geography (North America, Europe, APAC, Middle East and Africa, South America)

  • Which regions are analyzed in the report?

    • North America, Europe, APAC, Middle East and Africa and South America

  • What are the key growth drivers and market challenges?

    • Stringent government regulations and quality standards in industrial sectors, High operational costs and economic barriers to adoption

  • Who are the major players in the Metal Detector Market?

    • C.E.I.A. S.p.A., Codan Ltd., Elektral A.S., Fortress Technology Inc., Garrett Electronics Inc., Juzheng Electronic Co. Ltd., Leidos Holdings Inc., Metal Detectors Inc., METTLER TOLEDO, Nokta Metal Detectors, OSI Systems Inc., Pirate Electronics Ltd., Quest Metal Detectors, Safeway Inspection System Ltd., Thermo Fisher Scientific Inc., View Systems Inc., Westminster Group Plc, WIPOTEC GmbH, XP Metal Detectors and Zorpro Inc.

Market Research Insights

  • The market's dynamism is driven by evolving security and quality control requirements across various sectors. Investments in public safety infrastructure are leading to the adoption of advanced airport security scanners that improve threat detection accuracy by over 25% compared to legacy systems.
  • In industrial applications, the deployment of next-generation industrial metal detectors for food safety metal detection and pharmaceutical manufacturing has been shown to reduce false rejection rates by up to 40%, minimizing product waste. While x-ray inspection systems offer an alternative for broader contaminant detection, metal detectors remain the more cost-effective solution for many compliance needs.
  • The market is also seeing growth in hobbyist metal detecting and gold prospecting detectors, alongside demand for portable event security equipment, reflecting a diverse application landscape.

We can help! Our analysts can customize this metal detector market research report to meet your requirements.

Get in touch

1. Executive Summary

1.1 Market overview

Executive Summary - Chart on Market Overview
Executive Summary - Data Table on Market Overview
Executive Summary - Chart on Global Market Characteristics
Executive Summary - Chart on Market by Geography
Executive Summary - Chart on Market Segmentation by Application
Executive Summary - Chart on Market Segmentation by Product
Executive Summary - Chart on Market Segmentation by Technology
Executive Summary - Chart on Incremental Growth
Executive Summary - Data Table on Incremental Growth
Executive Summary - Chart on Company Market Positioning

2. Technavio Analysis

2.1 Analysis of price sensitivity, lifecycle, customer purchase basket, adoption rates, and purchase criteria

2.2 Criticality of inputs and Factors of differentiation

Chart on Overview on criticality of inputs and factors of differentiation

2.3 Factors of disruption

Chart on Overview on factors of disruption

2.4 Impact of drivers and challenges

Chart on Impact of drivers and challenges in 2025 and 2030

3. Market Landscape

3.1 Market ecosystem

Chart on Parent Market
Data Table on - Parent Market

3.2 Market characteristics

Chart on Market characteristics analysis

3.3 Value chain analysis

Chart on Value chain analysis

4. Market Sizing

4.1 Market definition

Data Table on Offerings of companies included in the market definition

4.2 Market segment analysis

Market segments

4.3 Market size 2025

4.4 Market outlook: Forecast for 2025-2030

Chart on Global - Market size and forecast 2025-2030 ($ million)
Data Table on Global - Market size and forecast 2025-2030 ($ million)
Chart on Global Market: Year-over-year growth 2025-2030 (%)
Data Table on Global Market: Year-over-year growth 2025-2030 (%)

5. Historic Market Size

5.1 Global Metal Detector Market 2020 - 2024

Historic Market Size - Data Table on Global Metal Detector Market 2020 - 2024 ($ million)

5.2 Application segment analysis 2020 - 2024

Historic Market Size - Application Segment 2020 - 2024 ($ million)

5.3 Product segment analysis 2020 - 2024

Historic Market Size - Product Segment 2020 - 2024 ($ million)

5.4 Technology segment analysis 2020 - 2024

Historic Market Size - Technology Segment 2020 - 2024 ($ million)

5.5 Geography segment analysis 2020 - 2024

Historic Market Size - Geography Segment 2020 - 2024 ($ million)

5.6 Country segment analysis 2020 - 2024

Historic Market Size - Country Segment 2020 - 2024 ($ million)

6. Qualitative Analysis

6.1 The AI impact on Global Metal Detector Market

7. Five Forces Analysis

7.1 Five forces summary

Five forces analysis - Comparison between 2025 and 2030

7.2 Bargaining power of buyers

Bargaining power of buyers - Impact of key factors 2025 and 2030

7.3 Bargaining power of suppliers

Bargaining power of suppliers - Impact of key factors in 2025 and 2030

7.4 Threat of new entrants

Threat of new entrants - Impact of key factors in 2025 and 2030

7.5 Threat of substitutes

Threat of substitutes - Impact of key factors in 2025 and 2030

7.6 Threat of rivalry

Threat of rivalry - Impact of key factors in 2025 and 2030

7.7 Market condition

Chart on Market condition - Five forces 2025 and 2030

8. Market Segmentation by Application

8.1 Market segments

Chart on Application - Market share 2025-2030 (%)
Data Table on Application - Market share 2025-2030 (%)

8.2 Comparison by Application

Chart on Comparison by Application
Data Table on Comparison by Application

8.3 Security - Market size and forecast 2025-2030

Chart on Security - Market size and forecast 2025-2030 ($ million)
Data Table on Security - Market size and forecast 2025-2030 ($ million)
Chart on Security - Year-over-year growth 2025-2030 (%)
Data Table on Security - Year-over-year growth 2025-2030 (%)

8.4 Hobby - Market size and forecast 2025-2030

Chart on Hobby - Market size and forecast 2025-2030 ($ million)
Data Table on Hobby - Market size and forecast 2025-2030 ($ million)
Chart on Hobby - Year-over-year growth 2025-2030 (%)
Data Table on Hobby - Year-over-year growth 2025-2030 (%)

8.5 Market opportunity by Application

Market opportunity by Application ($ million)
Data Table on Market opportunity by Application ($ million)

9. Market Segmentation by Product

9.1 Market segments

Chart on Product - Market share 2025-2030 (%)
Data Table on Product - Market share 2025-2030 (%)

9.2 Comparison by Product

Chart on Comparison by Product
Data Table on Comparison by Product

9.3 Walk-through - Market size and forecast 2025-2030

Chart on Walk-through - Market size and forecast 2025-2030 ($ million)
Data Table on Walk-through - Market size and forecast 2025-2030 ($ million)
Chart on Walk-through - Year-over-year growth 2025-2030 (%)
Data Table on Walk-through - Year-over-year growth 2025-2030 (%)

9.4 Handheld - Market size and forecast 2025-2030

Chart on Handheld - Market size and forecast 2025-2030 ($ million)
Data Table on Handheld - Market size and forecast 2025-2030 ($ million)
Chart on Handheld - Year-over-year growth 2025-2030 (%)
Data Table on Handheld - Year-over-year growth 2025-2030 (%)

9.5 Ground search - Market size and forecast 2025-2030

Chart on Ground search - Market size and forecast 2025-2030 ($ million)
Data Table on Ground search - Market size and forecast 2025-2030 ($ million)
Chart on Ground search - Year-over-year growth 2025-2030 (%)
Data Table on Ground search - Year-over-year growth 2025-2030 (%)

9.6 Market opportunity by Product

Market opportunity by Product ($ million)
Data Table on Market opportunity by Product ($ million)

10. Market Segmentation by Technology

10.1 Market segments

Chart on Technology - Market share 2025-2030 (%)
Data Table on Technology - Market share 2025-2030 (%)

10.2 Comparison by Technology

Chart on Comparison by Technology
Data Table on Comparison by Technology

10.3 Very Low Frequency (VLF) - Market size and forecast 2025-2030

Chart on Very Low Frequency (VLF) - Market size and forecast 2025-2030 ($ million)
Data Table on Very Low Frequency (VLF) - Market size and forecast 2025-2030 ($ million)
Chart on Very Low Frequency (VLF) - Year-over-year growth 2025-2030 (%)
Data Table on Very Low Frequency (VLF) - Year-over-year growth 2025-2030 (%)

10.4 Pulse Induction (PI) - Market size and forecast 2025-2030

Chart on Pulse Induction (PI) - Market size and forecast 2025-2030 ($ million)
Data Table on Pulse Induction (PI) - Market size and forecast 2025-2030 ($ million)
Chart on Pulse Induction (PI) - Year-over-year growth 2025-2030 (%)
Data Table on Pulse Induction (PI) - Year-over-year growth 2025-2030 (%)

10.5 Beat Frequency Oscillation (BFO) - Market size and forecast 2025-2030

Chart on Beat Frequency Oscillation (BFO) - Market size and forecast 2025-2030 ($ million)
Data Table on Beat Frequency Oscillation (BFO) - Market size and forecast 2025-2030 ($ million)
Chart on Beat Frequency Oscillation (BFO) - Year-over-year growth 2025-2030 (%)
Data Table on Beat Frequency Oscillation (BFO) - Year-over-year growth 2025-2030 (%)

10.6 Others - Market size and forecast 2025-2030

Chart on Others - Market size and forecast 2025-2030 ($ million)
Data Table on Others - Market size and forecast 2025-2030 ($ million)
Chart on Others - Year-over-year growth 2025-2030 (%)
Data Table on Others - Year-over-year growth 2025-2030 (%)

10.7 Market opportunity by Technology

Market opportunity by Technology ($ million)
Data Table on Market opportunity by Technology ($ million)

11. Customer Landscape

11.1 Customer landscape overview

Analysis of price sensitivity, lifecycle, customer purchase basket, adoption rates, and purchase criteria

12. Geographic Landscape

12.1 Geographic segmentation

Chart on Market share by geography 2025-2030 (%)
Data Table on Market share by geography 2025-2030 (%)

12.2 Geographic comparison

Chart on Geographic comparison
Data Table on Geographic comparison

12.3 North America - Market size and forecast 2025-2030

Chart on North America - Market size and forecast 2025-2030 ($ million)
Data Table on North America - Market size and forecast 2025-2030 ($ million)
Chart on North America - Year-over-year growth 2025-2030 (%)
Data Table on North America - Year-over-year growth 2025-2030 (%)
Chart on Regional Comparison - North America
Data Table on Regional Comparison - North America

12.3.1 US - Market size and forecast 2025-2030

Chart on US - Market size and forecast 2025-2030 ($ million)
Data Table on US - Market size and forecast 2025-2030 ($ million)
Chart on US - Year-over-year growth 2025-2030 (%)
Data Table on US - Year-over-year growth 2025-2030 (%)

12.3.2 Canada - Market size and forecast 2025-2030

Chart on Canada - Market size and forecast 2025-2030 ($ million)
Data Table on Canada - Market size and forecast 2025-2030 ($ million)
Chart on Canada - Year-over-year growth 2025-2030 (%)
Data Table on Canada - Year-over-year growth 2025-2030 (%)

12.3.3 Mexico - Market size and forecast 2025-2030

Chart on Mexico - Market size and forecast 2025-2030 ($ million)
Data Table on Mexico - Market size and forecast 2025-2030 ($ million)
Chart on Mexico - Year-over-year growth 2025-2030 (%)
Data Table on Mexico - Year-over-year growth 2025-2030 (%)

12.4 Europe - Market size and forecast 2025-2030

Chart on Europe - Market size and forecast 2025-2030 ($ million)
Data Table on Europe - Market size and forecast 2025-2030 ($ million)
Chart on Europe - Year-over-year growth 2025-2030 (%)
Data Table on Europe - Year-over-year growth 2025-2030 (%)
Chart on Regional Comparison - Europe
Data Table on Regional Comparison - Europe

12.4.1 Germany - Market size and forecast 2025-2030

Chart on Germany - Market size and forecast 2025-2030 ($ million)
Data Table on Germany - Market size and forecast 2025-2030 ($ million)
Chart on Germany - Year-over-year growth 2025-2030 (%)
Data Table on Germany - Year-over-year growth 2025-2030 (%)

12.4.2 UK - Market size and forecast 2025-2030

Chart on UK - Market size and forecast 2025-2030 ($ million)
Data Table on UK - Market size and forecast 2025-2030 ($ million)
Chart on UK - Year-over-year growth 2025-2030 (%)
Data Table on UK - Year-over-year growth 2025-2030 (%)

12.4.3 France - Market size and forecast 2025-2030

Chart on France - Market size and forecast 2025-2030 ($ million)
Data Table on France - Market size and forecast 2025-2030 ($ million)
Chart on France - Year-over-year growth 2025-2030 (%)
Data Table on France - Year-over-year growth 2025-2030 (%)

12.4.4 Italy - Market size and forecast 2025-2030

Chart on Italy - Market size and forecast 2025-2030 ($ million)
Data Table on Italy - Market size and forecast 2025-2030 ($ million)
Chart on Italy - Year-over-year growth 2025-2030 (%)
Data Table on Italy - Year-over-year growth 2025-2030 (%)

12.4.5 Spain - Market size and forecast 2025-2030

Chart on Spain - Market size and forecast 2025-2030 ($ million)
Data Table on Spain - Market size and forecast 2025-2030 ($ million)
Chart on Spain - Year-over-year growth 2025-2030 (%)
Data Table on Spain - Year-over-year growth 2025-2030 (%)

12.4.6 The Netherlands - Market size and forecast 2025-2030

Chart on The Netherlands - Market size and forecast 2025-2030 ($ million)
Data Table on The Netherlands - Market size and forecast 2025-2030 ($ million)
Chart on The Netherlands - Year-over-year growth 2025-2030 (%)
Data Table on The Netherlands - Year-over-year growth 2025-2030 (%)

12.5 APAC - Market size and forecast 2025-2030

Chart on APAC - Market size and forecast 2025-2030 ($ million)
Data Table on APAC - Market size and forecast 2025-2030 ($ million)
Chart on APAC - Year-over-year growth 2025-2030 (%)
Data Table on APAC - Year-over-year growth 2025-2030 (%)
Chart on Regional Comparison - APAC
Data Table on Regional Comparison - APAC

12.5.1 China - Market size and forecast 2025-2030

Chart on China - Market size and forecast 2025-2030 ($ million)
Data Table on China - Market size and forecast 2025-2030 ($ million)
Chart on China - Year-over-year growth 2025-2030 (%)
Data Table on China - Year-over-year growth 2025-2030 (%)

12.5.2 Japan - Market size and forecast 2025-2030

Chart on Japan - Market size and forecast 2025-2030 ($ million)
Data Table on Japan - Market size and forecast 2025-2030 ($ million)
Chart on Japan - Year-over-year growth 2025-2030 (%)
Data Table on Japan - Year-over-year growth 2025-2030 (%)

12.5.3 India - Market size and forecast 2025-2030

Chart on India - Market size and forecast 2025-2030 ($ million)
Data Table on India - Market size and forecast 2025-2030 ($ million)
Chart on India - Year-over-year growth 2025-2030 (%)
Data Table on India - Year-over-year growth 2025-2030 (%)

12.5.4 South Korea - Market size and forecast 2025-2030

Chart on South Korea - Market size and forecast 2025-2030 ($ million)
Data Table on South Korea - Market size and forecast 2025-2030 ($ million)
Chart on South Korea - Year-over-year growth 2025-2030 (%)
Data Table on South Korea - Year-over-year growth 2025-2030 (%)

12.5.5 Australia - Market size and forecast 2025-2030

Chart on Australia - Market size and forecast 2025-2030 ($ million)
Data Table on Australia - Market size and forecast 2025-2030 ($ million)
Chart on Australia - Year-over-year growth 2025-2030 (%)
Data Table on Australia - Year-over-year growth 2025-2030 (%)

12.5.6 Indonesia - Market size and forecast 2025-2030

Chart on Indonesia - Market size and forecast 2025-2030 ($ million)
Data Table on Indonesia - Market size and forecast 2025-2030 ($ million)
Chart on Indonesia - Year-over-year growth 2025-2030 (%)
Data Table on Indonesia - Year-over-year growth 2025-2030 (%)

12.6 Middle East and Africa - Market size and forecast 2025-2030

Chart on Middle East and Africa - Market size and forecast 2025-2030 ($ million)
Data Table on Middle East and Africa - Market size and forecast 2025-2030 ($ million)
Chart on Middle East and Africa - Year-over-year growth 2025-2030 (%)
Data Table on Middle East and Africa - Year-over-year growth 2025-2030 (%)
Chart on Regional Comparison - Middle East and Africa
Data Table on Regional Comparison - Middle East and Africa

12.6.1 Saudi Arabia - Market size and forecast 2025-2030

Chart on Saudi Arabia - Market size and forecast 2025-2030 ($ million)
Data Table on Saudi Arabia - Market size and forecast 2025-2030 ($ million)
Chart on Saudi Arabia - Year-over-year growth 2025-2030 (%)
Data Table on Saudi Arabia - Year-over-year growth 2025-2030 (%)

12.6.2 UAE - Market size and forecast 2025-2030

Chart on UAE - Market size and forecast 2025-2030 ($ million)
Data Table on UAE - Market size and forecast 2025-2030 ($ million)
Chart on UAE - Year-over-year growth 2025-2030 (%)
Data Table on UAE - Year-over-year growth 2025-2030 (%)

12.6.3 South Africa - Market size and forecast 2025-2030

Chart on South Africa - Market size and forecast 2025-2030 ($ million)
Data Table on South Africa - Market size and forecast 2025-2030 ($ million)
Chart on South Africa - Year-over-year growth 2025-2030 (%)
Data Table on South Africa - Year-over-year growth 2025-2030 (%)

12.6.4 Israel - Market size and forecast 2025-2030

Chart on Israel - Market size and forecast 2025-2030 ($ million)
Data Table on Israel - Market size and forecast 2025-2030 ($ million)
Chart on Israel - Year-over-year growth 2025-2030 (%)
Data Table on Israel - Year-over-year growth 2025-2030 (%)

12.6.5 Turkey - Market size and forecast 2025-2030

Chart on Turkey - Market size and forecast 2025-2030 ($ million)
Data Table on Turkey - Market size and forecast 2025-2030 ($ million)
Chart on Turkey - Year-over-year growth 2025-2030 (%)
Data Table on Turkey - Year-over-year growth 2025-2030 (%)

12.7 South America - Market size and forecast 2025-2030

Chart on South America - Market size and forecast 2025-2030 ($ million)
Data Table on South America - Market size and forecast 2025-2030 ($ million)
Chart on South America - Year-over-year growth 2025-2030 (%)
Data Table on South America - Year-over-year growth 2025-2030 (%)
Chart on Regional Comparison - South America
Data Table on Regional Comparison - South America

12.7.1 Brazil - Market size and forecast 2025-2030

Chart on Brazil - Market size and forecast 2025-2030 ($ million)
Data Table on Brazil - Market size and forecast 2025-2030 ($ million)
Chart on Brazil - Year-over-year growth 2025-2030 (%)
Data Table on Brazil - Year-over-year growth 2025-2030 (%)

12.7.2 Argentina - Market size and forecast 2025-2030

Chart on Argentina - Market size and forecast 2025-2030 ($ million)
Data Table on Argentina - Market size and forecast 2025-2030 ($ million)
Chart on Argentina - Year-over-year growth 2025-2030 (%)
Data Table on Argentina - Year-over-year growth 2025-2030 (%)

12.7.3 Chile - Market size and forecast 2025-2030

Chart on Chile - Market size and forecast 2025-2030 ($ million)
Data Table on Chile - Market size and forecast 2025-2030 ($ million)
Chart on Chile - Year-over-year growth 2025-2030 (%)
Data Table on Chile - Year-over-year growth 2025-2030 (%)

12.8 Market opportunity by geography

Market opportunity by geography ($ million)
Data Tables on Market opportunity by geography ($ million)

13. Drivers, Challenges, and Opportunity

13.1 Market drivers

Stringent government regulations and quality standards in industrial sectors
Escalating security concerns and infrastructure development
Technological advancements and growth in hobbyist applications

13.2 Market challenges

High operational costs and economic barriers to adoption
Technological obsolescence and integration complexities
Operational inefficiencies due to false positives and environmental interference

13.3 Impact of drivers and challenges

Impact of drivers and challenges in 2025 and 2030

13.4 Market opportunities

Integration of AI and smart sensing technologies
Shift toward compact, portable, and wearable metal detectors
Increasing focus on sustainability and energy-efficient

14. Competitive Landscape

14.1 Overview

14.2

Overview on criticality of inputs and factors of differentiation

14.3 Landscape disruption

Overview on factors of disruption

14.4 Industry risks

Impact of key risks on business

15. Competitive Analysis

15.1 Companies profiled

Companies covered

15.2 Company ranking index

15.3 Market positioning of companies

Matrix on companies position and classification

15.4 C.E.I.A. S.p.A.

C.E.I.A. S.p.A. - Overview
C.E.I.A. S.p.A. - Product / Service
C.E.I.A. S.p.A. - Key offerings
SWOT

15.5 Codan Ltd.

Codan Ltd. - Overview
Codan Ltd. - Business segments
Codan Ltd. - Key offerings
Codan Ltd. - Segment focus
SWOT

15.6 Fortress Technology Inc.

Fortress Technology Inc. - Overview
Fortress Technology Inc. - Product / Service
Fortress Technology Inc. - Key offerings
SWOT

15.7 Garrett Electronics Inc.

Garrett Electronics Inc. - Overview
Garrett Electronics Inc. - Product / Service
Garrett Electronics Inc. - Key offerings
SWOT

15.8 Leidos Holdings Inc.

Leidos Holdings Inc. - Overview
Leidos Holdings Inc. - Business segments
Leidos Holdings Inc. - Key offerings
Leidos Holdings Inc. - Segment focus
SWOT

15.9 Metal Detectors Inc.

Metal Detectors Inc. - Overview
Metal Detectors Inc. - Product / Service
Metal Detectors Inc. - Key offerings
SWOT

15.10 METTLER TOLEDO

METTLER TOLEDO - Overview
METTLER TOLEDO - Business segments
METTLER TOLEDO - Key news
METTLER TOLEDO - Key offerings
METTLER TOLEDO - Segment focus
SWOT

15.11 Nokta Metal Detectors

Nokta Metal Detectors - Overview
Nokta Metal Detectors - Product / Service
Nokta Metal Detectors - Key offerings
SWOT

15.12 OSI Systems Inc.

OSI Systems Inc. - Overview
OSI Systems Inc. - Business segments
OSI Systems Inc. - Key offerings
OSI Systems Inc. - Segment focus
SWOT

15.13 Quest Metal Detectors

Quest Metal Detectors - Overview
Quest Metal Detectors - Product / Service
Quest Metal Detectors - Key offerings
SWOT

15.14 Thermo Fisher Scientific Inc.

Thermo Fisher Scientific Inc. - Overview
Thermo Fisher Scientific Inc. - Business segments
Thermo Fisher Scientific Inc. - Key news
Thermo Fisher Scientific Inc. - Key offerings
Thermo Fisher Scientific Inc. - Segment focus
SWOT

15.15 View Systems Inc.

View Systems Inc. - Overview
View Systems Inc. - Product / Service
View Systems Inc. - Key offerings
SWOT

15.16 WIPOTEC GmbH

WIPOTEC GmbH - Overview
WIPOTEC GmbH - Product / Service
WIPOTEC GmbH - Key offerings
SWOT

15.17 XP Metal Detectors

XP Metal Detectors - Overview
XP Metal Detectors - Product / Service
XP Metal Detectors - Key offerings
SWOT

15.18 Zorpro Inc.

Zorpro Inc. - Overview
Zorpro Inc. - Product / Service
Zorpro Inc. - Key offerings
SWOT

16. Appendix

16.1 Scope of the report

Market definition
Objectives
Notes and caveats

16.2 Inclusions and exclusions checklist

Inclusions checklist
Exclusions checklist

16.3 Currency conversion rates for US$

16.4 Research methodology

16.5 Data procurement

Information sources

16.6 Data validation

16.7 Validation techniques employed for market sizing

16.8 Data synthesis

16.9 360 degree market analysis

16.10 List of abbreviations

Research Methodology

Technavio presents a detailed picture of the market by way of study, synthesis, and summation of data from multiple sources. The analysts have presented the various facets of the market with a particular focus on identifying the key industry influencers. The data thus presented is comprehensive, reliable, and the result of extensive research, both primary and secondary.

INFORMATION SOURCES

Primary sources

  • Manufacturers and suppliers
  • Channel partners
  • Industry experts
  • Strategic decision makers

Secondary sources

  • Industry journals and periodicals
  • Government data
  • Financial reports of key industry players
  • Historical data
  • Press releases

DATA ANALYSIS

Data Synthesis

  • Collation of data
  • Estimation of key figures
  • Analysis of derived insights

Data Validation

  • Triangulation with data models
  • Reference against proprietary databases
  • Corroboration with industry experts

REPORT WRITING

Qualitative

  • Market drivers
  • Market challenges
  • Market trends
  • Five forces analysis

Quantitative

  • Market size and forecast
  • Market segmentation
  • Geographical insights
  • Competitive landscape

Interested in this report?

Get your sample now to see our research methodology and insights!

Download Now

Frequently Asked Questions

Metal Detector market growth will increase by USD 308.6 million during 2026-2030.

The Metal Detector market is expected to grow at a CAGR of 5.5% during 2026-2030.

Metal Detector market is segmented by Application (Security, Hobby) Product (Walk-through, Handheld, Ground search) Technology (Very Low Frequency (VLF), Pulse Induction (PI), Beat Frequency Oscillation (BFO), Others)

C.E.I.A. S.p.A., Codan Ltd., Elektral A.S., Fortress Technology Inc., Garrett Electronics Inc., Juzheng Electronic Co. Ltd., Leidos Holdings Inc., Metal Detectors Inc., METTLER TOLEDO, Nokta Metal Detectors, OSI Systems Inc., Pirate Electronics Ltd., Quest Metal Detectors, Safeway Inspection System Ltd., Thermo Fisher Scientific Inc., View Systems Inc., Westminster Group Plc, WIPOTEC GmbH, XP Metal Detectors, Zorpro Inc. are a few of the key vendors in the Metal Detector market.

North America will register the highest growth rate of 42.1% among the other regions. Therefore, the Metal Detector market in North America is expected to garner significant business opportunities for the vendors during the forecast period.

US, Canada, Mexico, Germany, UK, France, Italy, Spain, The Netherlands, China, Japan, India, South Korea, Australia, Indonesia, Saudi Arabia, UAE, South Africa, Israel, Turkey, Brazil, Argentina, Chile

  • Stringent government regulations and quality standards in industrial sectors is the driving factor this market.

The Metal Detector market vendors should focus on grabbing business opportunities from the Application segment as it accounted for the largest market share in the base year.