
Residential Real Estate Market Size 2025-2029
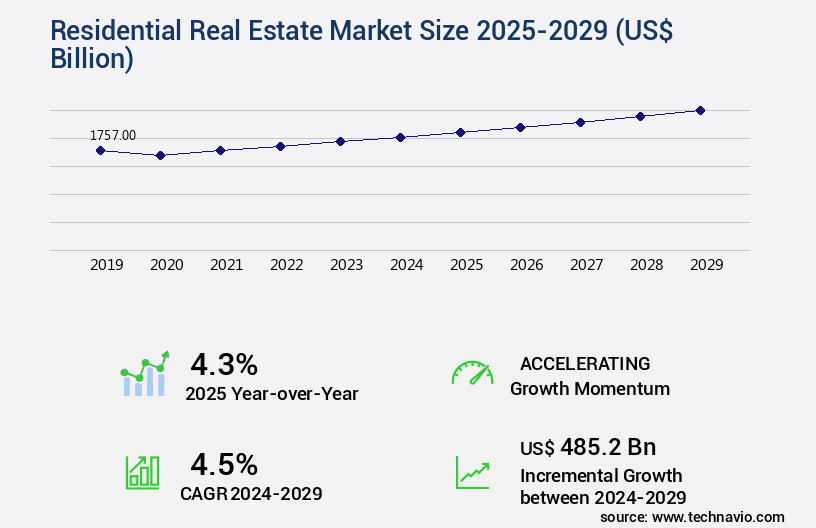
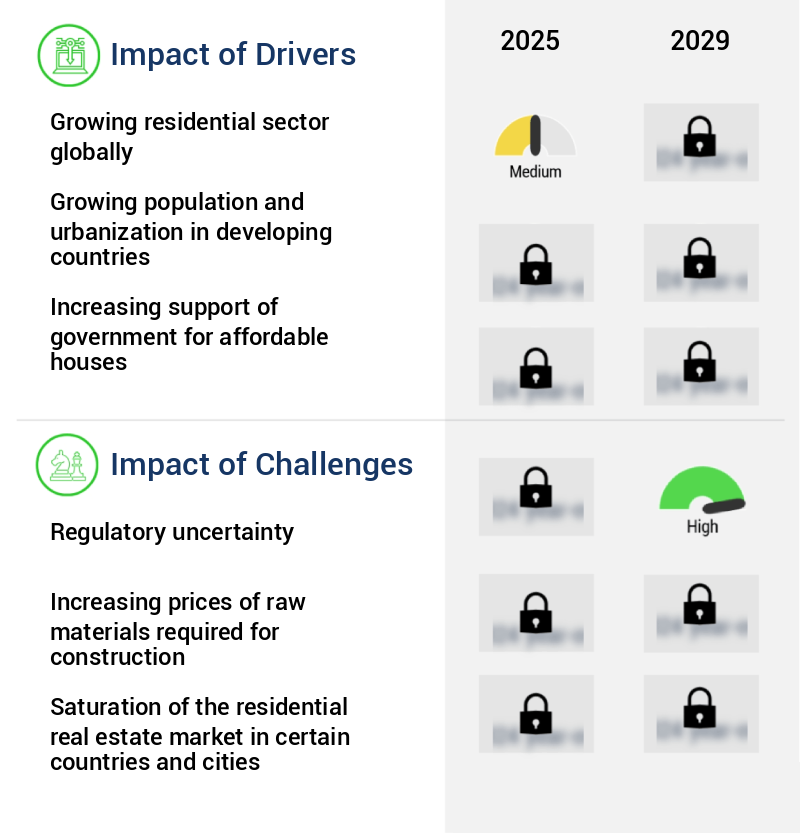
The residential real estate market size is valued to increase USD 485.2 billion, at a CAGR of 4.5% from 2024 to 2029. Growing residential sector globally will drive the residential real estate market.
Major Market Trends & Insights
- APAC dominated the market and accounted for a 55% growth during the forecast period.
- By Mode Of Booking - Sales segment was valued at USD 926.50 billion in 2023
- By Type - Apartments and condominiums segment accounted for the largest market revenue share in 2023
Market Size & Forecast
- Market Opportunities: USD 41.01 billion
- Market Future Opportunities: USD 485.20 billion
- CAGR : 4.5%
- APAC: Largest market in 2023
Market Summary
- The market is a dynamic and ever-evolving sector that continues to shape the global economy. With increasing marketing initiatives and the growing residential sector globally, the market presents significant opportunities for growth. However, regulatory uncertainty looms large, posing challenges for stakeholders. According to recent reports, technology adoption in residential real estate has surged, with virtual tours and digital listings becoming increasingly popular. In fact, over 40% of homebuyers in the US prefer virtual property viewings. Core technologies such as artificial intelligence and blockchain are revolutionizing the industry, offering enhanced customer experiences and streamlined processes.
- Despite these advancements, regulatory compliance remains a major concern, with varying regulations across regions adding complexity to market operations. The market is a complex and intriguing space, with ongoing activities and evolving patterns shaping its future trajectory.
What will be the Size of the Residential Real Estate Market during the forecast period?
Get Key Insights on Market Forecast (PDF) Request Free Sample
How is the Residential Real Estate Market Segmented and what are the key trends of market segmentation?
The residential real estate industry research report provides comprehensive data (region-wise segment analysis), with forecasts and estimates in "USD billion" for the period 2025-2029, as well as historical data from 2019-2023 for the following segments.
- Mode Of Booking
- Sales
- Rental or lease
- Type
- Apartments and condominiums
- Landed houses and villas
- Location
- Urban
- Suburban
- Rural
- End-user
- Mid-range housing
- Affordable housing
- Luxury housing
- Geography
- North America
- US
- Canada
- Mexico
- Europe
- France
- Germany
- UK
- APAC
- Australia
- Japan
- South Korea
- South America
- Brazil
- Rest of World (ROW)
- North America
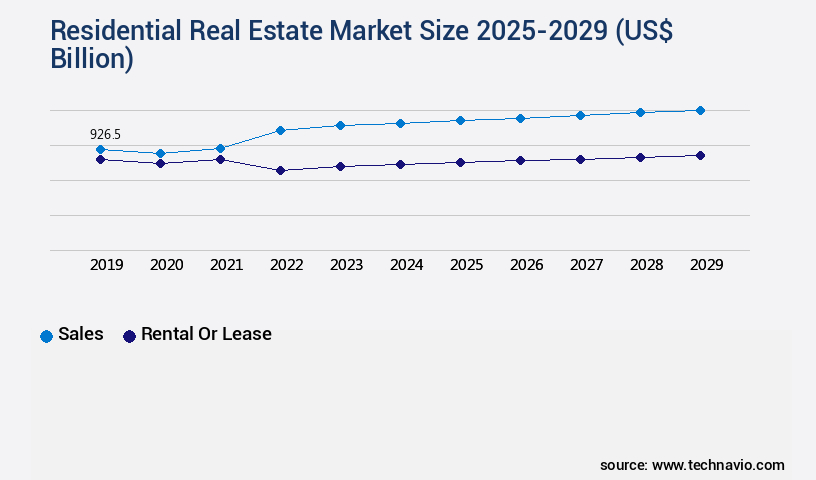
By Mode Of Booking Insights
The sales segment is estimated to witness significant growth during the forecast period.
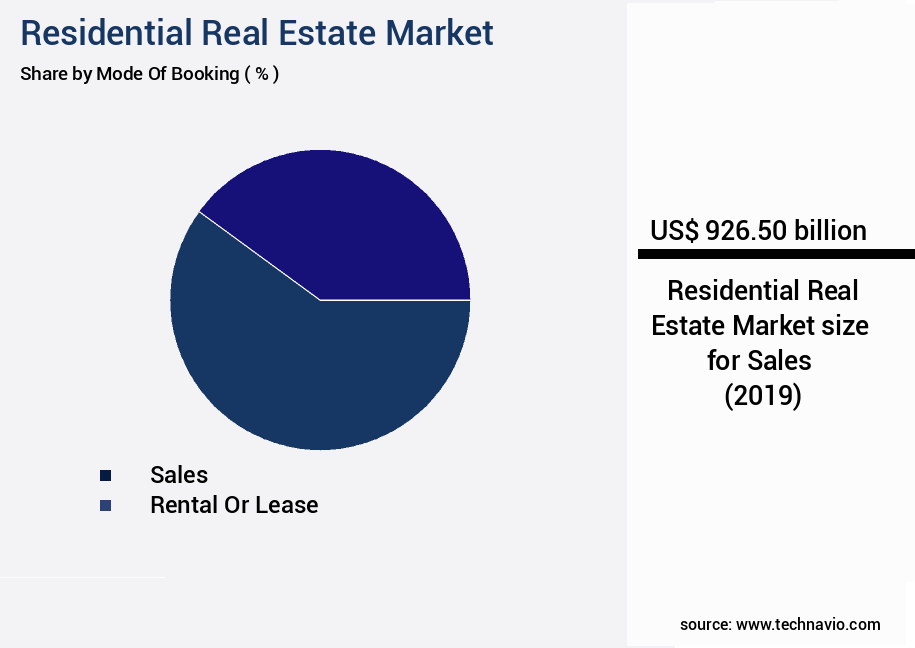
The Sales segment was valued at USD 926.50 billion in 2019 and showed a gradual increase during the forecast period.
Regional Analysis
APAC is estimated to contribute 55% to the growth of the global market during the forecast period.Technavio's analysts have elaborately explained the regional trends and drivers that shape the market during the forecast period.

See How Residential Real Estate Market Demand is Rising in APAC Request Free Sample
The market in the Asia Pacific (APAC) region holds a significant share and is projected to lead the global market growth. Factors fueling this expansion include the region's rapid urbanization and increasing consumer spending power. Notably, residential and commercial projects in countries like India and China are experiencing robust development. The residential real estate sector in China plays a pivotal role in the economy and serves as a major growth driver for the market.
With these trends continuing, the APAC the market is poised for continued expansion during the forecast period.
Market Dynamics
Our researchers analyzed the data with 2024 as the base year, along with the key drivers, trends, and challenges. A holistic analysis of drivers will help companies refine their marketing strategies to gain a competitive advantage.
In the Residential Real Estate Market, understanding the impact property tax rates home values and effect interest rates mortgage affordability is essential for buyers and investors. Key factors affecting home price appreciation and factors influencing housing affordability shape market trends, while the importance property due diligence process and requirements environmental site assessment ensure informed decisions. Investors benefit from methods calculating rental property roi, process home equity loan application, and benefits real estate portfolio diversification. Tools like property management software efficiency and techniques effective property marketing help tackle challenges managing rental properties. Additionally, strategies successful property renovation, components construction project budget, and benefits smart home technology integration enhance value. Following steps successful property tax appeal, elements effective lease agreement, and criteria tenant screening process supports sustainable investments and growth.
The market is a dynamic and intricate ecosystem that influences home values significantly, with various factors shaping its growth and trends. Property tax rates, a critical determinant, impact home values differently across regions. For instance, areas with higher tax rates may experience slower home price appreciation compared to those with more favorable tax structures. Interest rates and mortgage affordability also play a pivotal role in the market. When mortgage rates decrease, affordability increases, leading to heightened demand for homes and subsequent price growth. Conversely, higher interest rates can dampen demand and cause home values to stagnate or decline.
Property management software efficiency is another essential factor, as it enhances the operational efficiency of rental properties. This, in turn, can lead to increased profitability and higher demand for rental properties. The process of obtaining building permits and environmental site assessments can significantly impact the construction of new homes and the expansion of existing properties. Strict regulations and lengthy approval processes can hinder growth in some areas, while streamlined procedures can foster development in others. Successful property tax appeals, effective lease agreements, and thorough property due diligence processes are crucial elements of a profitable real estate investment. The importance of tenant screening, home equity loan applications, and real estate portfolio diversification cannot be overstated.
Construction project budgets require careful planning and execution, with components such as labor, materials, and permits carefully considered. Successful property renovation strategies and effective property marketing techniques are essential for maximizing returns on investment. The aspects of successful property investment extend beyond these factors, with challenges such as managing rental properties, maintaining affordability, and integrating smart home technology also playing significant roles. Adoption rates of smart home technology integration in residential real estate are notably higher in developed regions compared to emerging markets, with more than 70% of new constructions in developed regions incorporating these features. This disparity highlights the varying priorities and market dynamics across regions.
What are the key market drivers leading to the rise in the adoption of Residential Real Estate Industry?
- The global residential sector's growth serves as the primary catalyst for market expansion.
- The residential construction market is experiencing a significant surge due to the increasing number of residential buildings worldwide. This trend is driven by urbanization and the rising standard of living in emerging economies like India, China, Thailand, Malaysia, and Indonesia. The residential sector is witnessing substantial growth, with the construction of various types of dwellings, including single-family homes, condos, cooperatives, duplexes, townhouses, and multifamily residences. Moreover, the concept of integrated living is gaining popularity, with home buyers investing in residential projects that offer modern facilities.
- These projects include shopping malls with multiplexes, schools, hospitals, leisure clubs, office blocks, and parks. Homebuyers are now seeking self-sufficient and secure living environments, leading to a shift towards residential projects with comprehensive amenities. The residential construction industry's continuous evolution and its applications across various sectors underscore its importance and potential for future growth.
What are the market trends shaping the Residential Real Estate Industry?
- Marketing initiatives are increasingly becoming more prevalent in the business world. This trend signifies a significant focus on promoting products and services to expand customer bases.
- In the dynamic the market, companies employ integrated marketing communication strategies to boost sales and brand visibility. They utilize various channels, including newspapers, magazines, and social media, to showcase their offerings. Television advertisements serve as a foundation, followed by internet pre-roll, social media, and blogging initiatives. This multi-pronged approach enhances brand authenticity and recognition, piquing consumer interest. Social media, a crucial component, fosters customer engagement and cultivates online brand communities through visually appealing content.
- The creative application of this strategy not only broadens reach but also adapts to the evolving market landscape.
What challenges does the Residential Real Estate Industry face during its growth?
- Regulatory uncertainty poses a significant challenge to the industry's growth trajectory, as businesses operate in an environment where clear guidelines and regulations are essential for strategic planning and execution.
- Real estate companies face a complex regulatory landscape, with shifting requirements and standards posing challenges to development projects and property management. The lack of clarity, durability, predictability, and stability in regulations at federal, state, and local levels can add significant cost, time, risk, and uncertainty to real estate operations. Moreover, the global trend towards stricter environmental, social, and government (ESG) regulations is gaining momentum. According to various reports, the number of governments passing ESG-related rules and laws is on the rise.
- This trend is expected to continue, with real estate assets increasingly being required to meet stringent performance and disclosure standards. These regulatory shifts can significantly impact real estate companies' bottom lines and operational efficiency. It is crucial for real estate professionals to stay informed of these developments and adapt their strategies accordingly to ensure regulatory compliance and long-term success.
Exclusive Technavio Analysis on Customer Landscape
The residential real estate market forecasting report includes the adoption lifecycle of the market, covering from the innovator's stage to the laggard's stage. It focuses on adoption rates in different regions based on penetration. Furthermore, the residential real estate market report also includes key purchase criteria and drivers of price sensitivity to help companies evaluate and develop their market growth analysis strategies.

Customer Landscape of Residential Real Estate Industry
Competitive Landscape
Companies are implementing various strategies, such as strategic alliances, residential real estate market forecast, partnerships, mergers and acquisitions, geographical expansion, and product/service launches, to enhance their presence in the industry.
Al Habtoor Group LLC - This company specializes in the development and sale of high-end residential properties, including luxury buildings, polo resort and clubhouses, towers, and villages. Their offerings cater to discerning buyers seeking premier living experiences.
The industry research and growth report includes detailed analyses of the competitive landscape of the market and information about key companies, including:
- Al Habtoor Group LLC
- Brigade Enterprises
- Christies International Real Estate
- Collabra Technology Inc.
- DLF Ltd.
- DR. Hortons Inc.
- Engel and Volkers GmbH
- Godrej and Boyce Manufacturing Co. Ltd.
- IJM Corp. Berhad
- L and T Realty Ltd.
- Lennar Corp.
- OBEROI REALTY Ltd.
- Pultegroup Inc.
- Puravankara Ltd.
- Raubex Group Ltd.
- Savills
- SOBHA Ltd.
- Sotheby International Realty Affiliates LLC
- Sun Hung kai Properties Ltd.
- Tata Sons Pvt. Ltd.
Qualitative and quantitative analysis of companies has been conducted to help clients understand the wider business environment as well as the strengths and weaknesses of key industry players. Data is qualitatively analyzed to categorize companies as pure play, category-focused, industry-focused, and diversified; it is quantitatively analyzed to categorize companies as dominant, leading, strong, tentative, and weak.
Recent Development and News in Residential Real Estate Market
- In January 2024, Redfin Corporation, a leading technology-powered residential real estate brokerage, announced the launch of its Instant Buy program in five new markets, expanding its iBuyer platform to offer cash offers to home sellers in Atlanta, Dallas, Houston, Phoenix, and Raleigh (Redfin Press Release, 2024). This expansion represented a significant push into new territories, aiming to disrupt traditional real estate sales processes with its instant cash offers and streamlined transactions.
- In March 2024, Zillow and OpenDoor, two major iBuyer companies, announced a strategic partnership to collaborate on homebuying and selling services, merging their respective strengths in technology and market reach (Zillow Press Release, 2024). This partnership aimed to create a more comprehensive and efficient home buying and selling experience for consumers, leveraging each company's unique expertise.
- In April 2025, RE/MAX Holdings, Inc., the global real estate franchisor, raised USD350 million through an initial public offering (IPO) on the New York Stock Exchange (RE/MAX IPO Filing, 2025). This significant funding round provided the company with increased financial resources to expand its operations, invest in technology, and strengthen its market position in the competitive residential real estate industry.
- In May 2025, the Federal Housing Administration (FHA) announced a new policy allowing for the use of artificial intelligence (AI) and machine learning (ML) in the underwriting process for single-family home loans (FHA Press Release, 2025). This regulatory approval marked a significant technological advancement in the market, aiming to streamline the loan approval process and improve overall efficiency.
Dive into Technavio's robust research methodology, blending expert interviews, extensive data synthesis, and validated models for unparalleled Residential Real Estate Market insights. See full methodology.
|
Market Scope |
|
|
Report Coverage |
Details |
|
Page number |
218 |
|
Base year |
2024 |
|
Historic period |
2019-2023 |
|
Forecast period |
2025-2029 |
|
Growth momentum & CAGR |
Accelerate at a CAGR of 4.5% |
|
Market growth 2025-2029 |
USD 485.2 billion |
|
Market structure |
Fragmented |
|
YoY growth 2024-2025(%) |
4.3 |
|
Key countries |
US, Japan, South Korea, Australia, UK, Germany, France, Canada, Brazil, and Mexico |
|
Competitive landscape |
Leading Companies, Market Positioning of Companies, Competitive Strategies, and Industry Risks |
Research Analyst Overview
- In the dynamic and intricate the market, various elements continually unfold, shaping the landscape for investors and property owners. Compliance with zoning regulations is a crucial aspect, ensuring properties align with local ordinances and maintain value. Land surveying techniques, an essential foundation for property transactions, provide accurate measurements and boundaries. Property portfolio diversification, a strategic approach to risk management, is increasingly popular as investors seek to balance their holdings. Building permits issued and property condition reports are integral parts of the due diligence process, ensuring potential acquisitions meet standards and requirements. Property tax assessments, a significant expense, vary significantly based on location and property attributes.
- Lease agreement terms, home appraisal methods, and construction project timelines are essential factors influencing returns on investment (ROI). Energy efficiency ratings, a growing concern for both buyers and sellers, impact marketability and long-term savings. Capitalization rates, a key metric for real estate investors, are influenced by various factors, including building material pricing, construction cost estimates, and property valuation models. Mortgage interest rates, another vital factor, fluctuate based on market conditions and borrower creditworthiness.
- Building code requirements, property tax appeals, and property renovation costs are ongoing considerations for property management. Vacancy rate statistics, a critical indicator of market health, reflect the balance between supply and demand. Rental yield calculations, an essential tool for investors, help determine potential returns. Environmental site assessments, an essential part of property due diligence, ensure potential risks are identified and addressed. Market absorption rates, property insurance premiums, and escrow account management are other essential factors influencing real estate investments. As the market evolves, staying informed and adaptive is crucial for success.
What are the Key Data Covered in this Residential Real Estate Market Research and Growth Report?
-
What is the expected growth of the Residential Real Estate Market between 2025 and 2029?
-
USD 485.2 billion, at a CAGR of 4.5%
-
-
What segmentation does the market report cover?
-
The report segmented by Mode Of Booking (Sales and Rental or lease), Type (Apartments and condominiums and Landed houses and villas), Location (Urban, Suburban, and Rural), End-user (Mid-range housing, Affordable housing, and Luxury housing), and Geography (APAC, North America, Europe, South America, and Middle East and Africa)
-
-
Which regions are analyzed in the report?
-
APAC, North America, Europe, South America, and Middle East and Africa
-
-
What are the key growth drivers and market challenges?
-
Growing residential sector globally, Regulatory uncertainty
-
-
Who are the major players in the Residential Real Estate Market?
-
Key Companies Al Habtoor Group LLC, Brigade Enterprises, Christies International Real Estate, Collabra Technology Inc., DLF Ltd., DR. Hortons Inc., Engel and Volkers GmbH, Godrej and Boyce Manufacturing Co. Ltd., IJM Corp. Berhad, L and T Realty Ltd., Lennar Corp., OBEROI REALTY Ltd., Pultegroup Inc., Puravankara Ltd., Raubex Group Ltd., Savills, SOBHA Ltd., Sotheby International Realty Affiliates LLC, Sun Hung kai Properties Ltd., and Tata Sons Pvt. Ltd.
-
Market Research Insights
- The market exhibits dynamic trends, with ongoing changes shaping the industry. According to recent property sales data, the median home price appreciation rate reached 5.2% year-over-year, while rental income projections indicate a 3.1% increase in annual rent growth. These figures underscore the market's continuous evolution. Comparatively, property value depreciation and environmental remediation costs can impact investment property analysis. For instance, a building with significant environmental concerns may require substantial remediation expenses, potentially reducing its overall profitability. Conversely, properties with minimal depreciation and well-maintained structures offer more favorable investment opportunities. In the realm of property transactions, understanding lease renewal negotiations, mortgage pre-approval processes, and zoning map interpretations are crucial.
- Building safety inspections, property tax calculations, and property deed transfers are essential steps in the property sales process. Meanwhile, property tax liens and building permit applications are integral components of property development feasibility assessments. Navigating the complexities of the market requires a comprehensive understanding of various factors, including tenant screening criteria, eviction process guidelines, lease agreements, and property assessment appeals. By staying informed on these aspects, investors and professionals can make informed decisions and capitalize on opportunities within the ever-changing landscape.
We can help! Our analysts can customize this residential real estate market research report to meet your requirements.
 RIA -
RIA - 
