Law Enforcement Software Market Analysis, Size, and Forecast 2026-2030: North America (US, Canada, and Mexico), Europe (Germany, UK, and France), APAC (China, Japan, and India), South America (Brazil and Argentina), Middle East and Africa (Saudi Arabia, UAE, and South Africa), and Rest of World (ROW)

Law Enforcement Software Market Analysis, Size, and Forecast 2026-2030:
North America (US, Canada, and Mexico), Europe (Germany, UK, and France), APAC (China, Japan, and India), South America (Brazil and Argentina), Middle East and Africa (Saudi Arabia, UAE, and South Africa), and Rest of World (ROW)

Published: Mar 2026 289 Pages SKU: IRTNTR40407

Market Overview at a Glance

$1.99 B
Market Opportunity
11.9%
CAGR 2025 - 2030
37.2%
North America Growth
$1.36 B
On premises segment 2024

Law Enforcement Software Market Size 2026-2030

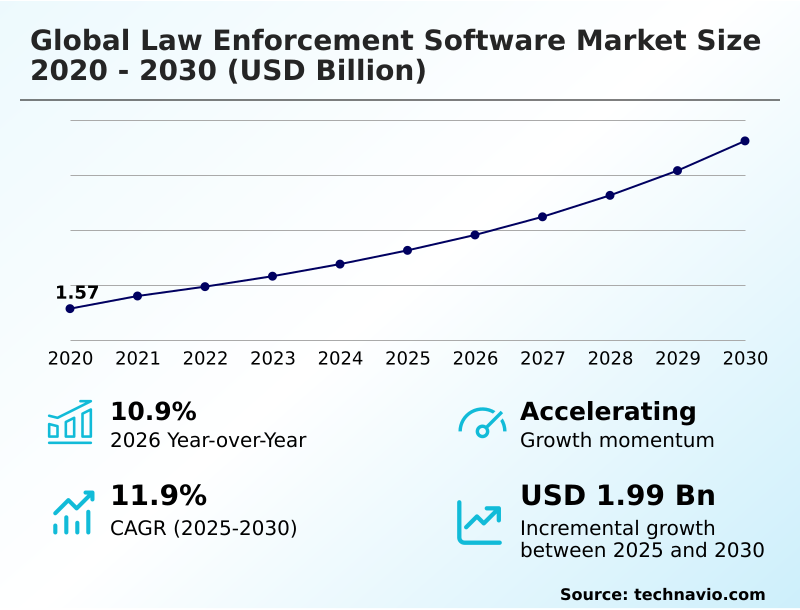
The law enforcement software market size is valued to increase by USD 1.99 billion, at a CAGR of 11.9% from 2025 to 2030. Increasing demand for analytics and data-driven policing will drive the law enforcement software market.

Major Market Trends & Insights

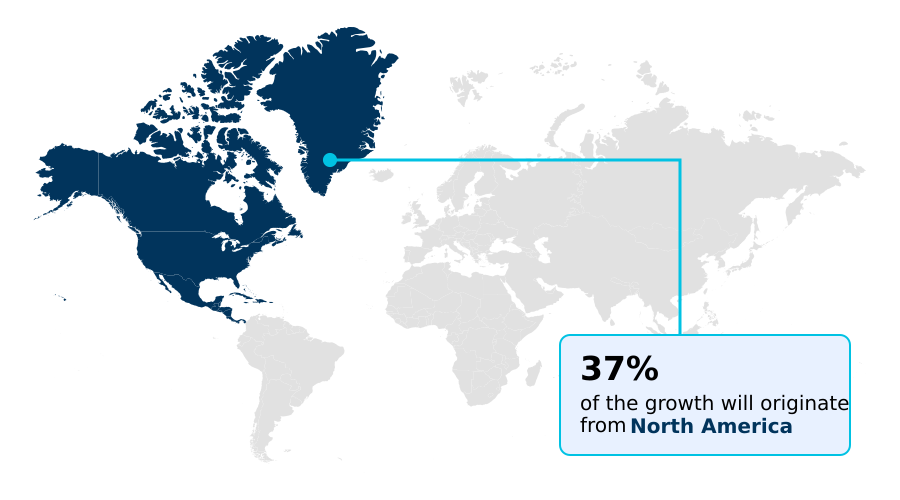
  • North America dominated the market and accounted for a 37.2% growth during the forecast period.
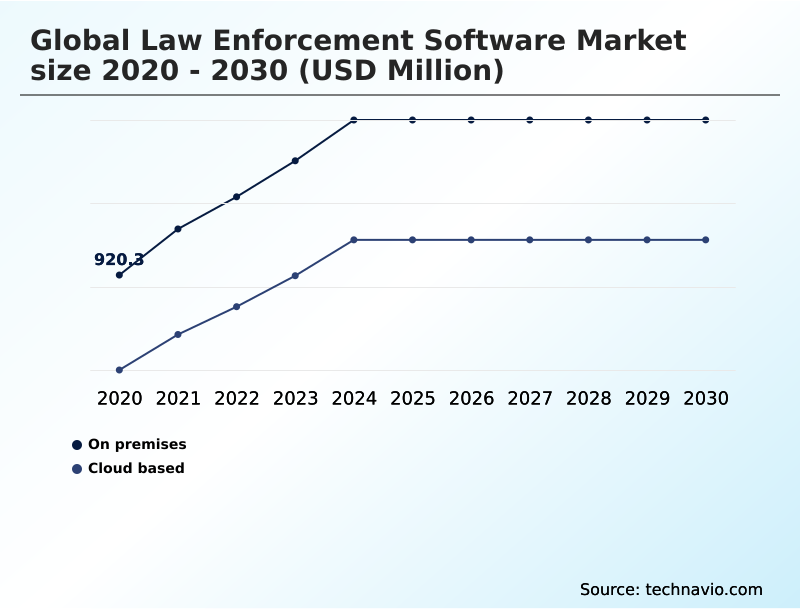
  • By Deployment - On premises segment was valued at USD 1.36 billion in 2024
  • By Type - Software segment accounted for the largest market revenue share in 2024

Market Size & Forecast

  • Market Opportunities: USD 3.05 billion
  • Market Future Opportunities: USD 1.99 billion
  • CAGR from 2025 to 2030 : 11.9%

Market Summary

  • The law enforcement software market is undergoing a significant transformation as agencies shift from legacy systems to integrated digital ecosystems. This evolution is driven by the need to improve operational efficiency, enhance officer safety, and foster greater public trust through transparency.
  • Key trends include the accelerated migration to cloud-based platforms, which offer superior scalability and accessibility, and the integration of artificial intelligence for advanced analytics. For instance, a metropolitan police department can leverage a unified public safety platform to analyze historical crime data, traffic patterns, and public event schedules.
  • This allows for proactive resource allocation, optimizing patrol routes to improve response times by 15% and placing officers where they are most needed. However, this progress is met with challenges, including significant budgetary constraints for modernizing infrastructure and intense public scrutiny over data privacy and the potential for algorithmic bias in predictive policing tools.
  • Successfully navigating this landscape requires a balanced approach that embraces technological innovation while upholding stringent ethical standards and regulatory compliance.

What will be the Size of the Law Enforcement Software Market during the forecast period?

Get Key Insights on Market Forecast (PDF) Request Free Sample

How is the Law Enforcement Software Market Segmented?

The law enforcement software industry research report provides comprehensive data (region-wise segment analysis), with forecasts and estimates in "USD million" for the period 2026-2030, as well as historical data from 2020-2024 for the following segments.

  • Deployment
    • On premises
    • Cloud based
  • Type
    • Software
    • Services
  • End-user
    • Police departments
    • Municipalities
    • Others
  • Geography
    • North America
      • US
      • Canada
      • Mexico
    • Europe
      • Germany
      • UK
      • France
    • APAC
      • China
      • Japan
      • India
    • South America
      • Brazil
      • Argentina
    • Middle East and Africa
      • Saudi Arabia
      • UAE
      • South Africa
    • Rest of World (ROW)

By Deployment Insights

The on premises segment is estimated to witness significant growth during the forecast period.

The on-premises segment of the law enforcement software market involves agencies housing their own servers, providing direct control over sensitive information.

This model is critical for organizations governed by strict data sovereignty rules, where maintaining full ownership of hardware and security protocols is paramount.

While the broader digital transformation in policing favors cloud adoption, many agencies continue to invest in on-premises police software. The rationale often involves the deep integration of legacy records management systems and computer-aided dispatch platforms into existing workflows.

Modernizing this infrastructure with new enterprise-level software platforms is complex. Therefore, organizations prioritize system stability and control, ensuring over 99.9% uptime for their integrated public safety solutions rather than pursuing a complete migration to a different deployment model.

Request Free Sample

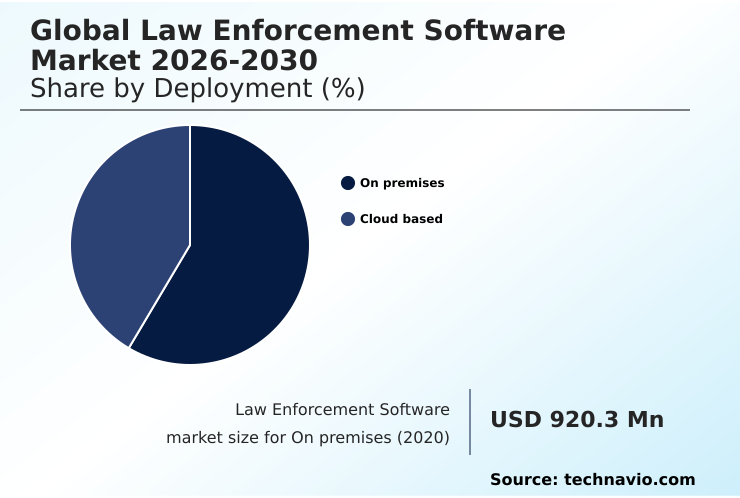
The On premises segment was valued at USD 1.36 billion in 2024 and showed a gradual increase during the forecast period.

Request Free Sample

Regional Analysis

North America is estimated to contribute 37.2% to the growth of the global market during the forecast period.Technavio’s analysts have elaborately explained the regional trends and drivers that shape the market during the forecast period.

See How Law Enforcement Software Market Demand is Rising in North America Request Free Sample

The geographic landscape for law enforcement software is diverse, with mature markets focusing on sophisticated integrations and emerging regions prioritizing foundational modernization.

North America represents over 37% of the incremental opportunity, with agencies adopting advanced public safety analytics and smart city policing technology.

In contrast, the market in APAC is expanding at the fastest regional pace, approximately 1 percentage point higher than in Europe, driven by large-scale public safety projects.

These initiatives often involve deploying video surveillance analytics and geospatial intelligence for proactive crime prevention. Key investments are being made in digital forensics platform capabilities and threat intelligence platforms to support multi-agency coordination through a national data-sharing initiative.

The adoption of incident reporting software and emergency management software is becoming standard, creating a more connected security ecosystem globally.

Market Dynamics

Our researchers analyzed the data with 2025 as the base year, along with the key drivers, trends, and challenges. A holistic analysis of drivers will help companies refine their marketing strategies to gain a competitive advantage.

  • Strategic adoption within the global law enforcement software market 2026-2030 requires careful planning, beginning with decisions on core infrastructure like cloud based cad rms integration. The evaluation of ai predictive policing software accuracy is critical, as is selecting the right digital evidence management for bodycams to ensure evidence integrity.
  • Empowering field personnel through a mobile policing app real-time access is a key objective, which often shows a doubling of report filing efficiency compared to station-based processes. Concurrently, improving police community engagement platforms builds public trust. Agencies face significant law enforcement software interoperability challenges and must budget for the high cost of modernizing legacy police systems.
  • Navigating data privacy in facial recognition and leveraging geospatial crime mapping analysis tools are key operational considerations. The integrated public safety platform benefits are clear, but achieving them depends on successful records management system data migration and establishing effective cross-jurisdiction data sharing solutions. Agencies must also factor in gunshot detection system implementation costs and acquire advanced cybercrime investigation software features.
  • A robust command center software for emergencies is essential for large-scale events. Ultimately, success hinges on managing digital evidence chain of custody, utilizing software for officer accountability reporting, applying analytics for resource allocation optimization, providing real-time intelligence for patrol officers, and reducing administrative tasks with software.

What are the key market drivers leading to the rise in the adoption of Law Enforcement Software Industry?

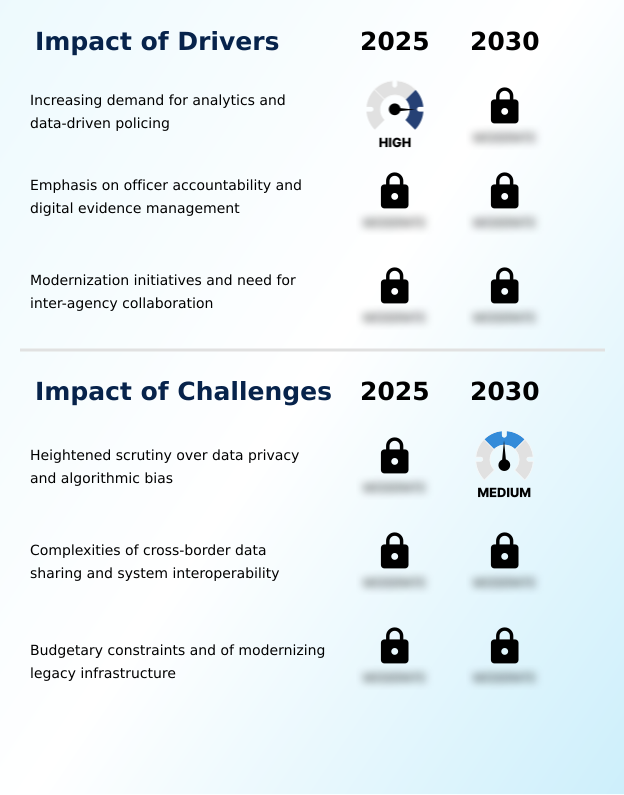
  • An increasing demand for analytics and data-driven policing strategies serves as a key driver for market growth.

  • Market growth is driven by the imperative to adopt intelligence-led policing and enhance transparency through technology.
  • The demand for robust digital evidence management systems is surging, as these platforms are critical for chain of custody tracking and are considered essential officer accountability tools. Agencies implementing these systems report a 40% reduction in evidence processing time.
  • Another major driver is modernizing legacy infrastructure with a unified public safety platform, which provides a unified operational picture and enhances decision-making in command center platforms.
  • These integrated public safety solutions facilitate real-time data analysis and empower officers with mobile policing solutions.
  • The shift to end-to-end public safety solutions, combining dispatch, records, and case management systems, streamlines workflows and improves inter-agency collaboration, which is a key goal for most departments.

What are the market trends shaping the Law Enforcement Software Industry?

  • The proliferation of artificial intelligence and predictive analytics is emerging as a significant market trend, reshaping traditional policing models toward more proactive, data-informed strategies.

  • Key market trends are centered on the integration of artificial intelligence and the migration to cloud-based law enforcement solutions. The adoption of data-driven policing strategies for proactive crime prevention is powered by predictive policing algorithms and AI-powered video analytics, which have improved crime forecast accuracy by over 25% in some urban areas.
  • AI-enhanced records management systems use natural language processing to analyze reports, accelerating intelligence extraction. The use of criminal intelligence software for automated data analysis and tools like facial recognition systems is growing, though it is accompanied by ethical debates. This technological shift enables real-time situational awareness and more efficient operations.
  • Furthermore, the standardization of biometric data exchange protocols is improving how agencies collaborate on complex investigations, reducing suspect identification time significantly.

What challenges does the Law Enforcement Software Industry face during its growth?

  • Heightened scrutiny over data privacy and the potential for algorithmic bias presents a key challenge affecting industry growth.

  • Significant challenges constrain market growth, led by heightened scrutiny over data privacy and algorithmic bias in investigative analytics. The complexity of cross-border data sharing and the lack of standardized interoperability protocols for public safety software create technical hurdles, with integration projects often exceeding budgets by over 15%.
  • While there is a push for transparency through public-facing dashboards and community engagement platforms, agencies face budgetary constraints when attempting to modernize. The high cost of deploying specialized tools like a gunshot detection system or advanced traffic management software can be prohibitive.
  • Furthermore, achieving end-to-end digital justice and security is complicated by the need to ensure data from various systems is compatible with judicial tools such as e-discovery platforms and courtroom presentation software, a critical but often overlooked expense.

Exclusive Technavio Analysis on Customer Landscape

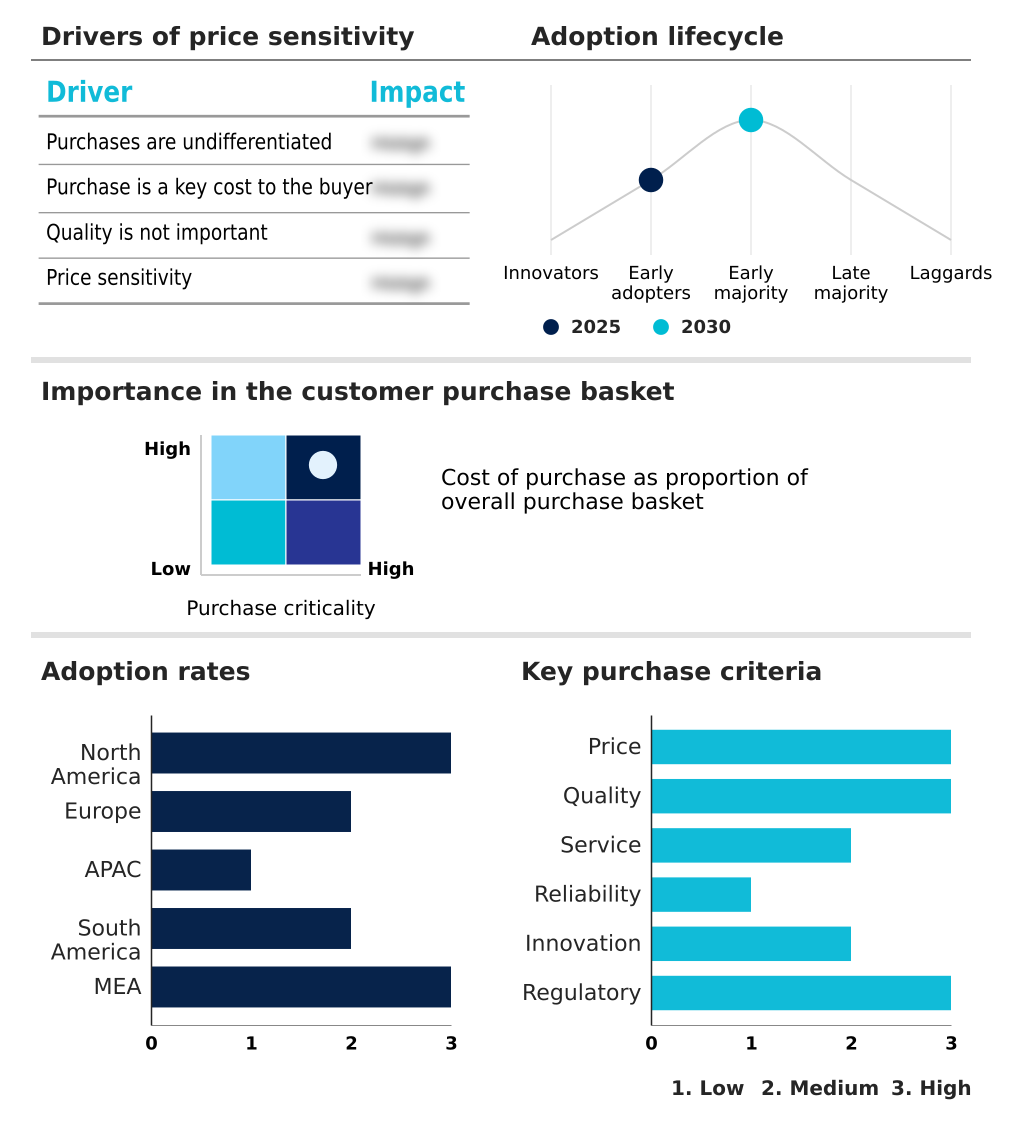
The law enforcement software market forecasting report includes the adoption lifecycle of the market, covering from the innovator’s stage to the laggard’s stage. It focuses on adoption rates in different regions based on penetration. Furthermore, the law enforcement software market report also includes key purchase criteria and drivers of price sensitivity to help companies evaluate and develop their market growth analysis strategies.

Customer Landscape of Law Enforcement Software Industry

Competitive Landscape

Companies are implementing various strategies, such as strategic alliances, law enforcement software market forecast, partnerships, mergers and acquisitions, geographical expansion, and product/service launches, to enhance their presence in the industry.

Accenture PLC - Harnessing data science, cloud computing, and AI, its integrated public safety platforms are designed to foster safer communities through advanced, connected software solutions.

The industry research and growth report includes detailed analyses of the competitive landscape of the market and information about key companies, including:

  • Accenture PLC
  • Axon Enterprise Inc.
  • Capterra Inc.
  • CentralSquare
  • CODY Computer Serv Inc.
  • Esri Global Inc.
  • Genetec Inc.
  • Guardian Alliance Tech Inc.
  • Hexagon AB
  • LexisNexis Risk Solutions.
  • Matrix Pointe Software
  • Motorola Solutions Inc.
  • NiCE Ltd.
  • Omnigo Software
  • Palantir Technologies Inc.
  • Tyler Technologies Inc.

Qualitative and quantitative analysis of companies has been conducted to help clients understand the wider business environment as well as the strengths and weaknesses of key industry players. Data is qualitatively analyzed to categorize companies as pure play, category-focused, industry-focused, and diversified; it is quantitatively analyzed to categorize companies as dominant, leading, strong, tentative, and weak.

Recent Development and News in Law enforcement software market

  • In January 2025, The Dallas Police Department initiated an upgrade to a hybrid cloud case management platform from IBM to enhance data accessibility and predictive policing capabilities.
  • In February 2025, The European Commission issued new implementing regulations for the Prum II framework, which mandates standardized technical protocols for the automated exchange of biometric data among member states.
  • In March 2025, Motorola Solutions deployed an AI-enhanced records management system for the New York Police Department, designed to accelerate crime analysis and improve interdepartmental coordination.
  • In May 2025, a consortium of mid-sized municipal police departments awarded a multi-year managed services contract to a technology provider for the end-to-end management of their shared cloud-based digital evidence system.

Dive into Technavio’s robust research methodology, blending expert interviews, extensive data synthesis, and validated models for unparalleled Law Enforcement Software Market insights. See full methodology.

Market Scope
Page number 289
Base year 2025
Historic period 2020-2024
Forecast period 2026-2030
Growth momentum & CAGR Accelerate at a CAGR of 11.9%
Market growth 2026-2030 USD 1991.2 million
Market structure Fragmented
YoY growth 2025-2026(%) 10.9%
Key countries US, Canada, Mexico, Germany, UK, France, Italy, Spain, The Netherlands, China, Japan, India, South Korea, Australia, Indonesia, Brazil, Argentina, Chile, Saudi Arabia, UAE, South Africa, Egypt and Turkey
Competitive landscape Leading Companies, Market Positioning of Companies, Competitive Strategies, and Industry Risks

Request Free Sample

Research Analyst Overview

  • The law enforcement software market is defined by a suite of interconnected technologies. Core operations rely on computer-aided dispatch and records management systems, while investigations are enhanced by case management systems, investigative analytics, digital forensics platform tools, and e-discovery platforms.
  • A boardroom-level focus on cloud migration is driven by the need to integrate these with modern digital evidence management solutions, essential for chain of custody tracking and managing data from bodycams and video surveillance analytics.
  • The adoption of AI-enhanced records management and predictive policing algorithms utilizing natural language processing and automated data analysis can improve case clearance rates by up to 10%. Public safety is further augmented by specialized tools like gunshot detection system tech, gunshot detection and analysis, facial recognition systems, cryptocurrency transaction analysis, and dark web monitoring software.
  • A unified public safety platform integrates these with incident reporting software, geospatial intelligence, and crime mapping to provide a complete operational picture.
  • This is crucial for command center platforms, emergency management software, traffic management software, and global security operations center operations, which depend on mobile policing solutions, interoperability protocols, real-time data analysis, a digital docket system, guard tour management, courtroom presentation software and threat intelligence platforms to function effectively.

What are the Key Data Covered in this Law Enforcement Software Market Research and Growth Report?

  • What is the expected growth of the Law Enforcement Software Market between 2026 and 2030?

    • USD 1.99 billion, at a CAGR of 11.9%

  • What segmentation does the market report cover?

    • The report is segmented by Deployment (On premises, and Cloud based), Type (Software, and Services), End-user (Police departments, Municipalities, and Others) and Geography (North America, Europe, APAC, South America, Middle East and Africa)

  • Which regions are analyzed in the report?

    • North America, Europe, APAC, South America and Middle East and Africa

  • What are the key growth drivers and market challenges?

    • Increasing demand for analytics and data-driven policing, Heightened scrutiny over data privacy and algorithmic bias

  • Who are the major players in the Law Enforcement Software Market?

    • Accenture PLC, Axon Enterprise Inc., Capterra Inc., CentralSquare, CODY Computer Serv Inc., Esri Global Inc., Genetec Inc., Guardian Alliance Tech Inc., Hexagon AB, LexisNexis Risk Solutions., Matrix Pointe Software, Motorola Solutions Inc., NiCE Ltd., Omnigo Software, Palantir Technologies Inc. and Tyler Technologies Inc.

Market Research Insights

  • Market dynamics are shaped by the dual pressures of technological advancement and regulatory oversight. Agencies are adopting data-driven policing strategies to improve outcomes, with integrated public safety solutions demonstrating a 20% improvement in cross-agency case collaboration. The shift toward cloud-based law enforcement solutions is driven by cost-efficiency, reducing infrastructure overhead by up to 30% compared to on-premise systems.
  • As part of a broader digital transformation in policing, community engagement platforms are being deployed to enhance transparency. However, the implementation of these technologies is moderated by the complexities of modernizing legacy infrastructure and ensuring compliance with evolving data privacy laws.

We can help! Our analysts can customize this law enforcement software market research report to meet your requirements.

Get in touch

1. Executive Summary

1.1 Market overview

Executive Summary - Chart on Market Overview
Executive Summary - Data Table on Market Overview
Executive Summary - Chart on Global Market Characteristics
Executive Summary - Chart on Market by Geography
Executive Summary - Chart on Market Segmentation by Deployment
Executive Summary - Chart on Market Segmentation by Type
Executive Summary - Chart on Market Segmentation by End-user
Executive Summary - Chart on Incremental Growth
Executive Summary - Data Table on Incremental Growth
Executive Summary - Chart on Company Market Positioning

2. Technavio Analysis

2.1 Analysis of price sensitivity, lifecycle, customer purchase basket, adoption rates, and purchase criteria

2.2 Criticality of inputs and Factors of differentiation

Chart on Overview on criticality of inputs and factors of differentiation

2.3 Factors of disruption

Chart on Overview on factors of disruption

2.4 Impact of drivers and challenges

Chart on Impact of drivers and challenges in 2025 and 2030

3. Market Landscape

3.1 Market ecosystem

Chart on Parent Market
Data Table on - Parent Market

3.2 Market characteristics

Chart on Market characteristics analysis

3.3 Value chain analysis

Chart on Value chain analysis

4. Market Sizing

4.1 Market definition

Data Table on Offerings of companies included in the market definition

4.2 Market segment analysis

Market segments

4.3 Market size 2025

4.4 Market outlook: Forecast for 2025-2030

Chart on Global - Market size and forecast 2025-2030 ($ million)
Data Table on Global - Market size and forecast 2025-2030 ($ million)
Chart on Global Market: Year-over-year growth 2025-2030 (%)
Data Table on Global Market: Year-over-year growth 2025-2030 (%)

5. Historic Market Size

5.1 Global Law Enforcement Software Market 2020 - 2024

Historic Market Size - Data Table on Global Law Enforcement Software Market 2020 - 2024 ($ million)

5.2 Deployment segment analysis 2020 - 2024

Historic Market Size - Deployment Segment 2020 - 2024 ($ million)

5.3 Type segment analysis 2020 - 2024

Historic Market Size - Type Segment 2020 - 2024 ($ million)

5.4 End-user segment analysis 2020 - 2024

Historic Market Size - End-user Segment 2020 - 2024 ($ million)

5.5 Geography segment analysis 2020 - 2024

Historic Market Size - Geography Segment 2020 - 2024 ($ million)

5.6 Country segment analysis 2020 - 2024

Historic Market Size - Country Segment 2020 - 2024 ($ million)

6. Qualitative Analysis

6.1 Impact of AI in global law enforcement software market

7. Five Forces Analysis

7.1 Five forces summary

Five forces analysis - Comparison between 2025 and 2030

7.2 Bargaining power of buyers

Bargaining power of buyers - Impact of key factors 2025 and 2030

7.3 Bargaining power of suppliers

Bargaining power of suppliers - Impact of key factors in 2025 and 2030

7.4 Threat of new entrants

Threat of new entrants - Impact of key factors in 2025 and 2030

7.5 Threat of substitutes

Threat of substitutes - Impact of key factors in 2025 and 2030

7.6 Threat of rivalry

Threat of rivalry - Impact of key factors in 2025 and 2030

7.7 Market condition

Chart on Market condition - Five forces 2025 and 2030

8. Market Segmentation by Deployment

8.1 Market segments

Chart on Deployment - Market share 2025-2030 (%)
Data Table on Deployment - Market share 2025-2030 (%)

8.2 Comparison by Deployment

Chart on Comparison by Deployment
Data Table on Comparison by Deployment

8.3 On premises - Market size and forecast 2025-2030

Chart on On premises - Market size and forecast 2025-2030 ($ million)
Data Table on On premises - Market size and forecast 2025-2030 ($ million)
Chart on On premises - Year-over-year growth 2025-2030 (%)
Data Table on On premises - Year-over-year growth 2025-2030 (%)

8.4 Cloud based - Market size and forecast 2025-2030

Chart on Cloud based - Market size and forecast 2025-2030 ($ million)
Data Table on Cloud based - Market size and forecast 2025-2030 ($ million)
Chart on Cloud based - Year-over-year growth 2025-2030 (%)
Data Table on Cloud based - Year-over-year growth 2025-2030 (%)

8.5 Market opportunity by Deployment

Market opportunity by Deployment ($ million)
Data Table on Market opportunity by Deployment ($ million)

9. Market Segmentation by Type

9.1 Market segments

Chart on Type - Market share 2025-2030 (%)
Data Table on Type - Market share 2025-2030 (%)

9.2 Comparison by Type

Chart on Comparison by Type
Data Table on Comparison by Type

9.3 Software - Market size and forecast 2025-2030

Chart on Software - Market size and forecast 2025-2030 ($ million)
Data Table on Software - Market size and forecast 2025-2030 ($ million)
Chart on Software - Year-over-year growth 2025-2030 (%)
Data Table on Software - Year-over-year growth 2025-2030 (%)

9.4 Services - Market size and forecast 2025-2030

Chart on Services - Market size and forecast 2025-2030 ($ million)
Data Table on Services - Market size and forecast 2025-2030 ($ million)
Chart on Services - Year-over-year growth 2025-2030 (%)
Data Table on Services - Year-over-year growth 2025-2030 (%)

9.5 Market opportunity by Type

Market opportunity by Type ($ million)
Data Table on Market opportunity by Type ($ million)

10. Market Segmentation by End-user

10.1 Market segments

Chart on End-user - Market share 2025-2030 (%)
Data Table on End-user - Market share 2025-2030 (%)

10.2 Comparison by End-user

Chart on Comparison by End-user
Data Table on Comparison by End-user

10.3 Police departments - Market size and forecast 2025-2030

Chart on Police departments - Market size and forecast 2025-2030 ($ million)
Data Table on Police departments - Market size and forecast 2025-2030 ($ million)
Chart on Police departments - Year-over-year growth 2025-2030 (%)
Data Table on Police departments - Year-over-year growth 2025-2030 (%)

10.4 Municipalities - Market size and forecast 2025-2030

Chart on Municipalities - Market size and forecast 2025-2030 ($ million)
Data Table on Municipalities - Market size and forecast 2025-2030 ($ million)
Chart on Municipalities - Year-over-year growth 2025-2030 (%)
Data Table on Municipalities - Year-over-year growth 2025-2030 (%)

10.5 Others - Market size and forecast 2025-2030

Chart on Others - Market size and forecast 2025-2030 ($ million)
Data Table on Others - Market size and forecast 2025-2030 ($ million)
Chart on Others - Year-over-year growth 2025-2030 (%)
Data Table on Others - Year-over-year growth 2025-2030 (%)

10.6 Market opportunity by End-user

Market opportunity by End-user ($ million)
Data Table on Market opportunity by End-user ($ million)

11. Customer Landscape

11.1 Customer landscape overview

Analysis of price sensitivity, lifecycle, customer purchase basket, adoption rates, and purchase criteria

12. Geographic Landscape

12.1 Geographic segmentation

Chart on Market share by geography 2025-2030 (%)
Data Table on Market share by geography 2025-2030 (%)

12.2 Geographic comparison

Chart on Geographic comparison
Data Table on Geographic comparison

12.3 North America - Market size and forecast 2025-2030

Chart on North America - Market size and forecast 2025-2030 ($ million)
Data Table on North America - Market size and forecast 2025-2030 ($ million)
Chart on North America - Year-over-year growth 2025-2030 (%)
Data Table on North America - Year-over-year growth 2025-2030 (%)
Chart on Regional Comparison - North America
Data Table on Regional Comparison - North America

12.3.1 US - Market size and forecast 2025-2030

Chart on US - Market size and forecast 2025-2030 ($ million)
Data Table on US - Market size and forecast 2025-2030 ($ million)
Chart on US - Year-over-year growth 2025-2030 (%)
Data Table on US - Year-over-year growth 2025-2030 (%)

12.3.2 Canada - Market size and forecast 2025-2030

Chart on Canada - Market size and forecast 2025-2030 ($ million)
Data Table on Canada - Market size and forecast 2025-2030 ($ million)
Chart on Canada - Year-over-year growth 2025-2030 (%)
Data Table on Canada - Year-over-year growth 2025-2030 (%)

12.3.3 Mexico - Market size and forecast 2025-2030

Chart on Mexico - Market size and forecast 2025-2030 ($ million)
Data Table on Mexico - Market size and forecast 2025-2030 ($ million)
Chart on Mexico - Year-over-year growth 2025-2030 (%)
Data Table on Mexico - Year-over-year growth 2025-2030 (%)

12.4 Europe - Market size and forecast 2025-2030

Chart on Europe - Market size and forecast 2025-2030 ($ million)
Data Table on Europe - Market size and forecast 2025-2030 ($ million)
Chart on Europe - Year-over-year growth 2025-2030 (%)
Data Table on Europe - Year-over-year growth 2025-2030 (%)
Chart on Regional Comparison - Europe
Data Table on Regional Comparison - Europe

12.4.1 Germany - Market size and forecast 2025-2030

Chart on Germany - Market size and forecast 2025-2030 ($ million)
Data Table on Germany - Market size and forecast 2025-2030 ($ million)
Chart on Germany - Year-over-year growth 2025-2030 (%)
Data Table on Germany - Year-over-year growth 2025-2030 (%)

12.4.2 UK - Market size and forecast 2025-2030

Chart on UK - Market size and forecast 2025-2030 ($ million)
Data Table on UK - Market size and forecast 2025-2030 ($ million)
Chart on UK - Year-over-year growth 2025-2030 (%)
Data Table on UK - Year-over-year growth 2025-2030 (%)

12.4.3 France - Market size and forecast 2025-2030

Chart on France - Market size and forecast 2025-2030 ($ million)
Data Table on France - Market size and forecast 2025-2030 ($ million)
Chart on France - Year-over-year growth 2025-2030 (%)
Data Table on France - Year-over-year growth 2025-2030 (%)

12.4.4 Italy - Market size and forecast 2025-2030

Chart on Italy - Market size and forecast 2025-2030 ($ million)
Data Table on Italy - Market size and forecast 2025-2030 ($ million)
Chart on Italy - Year-over-year growth 2025-2030 (%)
Data Table on Italy - Year-over-year growth 2025-2030 (%)

12.4.5 Spain - Market size and forecast 2025-2030

Chart on Spain - Market size and forecast 2025-2030 ($ million)
Data Table on Spain - Market size and forecast 2025-2030 ($ million)
Chart on Spain - Year-over-year growth 2025-2030 (%)
Data Table on Spain - Year-over-year growth 2025-2030 (%)

12.4.6 The Netherlands - Market size and forecast 2025-2030

Chart on The Netherlands - Market size and forecast 2025-2030 ($ million)
Data Table on The Netherlands - Market size and forecast 2025-2030 ($ million)
Chart on The Netherlands - Year-over-year growth 2025-2030 (%)
Data Table on The Netherlands - Year-over-year growth 2025-2030 (%)

12.5 APAC - Market size and forecast 2025-2030

Chart on APAC - Market size and forecast 2025-2030 ($ million)
Data Table on APAC - Market size and forecast 2025-2030 ($ million)
Chart on APAC - Year-over-year growth 2025-2030 (%)
Data Table on APAC - Year-over-year growth 2025-2030 (%)
Chart on Regional Comparison - APAC
Data Table on Regional Comparison - APAC

12.5.1 China - Market size and forecast 2025-2030

Chart on China - Market size and forecast 2025-2030 ($ million)
Data Table on China - Market size and forecast 2025-2030 ($ million)
Chart on China - Year-over-year growth 2025-2030 (%)
Data Table on China - Year-over-year growth 2025-2030 (%)

12.5.2 Japan - Market size and forecast 2025-2030

Chart on Japan - Market size and forecast 2025-2030 ($ million)
Data Table on Japan - Market size and forecast 2025-2030 ($ million)
Chart on Japan - Year-over-year growth 2025-2030 (%)
Data Table on Japan - Year-over-year growth 2025-2030 (%)

12.5.3 India - Market size and forecast 2025-2030

Chart on India - Market size and forecast 2025-2030 ($ million)
Data Table on India - Market size and forecast 2025-2030 ($ million)
Chart on India - Year-over-year growth 2025-2030 (%)
Data Table on India - Year-over-year growth 2025-2030 (%)

12.5.4 South Korea - Market size and forecast 2025-2030

Chart on South Korea - Market size and forecast 2025-2030 ($ million)
Data Table on South Korea - Market size and forecast 2025-2030 ($ million)
Chart on South Korea - Year-over-year growth 2025-2030 (%)
Data Table on South Korea - Year-over-year growth 2025-2030 (%)

12.5.5 Australia - Market size and forecast 2025-2030

Chart on Australia - Market size and forecast 2025-2030 ($ million)
Data Table on Australia - Market size and forecast 2025-2030 ($ million)
Chart on Australia - Year-over-year growth 2025-2030 (%)
Data Table on Australia - Year-over-year growth 2025-2030 (%)

12.5.6 Indonesia - Market size and forecast 2025-2030

Chart on Indonesia - Market size and forecast 2025-2030 ($ million)
Data Table on Indonesia - Market size and forecast 2025-2030 ($ million)
Chart on Indonesia - Year-over-year growth 2025-2030 (%)
Data Table on Indonesia - Year-over-year growth 2025-2030 (%)

12.6 South America - Market size and forecast 2025-2030

Chart on South America - Market size and forecast 2025-2030 ($ million)
Data Table on South America - Market size and forecast 2025-2030 ($ million)
Chart on South America - Year-over-year growth 2025-2030 (%)
Data Table on South America - Year-over-year growth 2025-2030 (%)
Chart on Regional Comparison - South America
Data Table on Regional Comparison - South America

12.6.1 Brazil - Market size and forecast 2025-2030

Chart on Brazil - Market size and forecast 2025-2030 ($ million)
Data Table on Brazil - Market size and forecast 2025-2030 ($ million)
Chart on Brazil - Year-over-year growth 2025-2030 (%)
Data Table on Brazil - Year-over-year growth 2025-2030 (%)

12.6.2 Argentina - Market size and forecast 2025-2030

Chart on Argentina - Market size and forecast 2025-2030 ($ million)
Data Table on Argentina - Market size and forecast 2025-2030 ($ million)
Chart on Argentina - Year-over-year growth 2025-2030 (%)
Data Table on Argentina - Year-over-year growth 2025-2030 (%)

12.6.3 Chile - Market size and forecast 2025-2030

Chart on Chile - Market size and forecast 2025-2030 ($ million)
Data Table on Chile - Market size and forecast 2025-2030 ($ million)
Chart on Chile - Year-over-year growth 2025-2030 (%)
Data Table on Chile - Year-over-year growth 2025-2030 (%)

12.7 Middle East and Africa - Market size and forecast 2025-2030

Chart on Middle East and Africa - Market size and forecast 2025-2030 ($ million)
Data Table on Middle East and Africa - Market size and forecast 2025-2030 ($ million)
Chart on Middle East and Africa - Year-over-year growth 2025-2030 (%)
Data Table on Middle East and Africa - Year-over-year growth 2025-2030 (%)
Chart on Regional Comparison - Middle East and Africa
Data Table on Regional Comparison - Middle East and Africa

12.7.1 Saudi Arabia - Market size and forecast 2025-2030

Chart on Saudi Arabia - Market size and forecast 2025-2030 ($ million)
Data Table on Saudi Arabia - Market size and forecast 2025-2030 ($ million)
Chart on Saudi Arabia - Year-over-year growth 2025-2030 (%)
Data Table on Saudi Arabia - Year-over-year growth 2025-2030 (%)

12.7.2 UAE - Market size and forecast 2025-2030

Chart on UAE - Market size and forecast 2025-2030 ($ million)
Data Table on UAE - Market size and forecast 2025-2030 ($ million)
Chart on UAE - Year-over-year growth 2025-2030 (%)
Data Table on UAE - Year-over-year growth 2025-2030 (%)

12.7.3 South Africa - Market size and forecast 2025-2030

Chart on South Africa - Market size and forecast 2025-2030 ($ million)
Data Table on South Africa - Market size and forecast 2025-2030 ($ million)
Chart on South Africa - Year-over-year growth 2025-2030 (%)
Data Table on South Africa - Year-over-year growth 2025-2030 (%)

12.7.4 Egypt - Market size and forecast 2025-2030

Chart on Egypt - Market size and forecast 2025-2030 ($ million)
Data Table on Egypt - Market size and forecast 2025-2030 ($ million)
Chart on Egypt - Year-over-year growth 2025-2030 (%)
Data Table on Egypt - Year-over-year growth 2025-2030 (%)

12.7.5 Turkey - Market size and forecast 2025-2030

Chart on Turkey - Market size and forecast 2025-2030 ($ million)
Data Table on Turkey - Market size and forecast 2025-2030 ($ million)
Chart on Turkey - Year-over-year growth 2025-2030 (%)
Data Table on Turkey - Year-over-year growth 2025-2030 (%)

12.8 Market opportunity by geography

Market opportunity by geography ($ million)
Data Tables on Market opportunity by geography ($ million)

13. Drivers, Challenges, and Opportunity

13.1 Market drivers

Increasing demand for analytics and data-driven policing
Emphasis on officer accountability and digital evidence management
Modernization initiatives and need for inter-agency collaboration

13.2 Market challenges

Heightened scrutiny over data privacy and algorithmic bias
Complexities of cross-border data sharing and system interoperability
Budgetary constraints and of modernizing legacy infrastructure

13.3 Impact of drivers and challenges

Impact of drivers and challenges in 2025 and 2030

13.4 Market opportunities

Proliferation of artificial intelligence and predictive analytics
Accelerated migration to cloud-based and integrated platforms
Emphasis on transparency and community engagement platforms

14. Competitive Landscape

14.1 Overview

14.2

Overview on criticality of inputs and factors of differentiation

14.3 Landscape disruption

Overview on factors of disruption

14.4 Industry risks

Impact of key risks on business

15. Competitive Analysis

15.1 Companies profiled

Companies covered

15.2 Company ranking index

15.3 Market positioning of companies

Matrix on companies position and classification

15.4 Accenture PLC

Accenture PLC - Overview
Accenture PLC - Business segments
Accenture PLC - Key news
Accenture PLC - Key offerings
Accenture PLC - Segment focus
SWOT

15.5 Axon Enterprise Inc.

Axon Enterprise Inc. - Overview
Axon Enterprise Inc. - Business segments
Axon Enterprise Inc. - Key news
Axon Enterprise Inc. - Key offerings
Axon Enterprise Inc. - Segment focus
SWOT

15.6 Capterra Inc.

Capterra Inc. - Overview
Capterra Inc. - Product / Service
Capterra Inc. - Key offerings
SWOT

15.7 CentralSquare

CentralSquare - Overview
CentralSquare - Product / Service
CentralSquare - Key offerings
SWOT

15.8 CODY Computer Serv Inc.

CODY Computer Serv Inc. - Overview
CODY Computer Serv Inc. - Product / Service
CODY Computer Serv Inc. - Key offerings
SWOT

15.9 Esri Global Inc.

Esri Global Inc. - Overview
Esri Global Inc. - Product / Service
Esri Global Inc. - Key offerings
SWOT

15.10 Genetec Inc.

Genetec Inc. - Overview
Genetec Inc. - Product / Service
Genetec Inc. - Key offerings
SWOT

15.11 Hexagon AB

Hexagon AB - Overview
Hexagon AB - Business segments
Hexagon AB - Key news
Hexagon AB - Key offerings
Hexagon AB - Segment focus
SWOT

15.12 LexisNexis Risk Solutions.

LexisNexis Risk Solutions. - Overview
LexisNexis Risk Solutions. - Product / Service
LexisNexis Risk Solutions. - Key offerings
SWOT

15.13 Matrix Pointe Software

Matrix Pointe Software - Overview
Matrix Pointe Software - Product / Service
Matrix Pointe Software - Key offerings
SWOT

15.14 Motorola Solutions Inc.

Motorola Solutions Inc. - Overview
Motorola Solutions Inc. - Business segments
Motorola Solutions Inc. - Key news
Motorola Solutions Inc. - Key offerings
Motorola Solutions Inc. - Segment focus
SWOT

15.15 NiCE Ltd.

NiCE Ltd. - Overview
NiCE Ltd. - Product / Service
NiCE Ltd. - Key offerings
SWOT

15.16 Omnigo Software

Omnigo Software - Overview
Omnigo Software - Product / Service
Omnigo Software - Key offerings
SWOT

15.17 Palantir Technologies Inc.

Palantir Technologies Inc. - Overview
Palantir Technologies Inc. - Product / Service
Palantir Technologies Inc. - Key offerings
SWOT

15.18 Tyler Technologies Inc.

Tyler Technologies Inc. - Overview
Tyler Technologies Inc. - Business segments
Tyler Technologies Inc. - Key offerings
Tyler Technologies Inc. - Segment focus
SWOT

16. Appendix

16.1 Scope of the report

Market definition
Objectives
Notes and caveats

16.2 Inclusions and exclusions checklist

Inclusions checklist
Exclusions checklist

16.3 Currency conversion rates for US$

16.4 Research methodology

16.5 Data procurement

Information sources

16.6 Data validation

16.7 Validation techniques employed for market sizing

16.8 Data synthesis

16.9 360 degree market analysis

16.10 List of abbreviations

Research Methodology

Technavio presents a detailed picture of the market by way of study, synthesis, and summation of data from multiple sources. The analysts have presented the various facets of the market with a particular focus on identifying the key industry influencers. The data thus presented is comprehensive, reliable, and the result of extensive research, both primary and secondary.

INFORMATION SOURCES

Primary sources

  • Manufacturers and suppliers
  • Channel partners
  • Industry experts
  • Strategic decision makers

Secondary sources

  • Industry journals and periodicals
  • Government data
  • Financial reports of key industry players
  • Historical data
  • Press releases

DATA ANALYSIS

Data Synthesis

  • Collation of data
  • Estimation of key figures
  • Analysis of derived insights

Data Validation

  • Triangulation with data models
  • Reference against proprietary databases
  • Corroboration with industry experts

REPORT WRITING

Qualitative

  • Market drivers
  • Market challenges
  • Market trends
  • Five forces analysis

Quantitative

  • Market size and forecast
  • Market segmentation
  • Geographical insights
  • Competitive landscape

Interested in this report?

Get your sample now to see our research methodology and insights!

Download Now

Frequently Asked Questions

Law Enforcement Software market growth will increase by USD 1991.2 million during 2026-2030.

The Law Enforcement Software market is expected to grow at a CAGR of 11.9% during 2026-2030.

Law Enforcement Software market is segmented by Deployment (On premises, Cloud based) Type (Software, Services) End-user (Police departments, Municipalities, Others)

Accenture PLC, Axon Enterprise Inc., Capterra Inc., CentralSquare, CODY Computer Serv Inc., Esri Global Inc., Genetec Inc., Guardian Alliance Tech Inc., Hexagon AB, LexisNexis Risk Solutions., Matrix Pointe Software, Motorola Solutions Inc., NiCE Ltd., Omnigo Software, Palantir Technologies Inc., Tyler Technologies Inc. are a few of the key vendors in the Law Enforcement Software market.

North America will register the highest growth rate of 37.2% among the other regions. Therefore, the Law Enforcement Software market in North America is expected to garner significant business opportunities for the vendors during the forecast period.

US, Canada, Mexico, Germany, UK, France, Italy, Spain, The Netherlands, China, Japan, India, South Korea, Australia, Indonesia, Brazil, Argentina, Chile, Saudi Arabia, UAE, South Africa, Egypt, Turkey

  • Increasing demand for analytics and data-driven policing is the driving factor this market.

The Law Enforcement Software market vendors should focus on grabbing business opportunities from the Deployment segment as it accounted for the largest market share in the base year.
RIA - Research AI Assistant
Ask RIA