Metal Stamping Market Analysis, Size, and Forecast 2026-2030: APAC (China, Japan, and India), Europe (Germany, France, and Italy), North America (US, Canada, and Mexico), South America (Brazil, Argentina, and Colombia), Middle East and Africa (Saudi Arabia, UAE, and South Africa), and Rest of World (ROW)

Metal Stamping Market Analysis, Size, and Forecast 2026-2030:
APAC (China, Japan, and India), Europe (Germany, France, and Italy), North America (US, Canada, and Mexico), South America (Brazil, Argentina, and Colombia), Middle East and Africa (Saudi Arabia, UAE, and South Africa), and Rest of World (ROW)

Published: Mar 2026 302 Pages SKU: IRTNTR45069

Market Overview at a Glance

$42.00 B
Market Opportunity
4.7%
CAGR 2025 - 2030
47.4%
APAC Growth
$46.79 B
Automotive segment 2024

Metal Stamping Market Size 2026-2030

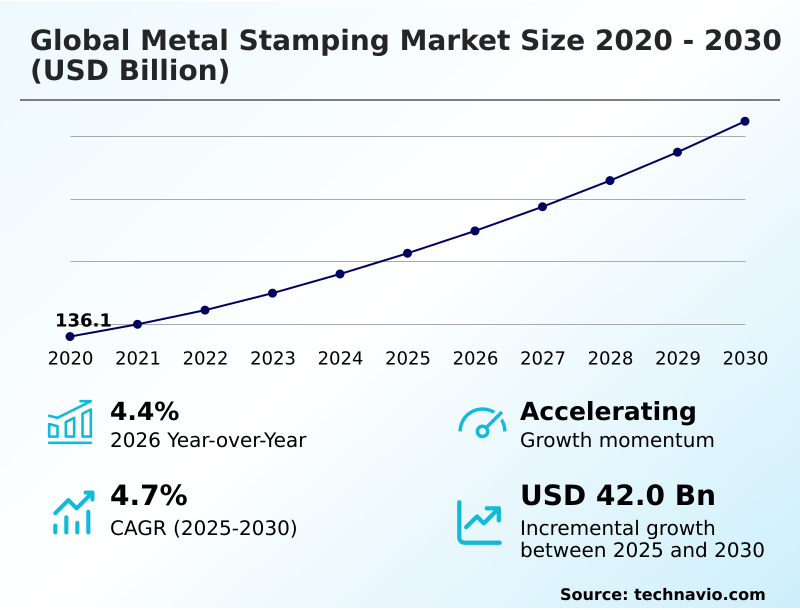
The metal stamping market size is valued to increase by USD 42.00 billion, at a CAGR of 4.7% from 2025 to 2030. Accelerated transition to EV manufacturing will drive the metal stamping market.

Major Market Trends & Insights

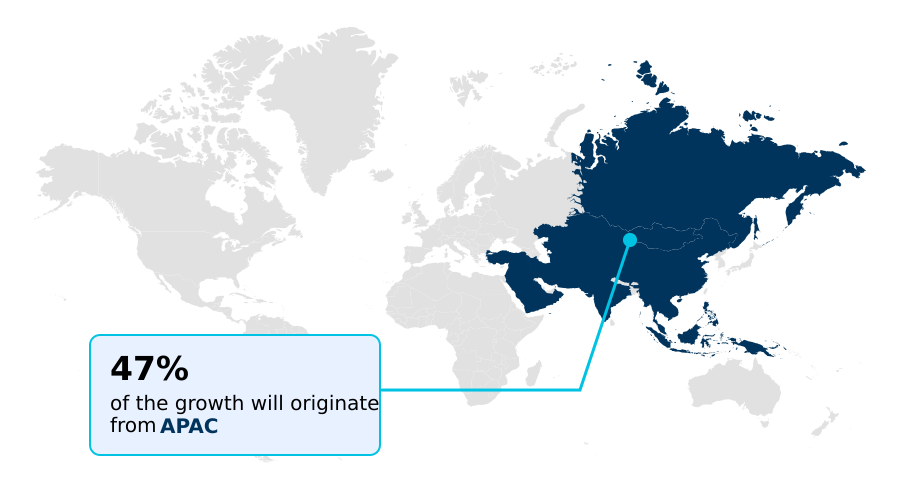
  • APAC dominated the market and accounted for a 47.4% growth during the forecast period.
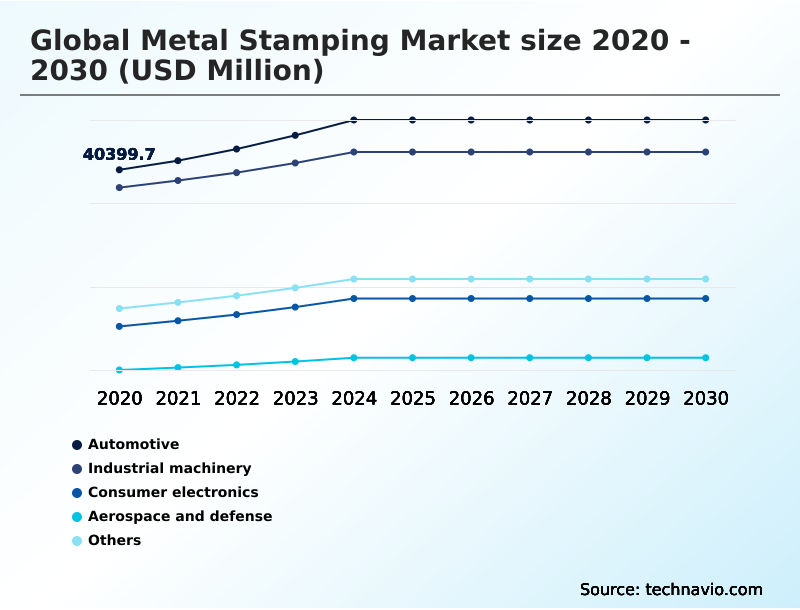
  • By End-user - Automotive segment was valued at USD 46.79 billion in 2024
  • By Material - Steel segment accounted for the largest market revenue share in 2024

Market Size & Forecast

  • Market Opportunities: USD 68.50 billion
  • Market Future Opportunities: USD 42.00 billion
  • CAGR from 2025 to 2030 : 4.7%

Market Summary

  • The metal stamping market is undergoing a significant transformation, driven by the dual pressures of technological innovation and evolving end-user demands. At its core, the industry provides essential components for sectors ranging from automotive to consumer electronics, utilizing processes that convert flat metal sheets into complex parts.
  • Key drivers include the global transition to electric vehicles, which requires specialized components like battery enclosures and lightweight structural frames, and the continuous miniaturization in electronics, demanding high-precision parts with micron-level tolerances. A major trend reshaping the landscape is the adoption of Industry 4.0 technologies.
  • For instance, a manufacturer might implement a digital twin for a new press line, allowing engineers to simulate die performance and material flow to optimize production and reduce physical trial-and-error waste by over 30% before a single component is stamped. This enhances efficiency and shortens lead times for new product introductions.
  • However, the industry faces challenges, including volatile raw material prices for steel and aluminum and a widening skills gap, as experienced tool and die makers retire without a sufficient pipeline of new talent. This dynamic environment necessitates continuous investment in both technology and workforce training to maintain a competitive edge.

What will be the Size of the Metal Stamping Market during the forecast period?

Get Key Insights on Market Forecast (PDF) Request Free Sample

How is the Metal Stamping Market Segmented?

The metal stamping industry research report provides comprehensive data (region-wise segment analysis), with forecasts and estimates in "USD million" for the period 2026-2030, as well as historical data from 2020-2024 for the following segments.

  • End-user
    • Automotive
    • Industrial machinery
    • Consumer electronics
    • Aerospace and defense
    • Others
  • Material
    • Steel
    • Aluminum
    • Copper
    • Others
  • Type
    • Progressive die stamping
    • Transfer die stamping
    • Deep draw stamping
  • Geography
    • APAC
      • China
      • Japan
      • India
    • Europe
      • Germany
      • France
      • Italy
    • North America
      • US
      • Canada
      • Mexico
    • South America
      • Brazil
      • Argentina
      • Colombia
    • Middle East and Africa
      • Saudi Arabia
      • UAE
      • South Africa
    • Rest of World (ROW)

By End-user Insights

The automotive segment is estimated to witness significant growth during the forecast period.

The automotive sector remains the primary end-user, with a pronounced shift toward electric mobility reshaping component demand.

The imperative for component lightweighting strategies to extend vehicle range drives the adoption of advanced materials, necessitating specialized high-strength steel forming and aluminum processing.

This transition demands significant investment in technologies like the hot stamping process and advanced tool and die design to produce complex electric vehicle battery enclosures and automotive body-in-white structures.

Effective die maintenance programs have become critical for managing the complex tooling, with some operators achieving a 15% reduction in unplanned downtime.

Processes such as progressive die stamping for connectors and transfer die stamping for large panels are essential for high-volume production runs supporting just-in-time delivery systems, ensuring robust structural integrity analysis standards are met.

This evolution underscores the need for continuous precision tooling manufacturing innovation.

Request Free Sample

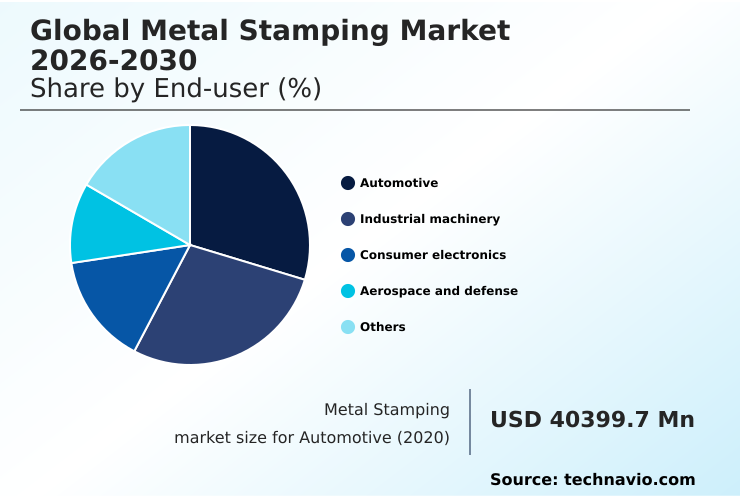
The Automotive segment was valued at USD 46.79 billion in 2024 and showed a gradual increase during the forecast period.

Request Free Sample

Regional Analysis

APAC is estimated to contribute 47.4% to the growth of the global market during the forecast period.Technavio’s analysts have elaborately explained the regional trends and drivers that shape the market during the forecast period.

See How Metal Stamping Market Demand is Rising in APAC Request Free Sample

The geographic landscape is undergoing a strategic realignment. While APAC remains the epicenter for high-volume production runs, particularly for EMI shielding components using micro stamping processes, North America and Europe are experiencing a resurgence driven by reshoring initiatives.

In these regions, the focus is on specialized applications like industrial machinery housing and tight tolerance manufacturing, where investments in energy-efficient stamping can yield operational savings of up to 12%.

Advanced techniques such as fine blanking technology and multi-slide stamping are gaining traction for complex parts. Firms are adopting robotic welding integration post-stamping, which has been shown to improve throughput by 20%.

The adoption of circular economy principles is also influencing facility design. Meanwhile, short-run stamping process specialists cater to niche markets, focusing on superior surface finish control after sheet metal blanking.

Market Dynamics

Our researchers analyzed the data with 2025 as the base year, along with the key drivers, trends, and challenges. A holistic analysis of drivers will help companies refine their marketing strategies to gain a competitive advantage.

  • The global metal stamping market's evolution is clearly visible in its specialized applications, where process optimization and material science converge. The use of progressive die stamping for electrical connectors and micro stamping for electronic lead frames is fundamental to the miniaturization of consumer electronics.
  • Similarly, precision stamping for EMI shielding cans and high-speed stamping of consumer electronics frames address the dual needs of performance and aesthetics in high-tech devices. In the automotive sector, the transition to electric mobility is driving demand for metal stamping for EV battery enclosures and deep draw stamping for battery casings.
  • Safety and lightweighting are addressed through hot stamping of advanced high-strength steel for structural reinforcements and aluminum stamping for lightweight body panels and aluminum stamping for heat exchanger fins. Large structural components are efficiently produced via transfer die stamping of automotive cross members, while high-strength steel stamping for chassis parts ensures durability.
  • The efficiency of these operations is enhanced by servo press technology for improved formability and verified by automated quality control in stamping lines. Specialized sectors rely on precision metal stamping for medical devices and custom metal stamping for aerospace parts.
  • The use of tool and die design for complex geometries enables the creation of parts for sheet metal forming for industrial enclosures. Industrial practices are also advancing with fine blanking for tight tolerance components and multi-slide stamping for complex small parts, while sheet metal fabrication for custom prototypes accelerates development cycles.
  • Firms that successfully integrate these advanced processes often report a parts-per-million defect rate that is more than 50% lower than those using conventional methods, a critical metric for supply chain planning in high-reliability sectors.

What are the key market drivers leading to the rise in the adoption of Metal Stamping Industry?

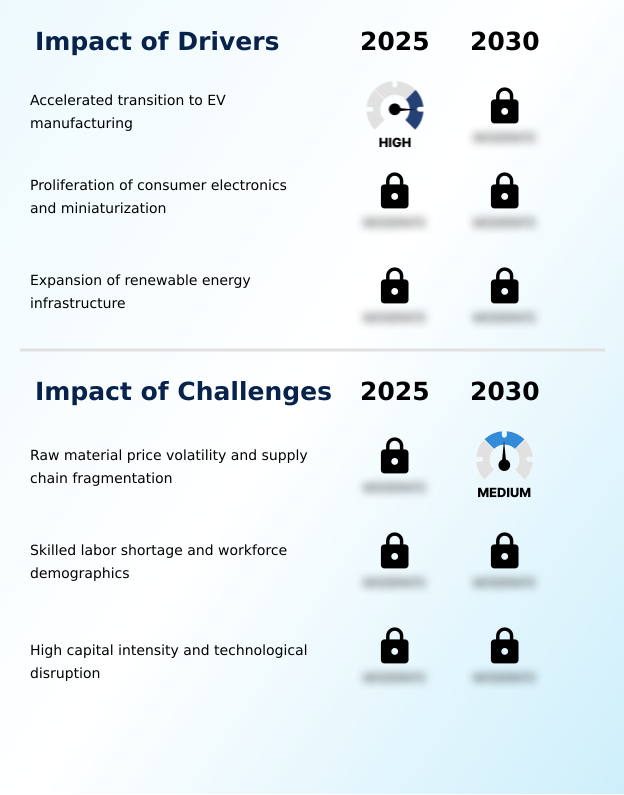
  • A primary driver for the market is the accelerated global transition toward electric vehicle manufacturing, which creates substantial demand for new, specialized stamped metal components.

  • The transition to electric vehicles and the proliferation of compact electronics are major market drivers.
  • Demand for lightweight material stamping is surging, with aluminum alloy stamping used extensively to reduce vehicle weight and improve battery range, with some new vehicle platforms achieving a 15% mass reduction through its use.
  • Concurrently, the consumer electronics sector requires high-volume precision metal stamping for items like consumer electronics chassis and thermal management solutions. Techniques such as deep draw stamping and cold forming technology are essential for complex geometry fabrication.
  • A strategic push for supply chain localization is leading to new investments in regional coil-fed stamping operations. This focus on regional production improves logistics efficiency by up to 20%.
  • The aerospace sector also contributes, requiring advanced sheet metal forming for aerospace structural components using sustainable material sourcing.

What are the market trends shaping the Metal Stamping Industry?

  • The accelerated adoption of Industry 4.0 and smart manufacturing principles is a significant trend, reshaping production economics and quality control standards across the industry.

  • The accelerated industry 4.0 integration is reshaping manufacturing, with automated stamping lines and robotic transfer systems becoming standard. Advanced metal forming simulation and digital twin simulation enable engineers to optimize processes before production, reducing trial-and-error waste by up to 25%. The use of in-die sensor technology allows for real-time monitoring, which supports predictive maintenance scheduling and improves production line efficiency.
  • Furthermore, the deployment of servo press technology provides greater control over the forming process, which is critical for zero-defect quality control. AI-powered automated quality inspection systems can detect microscopic flaws, increasing defect detection rates by over 40% compared to manual methods. These innovations drive cost-per-part optimization and support effective scrap reduction methods.

What challenges does the Metal Stamping Industry face during its growth?

  • Significant challenges affecting industry growth include persistent raw material price volatility and increasing supply chain fragmentation, which impact operational costs and planning.

  • Key market challenges include raw material price volatility and a persistent skilled labor gap, which can increase operational costs by 10-15% annually. The industry's shift toward processing advanced high-strength steel and ultra-high-strength steel requires substantial capital investment in high-tonnage press operations and specialized techniques like the press hardening process.
  • Proper material formability analysis and advanced stamping lubrication technology are now critical for achieving micron-level precision without defects. This technological shift intensifies the need for workforce skill development programs. Small and medium-sized enterprises, particularly those in custom metal fabrication, struggle to finance these upgrades, impacting their ability to compete on projects requiring short lead times, such as medical device implants.
  • These firms find that inadequate access to rapid prototyping methods can extend project timelines by over 30%, hindering their ability to improve material utilization rate and achieve reduced tooling lead times.

Exclusive Technavio Analysis on Customer Landscape

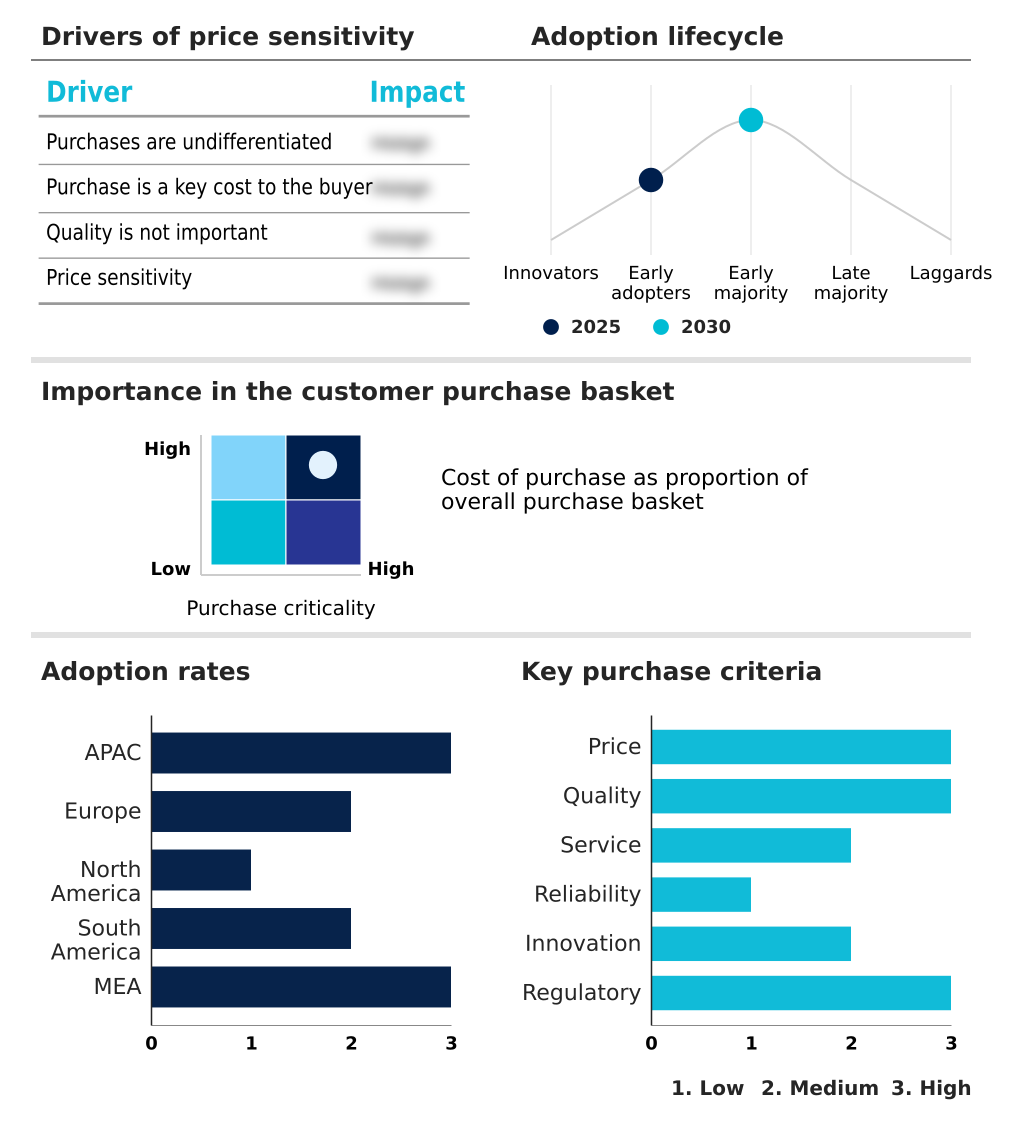
The metal stamping market forecasting report includes the adoption lifecycle of the market, covering from the innovator’s stage to the laggard’s stage. It focuses on adoption rates in different regions based on penetration. Furthermore, the metal stamping market report also includes key purchase criteria and drivers of price sensitivity to help companies evaluate and develop their market growth analysis strategies.

Customer Landscape of Metal Stamping Industry

Competitive Landscape

Companies are implementing various strategies, such as strategic alliances, metal stamping market forecast, partnerships, mergers and acquisitions, geographical expansion, and product/service launches, to enhance their presence in the industry.

AAPICO Hitech Public Co. Ltd. - Offerings include precision-stamped automotive body components, structural assemblies, and other formed metal parts tailored for vehicle manufacturing and assembly operations.

The industry research and growth report includes detailed analyses of the competitive landscape of the market and information about key companies, including:

  • AAPICO Hitech Public Co. Ltd.
  • American Axle Manufacturing
  • American Industrial Co.
  • Caparo Group
  • CIE Automotive SA
  • Clow Stamping Co.
  • D and H Industries Inc.
  • Gestamp Automocion SA
  • Goshen Stamping Co.
  • Harvey Vogel Manufacturing Co.
  • Kenmode Inc.
  • Klesk Metal Stamping Co.
  • KOBAKIN J Co. Ltd.
  • Magna International Inc.
  • Manor Tool and Manufacturing
  • Metrican Stamping Co.
  • Nelson Miller
  • Tempco Manufacturing Co. Inc.
  • thyssenkrupp AG
  • Wiegel Tool Works Inc.

Qualitative and quantitative analysis of companies has been conducted to help clients understand the wider business environment as well as the strengths and weaknesses of key industry players. Data is qualitatively analyzed to categorize companies as pure play, category-focused, industry-focused, and diversified; it is quantitatively analyzed to categorize companies as dominant, leading, strong, tentative, and weak.

Recent Development and News in Metal stamping market

  • In October, 2024, Tata Advanced Systems commenced full-scale assembly operations at its final assembly line for the C295 military transport aircraft, driving demand for locally stamped aerostructure components.
  • In February, 2025, Toyota Battery Manufacturing North Carolina officially began commercial shipments of lithium-ion batteries, utilizing large-scale metal stamping to fabricate metallic cases and module frames.
  • In April, 2025, Gestamp implemented a comprehensive digital twin and smart sensor pilot program across its production lines to capture real-time data and enhance precision in automotive components.
  • In May, 2025, The Boeing Co. reported operational delays linked to a shortage of specialized machinists and metal forming professionals, highlighting a critical labor challenge affecting the aerospace supply chain.

Dive into Technavio’s robust research methodology, blending expert interviews, extensive data synthesis, and validated models for unparalleled Metal Stamping Market insights. See full methodology.

Market Scope
Page number 302
Base year 2025
Historic period 2020-2024
Forecast period 2026-2030
Growth momentum & CAGR Accelerate at a CAGR of 4.7%
Market growth 2026-2030 USD 42003.5 million
Market structure Fragmented
YoY growth 2025-2026(%) 4.4%
Key countries China, Japan, India, South Korea, Indonesia, Australia, Germany, France, Italy, UK, Spain, The Netherlands, US, Canada, Mexico, Brazil, Argentina, Colombia, Saudi Arabia, UAE, South Africa, Egypt and Nigeria
Competitive landscape Leading Companies, Market Positioning of Companies, Competitive Strategies, and Industry Risks

Request Free Sample

Research Analyst Overview

  • The metal stamping market is advancing beyond traditional manufacturing through the integration of sophisticated technologies. Core processes like progressive die stamping, transfer die stamping, and deep draw stamping are being refined with innovations such as servo press technology and automated stamping lines.
  • A critical trend influencing boardroom strategy is the adoption of metal forming simulation, which allows for material formability analysis before capital-intensive tool and die design begins, significantly de-risking new product launches.
  • The industry’s ability to work with advanced high-strength steel and ultra-high-strength steel using methods like the hot stamping process and press hardening process is pivotal for the automotive sector's lightweighting goals. Companies are leveraging in-die sensor technology and robotic transfer systems to achieve zero-defect quality control, with some achieving a 99.9% success rate on critical components.
  • This evolution requires robust die maintenance programs and advanced stamping lubrication technology.
  • The market also includes specialized techniques such as fine blanking technology, multi-slide stamping, cold forming technology, micro stamping processes, and short-run stamping process for niche applications, supported by precision tooling manufacturing, robotic welding integration, scrap reduction methods, superior surface finish control, sheet metal blanking, and high-tonnage press operations for custom metal fabrication and lightweight material stamping through coil-fed stamping operations.

What are the Key Data Covered in this Metal Stamping Market Research and Growth Report?

  • What is the expected growth of the Metal Stamping Market between 2026 and 2030?

    • USD 42.00 billion, at a CAGR of 4.7%

  • What segmentation does the market report cover?

    • The report is segmented by End-user (Automotive, Industrial machinery, Consumer electronics, Aerospace and defense, and Others), Material (Steel, Aluminum, Copper, and Others), Type (Progressive die stamping, Transfer die stamping, and Deep draw stamping) and Geography (APAC, Europe, North America, South America, Middle East and Africa)

  • Which regions are analyzed in the report?

    • APAC, Europe, North America, South America and Middle East and Africa

  • What are the key growth drivers and market challenges?

    • Accelerated transition to EV manufacturing, Raw material price volatility and supply chain fragmentation

  • Who are the major players in the Metal Stamping Market?

    • AAPICO Hitech Public Co. Ltd., American Axle Manufacturing, American Industrial Co., Caparo Group, CIE Automotive SA, Clow Stamping Co., D and H Industries Inc., Gestamp Automocion SA, Goshen Stamping Co., Harvey Vogel Manufacturing Co., Kenmode Inc., Klesk Metal Stamping Co., KOBAKIN J Co. Ltd., Magna International Inc., Manor Tool and Manufacturing, Metrican Stamping Co., Nelson Miller, Tempco Manufacturing Co. Inc., thyssenkrupp AG and Wiegel Tool Works Inc.

Market Research Insights

  • The metal stamping market is characterized by dynamic shifts driven by technological adoption and supply chain realignment. The integration of industry 4.0 integration and digital twin simulation is improving production line efficiency, with some operators reporting a 15% increase in output from existing press lines.
  • A strategic emphasis on supply chain localization is shortening just-in-time delivery systems, reducing logistics-related costs by up to 20% in certain automotive corridors. This is particularly crucial for manufacturing electric vehicle battery enclosures and automotive body-in-white components.
  • Furthermore, the push for sustainable material sourcing and circular economy principles is influencing procurement, improving material utilization rate and creating new value from recycled metals. These dynamics are compelling firms to invest in workforce skill development to manage more sophisticated automated systems.

We can help! Our analysts can customize this metal stamping market research report to meet your requirements.

Get in touch

1. Executive Summary

1.1 Market overview

Executive Summary - Chart on Market Overview
Executive Summary - Data Table on Market Overview
Executive Summary - Chart on Global Market Characteristics
Executive Summary - Chart on Market by Geography
Executive Summary - Chart on Market Segmentation by End-user
Executive Summary - Chart on Market Segmentation by Material
Executive Summary - Chart on Market Segmentation by Type
Executive Summary - Chart on Incremental Growth
Executive Summary - Data Table on Incremental Growth
Executive Summary - Chart on Company Market Positioning

2. Technavio Analysis

2.1 Analysis of price sensitivity, lifecycle, customer purchase basket, adoption rates, and purchase criteria

2.2 Criticality of inputs and Factors of differentiation

Chart on Overview on criticality of inputs and factors of differentiation

2.3 Factors of disruption

Chart on Overview on factors of disruption

2.4 Impact of drivers and challenges

Chart on Impact of drivers and challenges in 2025 and 2030

3. Market Landscape

3.1 Market ecosystem

Chart on Parent Market
Data Table on - Parent Market

3.2 Market characteristics

Chart on Market characteristics analysis

3.3 Value chain analysis

Chart on Value chain analysis

4. Market Sizing

4.1 Market definition

Data Table on Offerings of companies included in the market definition

4.2 Market segment analysis

Market segments

4.3 Market size 2025

4.4 Market outlook: Forecast for 2025-2030

Chart on Global - Market size and forecast 2025-2030 ($ million)
Data Table on Global - Market size and forecast 2025-2030 ($ million)
Chart on Global Market: Year-over-year growth 2025-2030 (%)
Data Table on Global Market: Year-over-year growth 2025-2030 (%)

5. Historic Market Size

5.1 Global Metal Stamping Market 2020 - 2024

Historic Market Size - Data Table on Global Metal Stamping Market 2020 - 2024 ($ million)

5.2 End-user segment analysis 2020 - 2024

Historic Market Size - End-user Segment 2020 - 2024 ($ million)

5.3 Material segment analysis 2020 - 2024

Historic Market Size - Material Segment 2020 - 2024 ($ million)

5.4 Type segment analysis 2020 - 2024

Historic Market Size - Type Segment 2020 - 2024 ($ million)

5.5 Geography segment analysis 2020 - 2024

Historic Market Size - Geography Segment 2020 - 2024 ($ million)

5.6 Country segment analysis 2020 - 2024

Historic Market Size - Country Segment 2020 - 2024 ($ million)

6. Qualitative Analysis

6.1 Impact of AI on Global Metal Stamping Market

7. Five Forces Analysis

7.1 Five forces summary

Five forces analysis - Comparison between 2025 and 2030

7.2 Bargaining power of buyers

Bargaining power of buyers - Impact of key factors 2025 and 2030

7.3 Bargaining power of suppliers

Bargaining power of suppliers - Impact of key factors in 2025 and 2030

7.4 Threat of new entrants

Threat of new entrants - Impact of key factors in 2025 and 2030

7.5 Threat of substitutes

Threat of substitutes - Impact of key factors in 2025 and 2030

7.6 Threat of rivalry

Threat of rivalry - Impact of key factors in 2025 and 2030

7.7 Market condition

Chart on Market condition - Five forces 2025 and 2030

8. Market Segmentation by End-user

8.1 Market segments

Chart on End-user - Market share 2025-2030 (%)
Data Table on End-user - Market share 2025-2030 (%)

8.2 Comparison by End-user

Chart on Comparison by End-user
Data Table on Comparison by End-user

8.3 Automotive - Market size and forecast 2025-2030

Chart on Automotive - Market size and forecast 2025-2030 ($ million)
Data Table on Automotive - Market size and forecast 2025-2030 ($ million)
Chart on Automotive - Year-over-year growth 2025-2030 (%)
Data Table on Automotive - Year-over-year growth 2025-2030 (%)

8.4 Industrial machinery - Market size and forecast 2025-2030

Chart on Industrial machinery - Market size and forecast 2025-2030 ($ million)
Data Table on Industrial machinery - Market size and forecast 2025-2030 ($ million)
Chart on Industrial machinery - Year-over-year growth 2025-2030 (%)
Data Table on Industrial machinery - Year-over-year growth 2025-2030 (%)

8.5 Consumer electronics - Market size and forecast 2025-2030

Chart on Consumer electronics - Market size and forecast 2025-2030 ($ million)
Data Table on Consumer electronics - Market size and forecast 2025-2030 ($ million)
Chart on Consumer electronics - Year-over-year growth 2025-2030 (%)
Data Table on Consumer electronics - Year-over-year growth 2025-2030 (%)

8.6 Aerospace and defense - Market size and forecast 2025-2030

Chart on Aerospace and defense - Market size and forecast 2025-2030 ($ million)
Data Table on Aerospace and defense - Market size and forecast 2025-2030 ($ million)
Chart on Aerospace and defense - Year-over-year growth 2025-2030 (%)
Data Table on Aerospace and defense - Year-over-year growth 2025-2030 (%)

8.7 Others - Market size and forecast 2025-2030

Chart on Others - Market size and forecast 2025-2030 ($ million)
Data Table on Others - Market size and forecast 2025-2030 ($ million)
Chart on Others - Year-over-year growth 2025-2030 (%)
Data Table on Others - Year-over-year growth 2025-2030 (%)

8.8 Market opportunity by End-user

Market opportunity by End-user ($ million)
Data Table on Market opportunity by End-user ($ million)

9. Market Segmentation by Material

9.1 Market segments

Chart on Material - Market share 2025-2030 (%)
Data Table on Material - Market share 2025-2030 (%)

9.2 Comparison by Material

Chart on Comparison by Material
Data Table on Comparison by Material

9.3 Steel - Market size and forecast 2025-2030

Chart on Steel - Market size and forecast 2025-2030 ($ million)
Data Table on Steel - Market size and forecast 2025-2030 ($ million)
Chart on Steel - Year-over-year growth 2025-2030 (%)
Data Table on Steel - Year-over-year growth 2025-2030 (%)

9.4 Aluminum - Market size and forecast 2025-2030

Chart on Aluminum - Market size and forecast 2025-2030 ($ million)
Data Table on Aluminum - Market size and forecast 2025-2030 ($ million)
Chart on Aluminum - Year-over-year growth 2025-2030 (%)
Data Table on Aluminum - Year-over-year growth 2025-2030 (%)

9.5 Copper - Market size and forecast 2025-2030

Chart on Copper - Market size and forecast 2025-2030 ($ million)
Data Table on Copper - Market size and forecast 2025-2030 ($ million)
Chart on Copper - Year-over-year growth 2025-2030 (%)
Data Table on Copper - Year-over-year growth 2025-2030 (%)

9.6 Others - Market size and forecast 2025-2030

Chart on Others - Market size and forecast 2025-2030 ($ million)
Data Table on Others - Market size and forecast 2025-2030 ($ million)
Chart on Others - Year-over-year growth 2025-2030 (%)
Data Table on Others - Year-over-year growth 2025-2030 (%)

9.7 Market opportunity by Material

Market opportunity by Material ($ million)
Data Table on Market opportunity by Material ($ million)

10. Market Segmentation by Type

10.1 Market segments

Chart on Type - Market share 2025-2030 (%)
Data Table on Type - Market share 2025-2030 (%)

10.2 Comparison by Type

Chart on Comparison by Type
Data Table on Comparison by Type

10.3 Progressive die stamping - Market size and forecast 2025-2030

Chart on Progressive die stamping - Market size and forecast 2025-2030 ($ million)
Data Table on Progressive die stamping - Market size and forecast 2025-2030 ($ million)
Chart on Progressive die stamping - Year-over-year growth 2025-2030 (%)
Data Table on Progressive die stamping - Year-over-year growth 2025-2030 (%)

10.4 Transfer die stamping - Market size and forecast 2025-2030

Chart on Transfer die stamping - Market size and forecast 2025-2030 ($ million)
Data Table on Transfer die stamping - Market size and forecast 2025-2030 ($ million)
Chart on Transfer die stamping - Year-over-year growth 2025-2030 (%)
Data Table on Transfer die stamping - Year-over-year growth 2025-2030 (%)

10.5 Deep draw stamping - Market size and forecast 2025-2030

Chart on Deep draw stamping - Market size and forecast 2025-2030 ($ million)
Data Table on Deep draw stamping - Market size and forecast 2025-2030 ($ million)
Chart on Deep draw stamping - Year-over-year growth 2025-2030 (%)
Data Table on Deep draw stamping - Year-over-year growth 2025-2030 (%)

10.6 Market opportunity by Type

Market opportunity by Type ($ million)
Data Table on Market opportunity by Type ($ million)

11. Customer Landscape

11.1 Customer landscape overview

Analysis of price sensitivity, lifecycle, customer purchase basket, adoption rates, and purchase criteria

12. Geographic Landscape

12.1 Geographic segmentation

Chart on Market share by geography 2025-2030 (%)
Data Table on Market share by geography 2025-2030 (%)

12.2 Geographic comparison

Chart on Geographic comparison
Data Table on Geographic comparison

12.3 APAC - Market size and forecast 2025-2030

Chart on APAC - Market size and forecast 2025-2030 ($ million)
Data Table on APAC - Market size and forecast 2025-2030 ($ million)
Chart on APAC - Year-over-year growth 2025-2030 (%)
Data Table on APAC - Year-over-year growth 2025-2030 (%)
Chart on Regional Comparison - APAC
Data Table on Regional Comparison - APAC

12.3.1 China - Market size and forecast 2025-2030

Chart on China - Market size and forecast 2025-2030 ($ million)
Data Table on China - Market size and forecast 2025-2030 ($ million)
Chart on China - Year-over-year growth 2025-2030 (%)
Data Table on China - Year-over-year growth 2025-2030 (%)

12.3.2 Japan - Market size and forecast 2025-2030

Chart on Japan - Market size and forecast 2025-2030 ($ million)
Data Table on Japan - Market size and forecast 2025-2030 ($ million)
Chart on Japan - Year-over-year growth 2025-2030 (%)
Data Table on Japan - Year-over-year growth 2025-2030 (%)

12.3.3 India - Market size and forecast 2025-2030

Chart on India - Market size and forecast 2025-2030 ($ million)
Data Table on India - Market size and forecast 2025-2030 ($ million)
Chart on India - Year-over-year growth 2025-2030 (%)
Data Table on India - Year-over-year growth 2025-2030 (%)

12.3.4 South Korea - Market size and forecast 2025-2030

Chart on South Korea - Market size and forecast 2025-2030 ($ million)
Data Table on South Korea - Market size and forecast 2025-2030 ($ million)
Chart on South Korea - Year-over-year growth 2025-2030 (%)
Data Table on South Korea - Year-over-year growth 2025-2030 (%)

12.3.5 Indonesia - Market size and forecast 2025-2030

Chart on Indonesia - Market size and forecast 2025-2030 ($ million)
Data Table on Indonesia - Market size and forecast 2025-2030 ($ million)
Chart on Indonesia - Year-over-year growth 2025-2030 (%)
Data Table on Indonesia - Year-over-year growth 2025-2030 (%)

12.3.6 Australia - Market size and forecast 2025-2030

Chart on Australia - Market size and forecast 2025-2030 ($ million)
Data Table on Australia - Market size and forecast 2025-2030 ($ million)
Chart on Australia - Year-over-year growth 2025-2030 (%)
Data Table on Australia - Year-over-year growth 2025-2030 (%)

12.4 Europe - Market size and forecast 2025-2030

Chart on Europe - Market size and forecast 2025-2030 ($ million)
Data Table on Europe - Market size and forecast 2025-2030 ($ million)
Chart on Europe - Year-over-year growth 2025-2030 (%)
Data Table on Europe - Year-over-year growth 2025-2030 (%)
Chart on Regional Comparison - Europe
Data Table on Regional Comparison - Europe

12.4.1 Germany - Market size and forecast 2025-2030

Chart on Germany - Market size and forecast 2025-2030 ($ million)
Data Table on Germany - Market size and forecast 2025-2030 ($ million)
Chart on Germany - Year-over-year growth 2025-2030 (%)
Data Table on Germany - Year-over-year growth 2025-2030 (%)

12.4.2 France - Market size and forecast 2025-2030

Chart on France - Market size and forecast 2025-2030 ($ million)
Data Table on France - Market size and forecast 2025-2030 ($ million)
Chart on France - Year-over-year growth 2025-2030 (%)
Data Table on France - Year-over-year growth 2025-2030 (%)

12.4.3 Italy - Market size and forecast 2025-2030

Chart on Italy - Market size and forecast 2025-2030 ($ million)
Data Table on Italy - Market size and forecast 2025-2030 ($ million)
Chart on Italy - Year-over-year growth 2025-2030 (%)
Data Table on Italy - Year-over-year growth 2025-2030 (%)

12.4.4 UK - Market size and forecast 2025-2030

Chart on UK - Market size and forecast 2025-2030 ($ million)
Data Table on UK - Market size and forecast 2025-2030 ($ million)
Chart on UK - Year-over-year growth 2025-2030 (%)
Data Table on UK - Year-over-year growth 2025-2030 (%)

12.4.5 Spain - Market size and forecast 2025-2030

Chart on Spain - Market size and forecast 2025-2030 ($ million)
Data Table on Spain - Market size and forecast 2025-2030 ($ million)
Chart on Spain - Year-over-year growth 2025-2030 (%)
Data Table on Spain - Year-over-year growth 2025-2030 (%)

12.4.6 The Netherlands - Market size and forecast 2025-2030

Chart on The Netherlands - Market size and forecast 2025-2030 ($ million)
Data Table on The Netherlands - Market size and forecast 2025-2030 ($ million)
Chart on The Netherlands - Year-over-year growth 2025-2030 (%)
Data Table on The Netherlands - Year-over-year growth 2025-2030 (%)

12.5 North America - Market size and forecast 2025-2030

Chart on North America - Market size and forecast 2025-2030 ($ million)
Data Table on North America - Market size and forecast 2025-2030 ($ million)
Chart on North America - Year-over-year growth 2025-2030 (%)
Data Table on North America - Year-over-year growth 2025-2030 (%)
Chart on Regional Comparison - North America
Data Table on Regional Comparison - North America

12.5.1 US - Market size and forecast 2025-2030

Chart on US - Market size and forecast 2025-2030 ($ million)
Data Table on US - Market size and forecast 2025-2030 ($ million)
Chart on US - Year-over-year growth 2025-2030 (%)
Data Table on US - Year-over-year growth 2025-2030 (%)

12.5.2 Canada - Market size and forecast 2025-2030

Chart on Canada - Market size and forecast 2025-2030 ($ million)
Data Table on Canada - Market size and forecast 2025-2030 ($ million)
Chart on Canada - Year-over-year growth 2025-2030 (%)
Data Table on Canada - Year-over-year growth 2025-2030 (%)

12.5.3 Mexico - Market size and forecast 2025-2030

Chart on Mexico - Market size and forecast 2025-2030 ($ million)
Data Table on Mexico - Market size and forecast 2025-2030 ($ million)
Chart on Mexico - Year-over-year growth 2025-2030 (%)
Data Table on Mexico - Year-over-year growth 2025-2030 (%)

12.6 South America - Market size and forecast 2025-2030

Chart on South America - Market size and forecast 2025-2030 ($ million)
Data Table on South America - Market size and forecast 2025-2030 ($ million)
Chart on South America - Year-over-year growth 2025-2030 (%)
Data Table on South America - Year-over-year growth 2025-2030 (%)
Chart on Regional Comparison - South America
Data Table on Regional Comparison - South America

12.6.1 Brazil - Market size and forecast 2025-2030

Chart on Brazil - Market size and forecast 2025-2030 ($ million)
Data Table on Brazil - Market size and forecast 2025-2030 ($ million)
Chart on Brazil - Year-over-year growth 2025-2030 (%)
Data Table on Brazil - Year-over-year growth 2025-2030 (%)

12.6.2 Argentina - Market size and forecast 2025-2030

Chart on Argentina - Market size and forecast 2025-2030 ($ million)
Data Table on Argentina - Market size and forecast 2025-2030 ($ million)
Chart on Argentina - Year-over-year growth 2025-2030 (%)
Data Table on Argentina - Year-over-year growth 2025-2030 (%)

12.6.3 Colombia - Market size and forecast 2025-2030

Chart on Colombia - Market size and forecast 2025-2030 ($ million)
Data Table on Colombia - Market size and forecast 2025-2030 ($ million)
Chart on Colombia - Year-over-year growth 2025-2030 (%)
Data Table on Colombia - Year-over-year growth 2025-2030 (%)

12.7 Middle East and Africa - Market size and forecast 2025-2030

Chart on Middle East and Africa - Market size and forecast 2025-2030 ($ million)
Data Table on Middle East and Africa - Market size and forecast 2025-2030 ($ million)
Chart on Middle East and Africa - Year-over-year growth 2025-2030 (%)
Data Table on Middle East and Africa - Year-over-year growth 2025-2030 (%)
Chart on Regional Comparison - Middle East and Africa
Data Table on Regional Comparison - Middle East and Africa

12.7.1 Saudi Arabia - Market size and forecast 2025-2030

Chart on Saudi Arabia - Market size and forecast 2025-2030 ($ million)
Data Table on Saudi Arabia - Market size and forecast 2025-2030 ($ million)
Chart on Saudi Arabia - Year-over-year growth 2025-2030 (%)
Data Table on Saudi Arabia - Year-over-year growth 2025-2030 (%)

12.7.2 UAE - Market size and forecast 2025-2030

Chart on UAE - Market size and forecast 2025-2030 ($ million)
Data Table on UAE - Market size and forecast 2025-2030 ($ million)
Chart on UAE - Year-over-year growth 2025-2030 (%)
Data Table on UAE - Year-over-year growth 2025-2030 (%)

12.7.3 South Africa - Market size and forecast 2025-2030

Chart on South Africa - Market size and forecast 2025-2030 ($ million)
Data Table on South Africa - Market size and forecast 2025-2030 ($ million)
Chart on South Africa - Year-over-year growth 2025-2030 (%)
Data Table on South Africa - Year-over-year growth 2025-2030 (%)

12.7.4 Egypt - Market size and forecast 2025-2030

Chart on Egypt - Market size and forecast 2025-2030 ($ million)
Data Table on Egypt - Market size and forecast 2025-2030 ($ million)
Chart on Egypt - Year-over-year growth 2025-2030 (%)
Data Table on Egypt - Year-over-year growth 2025-2030 (%)

12.7.5 Nigeria - Market size and forecast 2025-2030

Chart on Nigeria - Market size and forecast 2025-2030 ($ million)
Data Table on Nigeria - Market size and forecast 2025-2030 ($ million)
Chart on Nigeria - Year-over-year growth 2025-2030 (%)
Data Table on Nigeria - Year-over-year growth 2025-2030 (%)

12.8 Market opportunity by geography

Market opportunity by geography ($ million)
Data Tables on Market opportunity by geography ($ million)

13. Drivers, Challenges, and Opportunity

13.1 Market drivers

Accelerated transition to EV manufacturing
Proliferation of consumer electronics and miniaturization
Expansion of renewable energy infrastructure

13.2 Market challenges

Raw material price volatility and supply chain fragmentation
Skilled labor shortage and workforce demographics
High capital intensity and technological disruption

13.3 Impact of drivers and challenges

Impact of drivers and challenges in 2025 and 2030

13.4 Market opportunities

Accelerated adoption of industry 4.0 and smart manufacturing
Strategic localization and supply chain resilience
Shift towards lightweighting and sustainable materials

14. Competitive Landscape

14.1 Overview

14.2

Overview on criticality of inputs and factors of differentiation

14.3 Landscape disruption

Overview on factors of disruption

14.4 Industry risks

Impact of key risks on business

15. Competitive Analysis

15.1 Companies profiled

Companies covered

15.2 Company ranking index

15.3 Market positioning of companies

Matrix on companies position and classification

15.4 AAPICO Hitech Public Co. Ltd.

AAPICO Hitech Public Co. Ltd. - Overview
AAPICO Hitech Public Co. Ltd. - Business segments
AAPICO Hitech Public Co. Ltd. - Key offerings
AAPICO Hitech Public Co. Ltd. - Segment focus
SWOT

15.5 American Axle Manufacturing

American Axle Manufacturing - Overview
American Axle Manufacturing - Business segments
American Axle Manufacturing - Key news
American Axle Manufacturing - Key offerings
American Axle Manufacturing - Segment focus
SWOT

15.6 American Industrial Co.

American Industrial Co. - Overview
American Industrial Co. - Product / Service
American Industrial Co. - Key offerings
SWOT

15.7 Caparo Group

Caparo Group - Overview
Caparo Group - Product / Service
Caparo Group - Key offerings
SWOT

15.8 CIE Automotive SA

CIE Automotive SA - Overview
CIE Automotive SA - Product / Service
CIE Automotive SA - Key offerings
SWOT

15.9 D and H Industries Inc.

D and H Industries Inc. - Overview
D and H Industries Inc. - Product / Service
D and H Industries Inc. - Key offerings
SWOT

15.10 Gestamp Automocion SA

Gestamp Automocion SA - Overview
Gestamp Automocion SA - Business segments
Gestamp Automocion SA - Key offerings
Gestamp Automocion SA - Segment focus
SWOT

15.11 Harvey Vogel Manufacturing Co.

Harvey Vogel Manufacturing Co. - Overview
Harvey Vogel Manufacturing Co. - Product / Service
Harvey Vogel Manufacturing Co. - Key offerings
SWOT

15.12 Kenmode Inc.

Kenmode Inc. - Overview
Kenmode Inc. - Product / Service
Kenmode Inc. - Key offerings
SWOT

15.13 Klesk Metal Stamping Co.

Klesk Metal Stamping Co. - Overview
Klesk Metal Stamping Co. - Product / Service
Klesk Metal Stamping Co. - Key offerings
SWOT

15.14 Magna International Inc.

Magna International Inc. - Overview
Magna International Inc. - Business segments
Magna International Inc. - Key news
Magna International Inc. - Key offerings
Magna International Inc. - Segment focus
SWOT

15.15 Metrican Stamping Co.

Metrican Stamping Co. - Overview
Metrican Stamping Co. - Product / Service
Metrican Stamping Co. - Key offerings
SWOT

15.16 Nelson Miller

Nelson Miller - Overview
Nelson Miller - Product / Service
Nelson Miller - Key offerings
SWOT

15.17 Tempco Manufacturing Co. Inc.

Tempco Manufacturing Co. Inc. - Overview
Tempco Manufacturing Co. Inc. - Product / Service
Tempco Manufacturing Co. Inc. - Key offerings
SWOT

15.18 Wiegel Tool Works Inc.

Wiegel Tool Works Inc. - Overview
Wiegel Tool Works Inc. - Product / Service
Wiegel Tool Works Inc. - Key offerings
SWOT

16. Appendix

16.1 Scope of the report

Market definition
Objectives
Notes and caveats

16.2 Inclusions and exclusions checklist

Inclusions checklist
Exclusions checklist

16.3 Currency conversion rates for US$

16.4 Research methodology

16.5 Data procurement

Information sources

16.6 Data validation

16.7 Validation techniques employed for market sizing

16.8 Data synthesis

16.9 360 degree market analysis

16.10 List of abbreviations

Research Methodology

Technavio presents a detailed picture of the market by way of study, synthesis, and summation of data from multiple sources. The analysts have presented the various facets of the market with a particular focus on identifying the key industry influencers. The data thus presented is comprehensive, reliable, and the result of extensive research, both primary and secondary.

INFORMATION SOURCES

Primary sources

  • Manufacturers and suppliers
  • Channel partners
  • Industry experts
  • Strategic decision makers

Secondary sources

  • Industry journals and periodicals
  • Government data
  • Financial reports of key industry players
  • Historical data
  • Press releases

DATA ANALYSIS

Data Synthesis

  • Collation of data
  • Estimation of key figures
  • Analysis of derived insights

Data Validation

  • Triangulation with data models
  • Reference against proprietary databases
  • Corroboration with industry experts

REPORT WRITING

Qualitative

  • Market drivers
  • Market challenges
  • Market trends
  • Five forces analysis

Quantitative

  • Market size and forecast
  • Market segmentation
  • Geographical insights
  • Competitive landscape

Interested in this report?

Get your sample now to see our research methodology and insights!

Download Now

Frequently Asked Questions

Metal Stamping market growth will increase by USD 42003.5 million during 2026-2030.

The Metal Stamping market is expected to grow at a CAGR of 4.7% during 2026-2030.

Metal Stamping market is segmented by End-user (Automotive, Industrial machinery, Consumer electronics, Aerospace and defense, Others) Material (Steel, Aluminum, Copper, Others) Type (Progressive die stamping, Transfer die stamping, Deep draw stamping)

AAPICO Hitech Public Co. Ltd., American Axle Manufacturing, American Industrial Co., Caparo Group, CIE Automotive SA, Clow Stamping Co., D and H Industries Inc., Gestamp Automocion SA, Goshen Stamping Co., Harvey Vogel Manufacturing Co., Kenmode Inc., Klesk Metal Stamping Co., KOBAKIN J Co. Ltd., Magna International Inc., Manor Tool and Manufacturing, Metrican Stamping Co., Nelson Miller, Tempco Manufacturing Co. Inc., thyssenkrupp AG, Wiegel Tool Works Inc. are a few of the key vendors in the Metal Stamping market.

APAC will register the highest growth rate of 47.4% among the other regions. Therefore, the Metal Stamping market in APAC is expected to garner significant business opportunities for the vendors during the forecast period.

China, Japan, India, South Korea, Indonesia, Australia, Germany, France, Italy, UK, Spain, The Netherlands, US, Canada, Mexico, Brazil, Argentina, Colombia, Saudi Arabia, UAE, South Africa, Egypt, Nigeria

  • Accelerated transition to EV manufacturing is the driving factor this market.

The Metal Stamping market vendors should focus on grabbing business opportunities from the End-user segment as it accounted for the largest market share in the base year.
RIA - Research AI Assistant
Ask RIA