Metrology Services Market Analysis Europe, APAC, North America, South America, Middle East and Africa - US, Canada, China, Germany, UK - Size and Forecast 2024-2028

Metrology Services Market Analysis Europe, APAC, North America, South America, Middle East and Africa - US, Canada, China, Germany, UK - Size and Forecast 2024-2028

Published: Oct 2023 168 Pages SKU: IRTNTR72371

Market Overview at a Glance

$1.20 B
Market Opportunity
14.72%
CAGR
14.22
YoY growth 2023-2024(%)

Metrology Services Market Size 2024-2028 

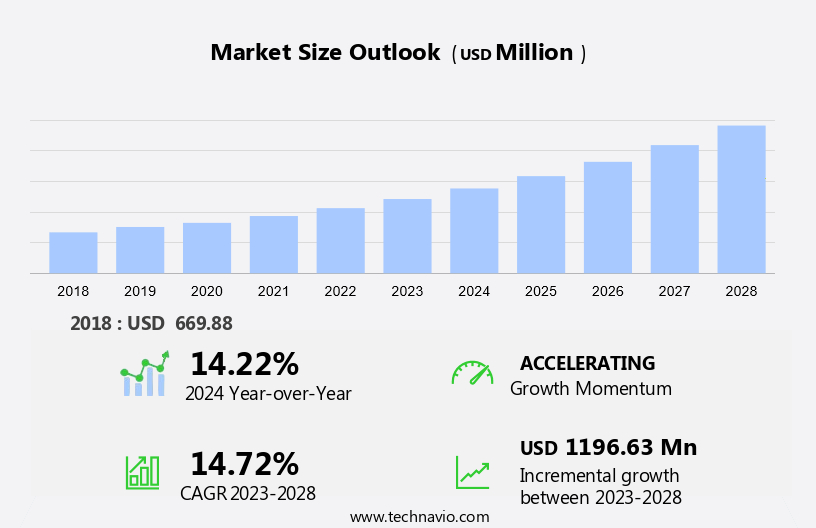
The metrology services market size is forecast to increase by USD 1.20 billion at a CAGR of 14.72% between 2023 and 2028.

  • Metrology services play a crucial role in ensuring cost reduction and reduced defects in manufacturing processes by adhering to internationally accepted standards. The increasing production capacity and aging population, coupled with rising consumerism, necessitate sustainable growth in this market. The use of Computer-Aided Design (CAD) by manufacturers and the shrinking lifecycle of consumer and industrial products have led to a higher demand for metrology services. However, the inadequate number of service providers offering comprehensive metrology services poses a challenge. To address this, companies are investing in advanced technologies, software solutions, and multiple functionalities to cater to the growin market needs. This trend is expected to continue, as the focus on maintaining quality and efficiency in manufacturing processes remains a top priority.

What will the size of the market be during the forecast period?

Metrology Services Market Size

 Request Free Sample

  • The market is a critical component of the manufacturing industry, providing solutions for dimensional inspection, alignment services, and quality control. These services are essential for various sectors, including aerospace and manufacturing, to ensure the production of high-quality components and products. Metrology services encompass various techniques, such as 3D scanning, coordinate measuring, and laser trackers, to name a few. These technologies enable the measurement and analysis of complex geometries and help identify deviations from design specifications. Three-dimensional scanning, for instance, is a non-contact measurement technique that utilizes lasers or cameras to capture the surface geometry of components. Alignment services are another crucial aspect of metrology services. They ensure the proper positioning and orientation of components, which is vital for the successful assembly of complex systems. This process is particularly important in the aerospace industry, where misalignments can lead to catastrophic failures. Quality control is a primary focus for metrology services. By utilizing advanced metrology technologies, manufacturers can reduce defects and improve overall product quality. This not only leads to cost savings but also enhances customer satisfaction and brand reputation.
  • Metrology automation and calibration laboratories are integral parts of the market. They provide advanced metrology solutions, including industrial robot calibration and metrology product sales, to help manufacturers streamline their processes and maintain consistent quality. X-ray scanning and CT scanning are additional metrology techniques that offer unique advantages. X-ray scanning can be used to inspect the internal structure of components, while CT scanning provides 3D images of complex geometries. These techniques are particularly valuable in industries where the internal structure of components is essential for their functionality. In conclusion, the market plays a vital role in the North American manufacturing sector by ensuring precision and accuracy in the production process. Through the application of advanced metrology technologies, manufacturers can optimize quality, reduce costs, and improve overall efficiency.

How is this market segmented and which is the largest segment?

The market research report provides comprehensive data (region-wise segment analysis), with forecasts and estimates in "USD million" for the period 2024-2028, as well as historical data from 2018-2022 for the following segments.

  • Application
    • Heavy equipment
    • Automotive
    • Aerospace and defense
    • Others
  • Product
    • Coordinate measuring machines (CMM)
    • Optical digitizers scanners (ODS)
  • Geography
    • Europe
      • Germany
      • UK
    • APAC
      • China
    • North America
      • Canada
      • US
    • South America
    • Middle East and Africa

By Application Insights

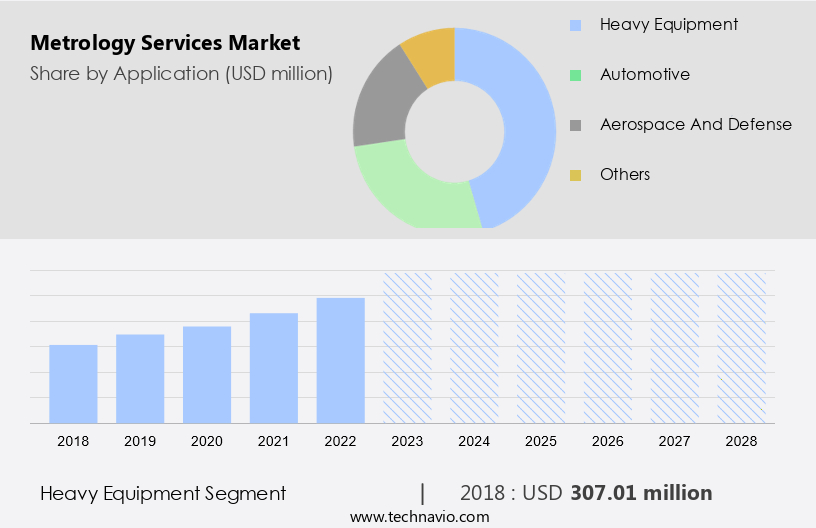
  • The heavy equipment segment is estimated to witness significant growth during the forecast period.

Metrology services play a crucial role in the manufacturing process of heavy equipment used in industries such as oil and gas, power generation, earthmoving, excavation, and agriculture. These services ensure the accurate measurement and calibration of tools, fixtures, jigs, gauges, dies, manufactured components, and machinery. Onsite engineering and equipment services are essential for addressing measurement issues during the production process.

Further, in the energy industry, metrology services are utilized for the alignment of new components with existing equipment, reverse engineering, and the assessment of part deformation due to welding or thermal variations. The growth of infrastructure projects worldwide is driving significant investments in heavy equipment manufacturing, particularly in earthmoving, excavation, and agriculture-related activities. Metrology services are indispensable in maintaining the precision and efficiency of these manufacturing processes.

Metrology Services Market Size

Get a glance at the market report of share of various segments Request Free Sample

The heavy equipment segment was valued at USD 307.01 million in 2018 and showed a gradual increase during the forecast period.

Regional Analysis

  • Europe is estimated to contribute 29% to the growth of the global market during the forecast period.

Technavio's analysts have elaborately explained the regional trends and drivers that shape the market during the forecast period.

Metrology Services Market Share by Geography

For more insights on the market share of various regions Request Free Sample

Metrology services play a crucial role in ensuring quality control and component testing in various industries, particularly in Europe, which is a leading manufacturer of automobiles, aerospace and defense equipment, and medical devices. With over 290 vehicle manufacturing plants and thousands of automotive component suppliers in Europe, the demand for metrology services is significant. In 2020, Europe produced approximately 10.8 million vehicles, accounting for over one-fifth of global vehicle production. Additionally, Europe is a major hub for the aerospace and defense industry, which is projected to expand substantially due to rising demand from developing countries. Metrology services are essential for industries such as manufacturing, where precise measurements and alignment are critical.

Additionally, technologies like 3D scanning, coordinate measuring, and dimensional inspection are commonly used for this purpose. Metrology services providers offer alignment services and 3D scanning solutions to ensure product accuracy and consistency. 3D scanners are increasingly being adopted for reverse engineering, product development, and quality control applications. Alignment services help ensure that components are correctly assembled and positioned, while dimensional inspection ensures that components meet the specified dimensions. Coordinate measuring machines (CMMs) are used to measure the geometric characteristics of parts and assemblies, providing accurate and reliable data for quality control and process optimization. By leveraging metrology services, manufacturers can improve product quality, reduce production costs, and enhance customer satisfaction.

Market Dynamics

Our researchers analyzed the data with 2023 as the base year, along with the key drivers, trends, and challenges. A holistic analysis of drivers will help companies refine their marketing strategies to gain a competitive advantage.

What are the key market drivers leading to the rise in adoption of Metrology Services Market?

The growing use of CAD by manufacturers is the key driver of the market.

  • Metrology services play a crucial role in ensuring the accuracy and precision of manufacturing processes. Traditional methods of comparing tools or components with physical models have limitations, as they are time-consuming and error-prone. Modern metrology tools, such as Laser Trackers, Portable Measuring, X-ray scanning, and CT Scanning, have revolutionized the metrology landscape. These advanced tools enable manufacturers to compare a tool or component with a digital CAD model, facilitating faster and more accurate measurement. Moreover, the increasing adoption of 3D modeling and industrial robot calibration in various industries, including automotive, aerospace and defense, and heavy equipment, necessitates the use of metrology tools for non-critical parts.

  • OEM Metrology solutions are increasingly being used to ensure the accuracy of production processes, thereby reducing errors and improving product quality. Metrology automation is another area where these tools are gaining popularity due to their ability to streamline processes and enhance productivity. Overall, metrology services are becoming an essential component of modern manufacturing, enabling manufacturers to maintain high levels of accuracy and precision in their production processes.

What are the market trends shaping the Metrology Services Market?

Shrinking lifecycle of consumer and industrial products is the upcoming trend in the market.

  • The global manufacturing sector is witnessing a trend towards shorter product lifecycles due to escalating consumer demand for innovative goods and regulatory requirements. For instance, the average usage duration of a mobile phone by a consumer in India has been decreasing consistently. Similarly, the Indian government implemented the BS VI emission norms for automotive vehicles from FY 2020, which skipped the BS V standards. These factors necessitate OEMs to frequently launch new products and upgrade older models. Metrology services play a crucial role in ensuring cost reduction and reduced defects during production. Adherence to internationally accepted standards is essential for sustainable growth in the manufacturing industry.
  • With an aging population and rising consumerism, the demand for metrology services is expected to increase. These services offer multiple functionalities, including ensuring production capacity and maintaining quality control. By utilizing metrology services, manufacturers can optimize their processes, improve efficiency, and enhance their competitive edge.

What challenges does Metrology Services Market face during the growth?

An inadequate number of service providers that offer comprehensive metrology services is a key challenge affecting the market growth.

  • The market in the United States is characterized by a significant number of companies, leading to a fragmented landscape. These providers offer various metrology solutions, such as calibration of industrial equipment, reverse engineering, 3D measurement, and quality control. However, not all companies offer a complete suite of services, which may require manufacturers to engage multiple providers for a single manufacturing process. This fragmentation can lead to uncoordinated efforts and potential quality issues. Comprehensive metrology services encompass comparing manufactured parts to CAD models, reverse engineering, 3D modeling, calibration of industrial robots, and integration of metrology systems with computer-aided design (CAD), computer-aided manufacturing (CAM), and CAM-based processes.
  • Seeking out providers that offer these services can streamline the manufacturing process and ensure optimal quality output. Metrology services play a crucial role in ensuring product accuracy and precision, making them an essential component of the manufacturing process for various industries. By partnering with a reliable metrology services provider, manufacturers can enhance their quality control processes and improve overall product performance.

Exclusive Customer Landscape

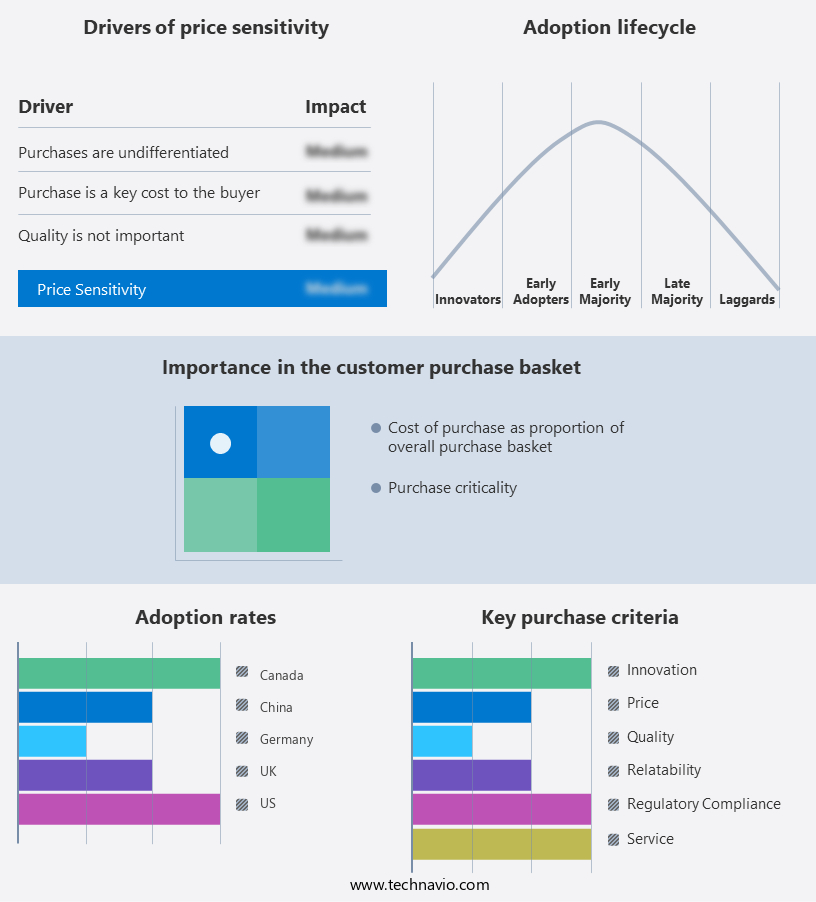
The market forecasting report includes the adoption lifecycle of the market, covering from the innovator's stage to the laggard's stage. It focuses on adoption rates in different regions based on penetration. Furthermore, the market report also includes key purchase criteria and drivers of price sensitivity to help companies evaluate and develop their market growth analysis strategies.

Metrology Services Market Share by Geography

 Customer Landscape

Key Companies & Market Insights

Companies are implementing various strategies, such as strategic alliances, market forecast , partnerships, mergers and acquisitions, geographical expansion, and product/service launches, to enhance their presence in the market. The market research and growth report includes detailed analyses of the competitive landscape of the market and information about key companies, including:

  • AMETEK Inc.
  • Apex Metrology Ltd
  • Atlas Copco AB
  • ATT Metrology Services
  • Automated Precision Inc.
  • Avon Dynamic Calibration Ltd.
  • Carl Zeiss AG
  • FARO Technologies Inc.
  • Hexagon AB
  • In Place Machining Company LLC
  • Intertek Group Plc
  • Keyence India Pvt. Ltd.
  • KLA Corp.
  • Mitutoyo Corp.
  • Nikon Corp.
  • Optical Metrology Services Ltd
  • Optimax Imaging Inspection and Measurement Ltd
  • Quality Vision International Inc.
  • Renishaw Plc
  • Trescal International SAS

Qualitative and quantitative analysis of companies has been conducted to help clients understand the wider business environment as well as the strengths and weaknesses of key market players. Data is qualitatively analyzed to categorize companies as pure play, category-focused, industry-focused, and diversified; it is quantitatively analyzed to categorize companies as dominant, leading, strong, tentative, and weak.

Research Analyst Overview

Metrology services play a crucial role in various industries, including aerospace and manufacturing, by ensuring quality control and optimization. These services encompass dimensional inspection, alignment, and coordinate measuring using advanced tools such as 3D scanners, laser trackers, and portable measuring devices. Metrology services are essential for industries that require high precision and adherence to internationally accepted standards. In the manufacturing sector, metrology services enable cost reduction and reduced defects by identifying measurement issues and implementing Cambased processes. The aging population and rising consumerism are driving sustainable growth in this market. Metrology services are also increasingly being adopted in the energy industry for onsite engineering and equipment services.

Moreover, advancements in technology have led to the development of autonomous robots and measurement labs for periodic quality testing. Collaborations between metrology service providers and technology companies are leading to the integration of multiple functionalities, such as 3D modeling, reverse engineering, and industrial robot calibration, into metrology products. The economic scenario in emerging economies is also fueling the demand for metrology services as they help improve production capacity and maintain quality and consistency in manufacturing processes. The medical sector is another growing area for metrology services, particularly in the inspection of medical devices using X-ray scanning, CT scanning, and other advanced measurement techniques.

Market Scope

Report Coverage

Details

Page number

168

Base year

2023

Historic period

2018-2022

Forecast period

2024-2028

Growth momentum & CAGR

Accelerate at a CAGR of 14.72%

Market growth 2024-2028

USD 1.20 billion

Market structure

Fragmented

YoY growth 2023-2024(%)

14.22

Key countries

US, Canada, China, Germany, and UK

Competitive landscape

Leading Companies, Market Positioning of Companies, Competitive Strategies, and Industry Risks

Request Free Sample

What are the Key Data Covered in this Market Research and Growth Report?

  • CAGR of the market during the forecast period
  • Detailed information on factors that will drive the market growth and forecasting between 2024 and 2028
  • Precise estimation of the size of the market  and its contribution of the market in focus to the parent market
  • Accurate predictions about upcoming market growth and trends and changes in consumer behaviour
  • Growth of the market across Europe, APAC, North America, South America, and Middle East and Africa
  • Thorough analysis of the market's competitive landscape and detailed information about companies
  • Comprehensive analysis of factors that will challenge the growth of market companies

We can help! Our analysts can customize this market research report to meet your requirements. Get in touch

1 Executive Summary

  • 1.1 Market overview
    • Exhibit 01: Executive Summary – Chart on Market Overview
    • Exhibit 02: Executive Summary – Data Table on Market Overview
    • Exhibit 03: Executive Summary – Chart on Global Market Characteristics
    • Exhibit 04: Executive Summary – Chart on Market by Geography
    • Exhibit 05: Executive Summary – Chart on Market Segmentation by Application
    • Exhibit 06: Executive Summary – Chart on Market Segmentation by Product
    • Exhibit 07: Executive Summary – Chart on Incremental Growth
    • Exhibit 08: Executive Summary – Data Table on Incremental Growth
    • Exhibit 09: Executive Summary – Chart on Vendor Market Positioning

2 Market Landscape

  • 2.1 Market ecosystem
    • Exhibit 10: Parent market
    • Exhibit 11: Market Characteristics

3 Market Sizing

  • 3.1 Market definition
    • Exhibit 12: Offerings of vendors included in the market definition
  • 3.2 Market segment analysis
    • Exhibit 13: Market segments
  • 3.3 Market size 2023
    • 3.4 Market outlook: Forecast for 2023-2028
      • Exhibit 14: Chart on Global - Market size and forecast 2023-2028 ($ million)
      • Exhibit 15: Data Table on Global - Market size and forecast 2023-2028 ($ million)
      • Exhibit 16: Chart on Global Market: Year-over-year growth 2023-2028 (%)
      • Exhibit 17: Data Table on Global Market: Year-over-year growth 2023-2028 (%)

    4 Historic Market Size

    • 4.1 Global metrology services market 2018 - 2022
      • Exhibit 18: Historic Market Size – Data Table on global metrology services market 2018 - 2022 ($ million)
    • 4.2 Application Segment Analysis 2018 - 2022
      • Exhibit 19: Historic Market Size – Application Segment 2018 - 2022 ($ million)
    • 4.3 Product Segment Analysis 2018 - 2022
      • Exhibit 20: Historic Market Size – Product Segment 2018 - 2022 ($ million)
    • 4.4 Geography Segment Analysis 2018 - 2022
      • Exhibit 21: Historic Market Size – Geography Segment 2018 - 2022 ($ million)
    • 4.5 Country Segment Analysis 2018 - 2022
      • Exhibit 22: Historic Market Size – Country Segment 2018 - 2022 ($ million)

    5 Five Forces Analysis

    • 5.1 Five forces summary
      • Exhibit 23: Five forces analysis - Comparison between 2023 and 2028
    • 5.2 Bargaining power of buyers
      • Exhibit 24: Chart on Bargaining power of buyers – Impact of key factors 2023 and 2028
    • 5.3 Bargaining power of suppliers
      • Exhibit 25: Bargaining power of suppliers – Impact of key factors in 2023 and 2028
    • 5.4 Threat of new entrants
      • Exhibit 26: Threat of new entrants – Impact of key factors in 2023 and 2028
    • 5.5 Threat of substitutes
      • Exhibit 27: Threat of substitutes – Impact of key factors in 2023 and 2028
    • 5.6 Threat of rivalry
      • Exhibit 28: Threat of rivalry – Impact of key factors in 2023 and 2028
    • 5.7 Market condition
      • Exhibit 29: Chart on Market condition - Five forces 2023 and 2028

    6 Market Segmentation by Application

    • 6.1 Market segments
      • Exhibit 30: Chart on Application - Market share 2023-2028 (%)
      • Exhibit 31: Data Table on Application - Market share 2023-2028 (%)
    • 6.2 Comparison by Application
      • Exhibit 32: Chart on Comparison by Application
      • Exhibit 33: Data Table on Comparison by Application
    • 6.3 Heavy equipment - Market size and forecast 2023-2028
      • Exhibit 34: Chart on Heavy equipment - Market size and forecast 2023-2028 ($ million)
      • Exhibit 35: Data Table on Heavy equipment - Market size and forecast 2023-2028 ($ million)
      • Exhibit 36: Chart on Heavy equipment - Year-over-year growth 2023-2028 (%)
      • Exhibit 37: Data Table on Heavy equipment - Year-over-year growth 2023-2028 (%)
    • 6.4 Automotive - Market size and forecast 2023-2028
      • Exhibit 38: Chart on Automotive - Market size and forecast 2023-2028 ($ million)
      • Exhibit 39: Data Table on Automotive - Market size and forecast 2023-2028 ($ million)
      • Exhibit 40: Chart on Automotive - Year-over-year growth 2023-2028 (%)
      • Exhibit 41: Data Table on Automotive - Year-over-year growth 2023-2028 (%)
    • 6.5 Aerospace and defense - Market size and forecast 2023-2028
      • Exhibit 42: Chart on Aerospace and defense - Market size and forecast 2023-2028 ($ million)
      • Exhibit 43: Data Table on Aerospace and defense - Market size and forecast 2023-2028 ($ million)
      • Exhibit 44: Chart on Aerospace and defense - Year-over-year growth 2023-2028 (%)
      • Exhibit 45: Data Table on Aerospace and defense - Year-over-year growth 2023-2028 (%)
    • 6.6 Others - Market size and forecast 2023-2028
      • Exhibit 46: Chart on Others - Market size and forecast 2023-2028 ($ million)
      • Exhibit 47: Data Table on Others - Market size and forecast 2023-2028 ($ million)
      • Exhibit 48: Chart on Others - Year-over-year growth 2023-2028 (%)
      • Exhibit 49: Data Table on Others - Year-over-year growth 2023-2028 (%)
    • 6.7 Market opportunity by Application
      • Exhibit 50: Market opportunity by Application ($ million)
      • Exhibit 51: Data Table on Market opportunity by Application ($ million)

    7 Market Segmentation by Product

    • 7.1 Market segments
      • Exhibit 52: Chart on Product - Market share 2023-2028 (%)
      • Exhibit 53: Data Table on Product - Market share 2023-2028 (%)
    • 7.2 Comparison by Product
      • Exhibit 54: Chart on Comparison by Product
      • Exhibit 55: Data Table on Comparison by Product
    • 7.3 Coordinate measuring machines (CMM) - Market size and forecast 2023-2028
      • Exhibit 56: Chart on Coordinate measuring machines (CMM) - Market size and forecast 2023-2028 ($ million)
      • Exhibit 57: Data Table on Coordinate measuring machines (CMM) - Market size and forecast 2023-2028 ($ million)
      • Exhibit 58: Chart on Coordinate measuring machines (CMM) - Year-over-year growth 2023-2028 (%)
      • Exhibit 59: Data Table on Coordinate measuring machines (CMM) - Year-over-year growth 2023-2028 (%)
    • 7.4 Optical digitizers and scanners (ODS) - Market size and forecast 2023-2028
      • Exhibit 60: Chart on Optical digitizers and scanners (ODS) - Market size and forecast 2023-2028 ($ million)
      • Exhibit 61: Data Table on Optical digitizers and scanners (ODS) - Market size and forecast 2023-2028 ($ million)
      • Exhibit 62: Chart on Optical digitizers and scanners (ODS) - Year-over-year growth 2023-2028 (%)
      • Exhibit 63: Data Table on Optical digitizers and scanners (ODS) - Year-over-year growth 2023-2028 (%)
    • 7.5 Market opportunity by Product
      • Exhibit 64: Market opportunity by Product ($ million)
      • Exhibit 65: Data Table on Market opportunity by Product ($ million)

    8 Customer Landscape

    • 8.1 Customer landscape overview
      • Exhibit 66: Analysis of price sensitivity, lifecycle, customer purchase basket, adoption rates, and purchase criteria

    9 Geographic Landscape

    • 9.1 Geographic segmentation
      • Exhibit 67: Chart on Market share by geography 2023-2028 (%)
      • Exhibit 68: Data Table on Market share by geography 2023-2028 (%)
    • 9.2 Geographic comparison
      • Exhibit 69: Chart on Geographic comparison
      • Exhibit 70: Data Table on Geographic comparison
    • 9.3 Europe - Market size and forecast 2023-2028
      • Exhibit 71: Chart on Europe - Market size and forecast 2023-2028 ($ million)
      • Exhibit 72: Data Table on Europe - Market size and forecast 2023-2028 ($ million)
      • Exhibit 73: Chart on Europe - Year-over-year growth 2023-2028 (%)
      • Exhibit 74: Data Table on Europe - Year-over-year growth 2023-2028 (%)
    • 9.4 APAC - Market size and forecast 2023-2028
      • Exhibit 75: Chart on APAC - Market size and forecast 2023-2028 ($ million)
      • Exhibit 76: Data Table on APAC - Market size and forecast 2023-2028 ($ million)
      • Exhibit 77: Chart on APAC - Year-over-year growth 2023-2028 (%)
      • Exhibit 78: Data Table on APAC - Year-over-year growth 2023-2028 (%)
    • 9.5 North America - Market size and forecast 2023-2028
      • Exhibit 79: Chart on North America - Market size and forecast 2023-2028 ($ million)
      • Exhibit 80: Data Table on North America - Market size and forecast 2023-2028 ($ million)
      • Exhibit 81: Chart on North America - Year-over-year growth 2023-2028 (%)
      • Exhibit 82: Data Table on North America - Year-over-year growth 2023-2028 (%)
    • 9.6 South America - Market size and forecast 2023-2028
      • Exhibit 83: Chart on South America - Market size and forecast 2023-2028 ($ million)
      • Exhibit 84: Data Table on South America - Market size and forecast 2023-2028 ($ million)
      • Exhibit 85: Chart on South America - Year-over-year growth 2023-2028 (%)
      • Exhibit 86: Data Table on South America - Year-over-year growth 2023-2028 (%)
    • 9.7 Middle East and Africa - Market size and forecast 2023-2028
      • Exhibit 87: Chart on Middle East and Africa - Market size and forecast 2023-2028 ($ million)
      • Exhibit 88: Data Table on Middle East and Africa - Market size and forecast 2023-2028 ($ million)
      • Exhibit 89: Chart on Middle East and Africa - Year-over-year growth 2023-2028 (%)
      • Exhibit 90: Data Table on Middle East and Africa - Year-over-year growth 2023-2028 (%)
    • 9.8 US - Market size and forecast 2023-2028
      • Exhibit 91: Chart on US - Market size and forecast 2023-2028 ($ million)
      • Exhibit 92: Data Table on US - Market size and forecast 2023-2028 ($ million)
      • Exhibit 93: Chart on US - Year-over-year growth 2023-2028 (%)
      • Exhibit 94: Data Table on US - Year-over-year growth 2023-2028 (%)
    • 9.9 China - Market size and forecast 2023-2028
      • Exhibit 95: Chart on China - Market size and forecast 2023-2028 ($ million)
      • Exhibit 96: Data Table on China - Market size and forecast 2023-2028 ($ million)
      • Exhibit 97: Chart on China - Year-over-year growth 2023-2028 (%)
      • Exhibit 98: Data Table on China - Year-over-year growth 2023-2028 (%)
    • 9.10 Germany - Market size and forecast 2023-2028
      • Exhibit 99: Chart on Germany - Market size and forecast 2023-2028 ($ million)
      • Exhibit 100: Data Table on Germany - Market size and forecast 2023-2028 ($ million)
      • Exhibit 101: Chart on Germany - Year-over-year growth 2023-2028 (%)
      • Exhibit 102: Data Table on Germany - Year-over-year growth 2023-2028 (%)
    • 9.11 UK - Market size and forecast 2023-2028
      • Exhibit 103: Chart on UK - Market size and forecast 2023-2028 ($ million)
      • Exhibit 104: Data Table on UK - Market size and forecast 2023-2028 ($ million)
      • Exhibit 105: Chart on UK - Year-over-year growth 2023-2028 (%)
      • Exhibit 106: Data Table on UK - Year-over-year growth 2023-2028 (%)
    • 9.12 Canada - Market size and forecast 2023-2028
      • Exhibit 107: Chart on Canada - Market size and forecast 2023-2028 ($ million)
      • Exhibit 108: Data Table on Canada - Market size and forecast 2023-2028 ($ million)
      • Exhibit 109: Chart on Canada - Year-over-year growth 2023-2028 (%)
      • Exhibit 110: Data Table on Canada - Year-over-year growth 2023-2028 (%)
    • 9.13 Market opportunity by geography
      • Exhibit 111: Market opportunity by geography ($ million)
      • Exhibit 112: Data Tables on Market opportunity by geography ($ million)

    10 Drivers, Challenges, and Trends

    • 10.1 Market drivers
      • 10.2 Market challenges
        • 10.3 Impact of drivers and challenges
          • Exhibit 113: Impact of drivers and challenges in 2023 and 2028
        • 10.4 Market trends

          11 Vendor Landscape

          • 11.1 Overview
            • 11.2 Vendor landscape
              • Exhibit 114: Overview on Criticality of inputs and Factors of differentiation
            • 11.3 Landscape disruption
              • Exhibit 115: Overview on factors of disruption
            • 11.4 Industry risks
              • Exhibit 116: Impact of key risks on business

            12 Vendor Analysis

            • 12.1 Vendors covered
              • Exhibit 117: Vendors covered
            • 12.2 Market positioning of vendors
              • Exhibit 118: Matrix on vendor position and classification
            • 12.3 AMETEK Inc.
              • Exhibit 119: AMETEK Inc. - Overview
              • Exhibit 120: AMETEK Inc. - Business segments
              • Exhibit 121: AMETEK Inc. - Key offerings
              • Exhibit 122: AMETEK Inc. - Segment focus
            • 12.4 Apex Metrology Ltd
              • Exhibit 123: Apex Metrology Ltd - Overview
              • Exhibit 124: Apex Metrology Ltd - Product / Service
              • Exhibit 125: Apex Metrology Ltd - Key offerings
            • 12.5 ATT Metrology Services
              • Exhibit 126: ATT Metrology Services - Overview
              • Exhibit 127: ATT Metrology Services - Product / Service
              • Exhibit 128: ATT Metrology Services - Key offerings
            • 12.6 Automated Precision Inc.
              • Exhibit 129: Automated Precision Inc. - Overview
              • Exhibit 130: Automated Precision Inc. - Product / Service
              • Exhibit 131: Automated Precision Inc. - Key offerings
            • 12.7 Avon Dynamic Calibration Ltd.
              • Exhibit 132: Avon Dynamic Calibration Ltd. - Overview
              • Exhibit 133: Avon Dynamic Calibration Ltd. - Product / Service
              • Exhibit 134: Avon Dynamic Calibration Ltd. - Key offerings
            • 12.8 Carl Zeiss AG
              • Exhibit 135: Carl Zeiss AG - Overview
              • Exhibit 136: Carl Zeiss AG - Business segments
              • Exhibit 137: Carl Zeiss AG - Key offerings
              • Exhibit 138: Carl Zeiss AG - Segment focus
            • 12.9 FARO Technologies Inc.
              • Exhibit 139: FARO Technologies Inc. - Overview
              • Exhibit 140: FARO Technologies Inc. - Product / Service
              • Exhibit 141: FARO Technologies Inc. - Key news
              • Exhibit 142: FARO Technologies Inc. - Key offerings
            • 12.10 Hexagon AB
              • Exhibit 143: Hexagon AB - Overview
              • Exhibit 144: Hexagon AB - Business segments
              • Exhibit 145: Hexagon AB - Key offerings
              • Exhibit 146: Hexagon AB - Segment focus
            • 12.11 In Place Machining Company LLC
              • Exhibit 147: In Place Machining Company LLC - Overview
              • Exhibit 148: In Place Machining Company LLC - Product / Service
              • Exhibit 149: In Place Machining Company LLC - Key offerings
            • 12.12 Intertek Group Plc
              • Exhibit 150: Intertek Group Plc - Overview
              • Exhibit 151: Intertek Group Plc - Business segments
              • Exhibit 152: Intertek Group Plc - Key news
              • Exhibit 153: Intertek Group Plc - Key offerings
              • Exhibit 154: Intertek Group Plc - Segment focus
            • 12.13 Mitutoyo Corp.
              • Exhibit 155: Mitutoyo Corp. - Overview
              • Exhibit 156: Mitutoyo Corp. - Product / Service
              • Exhibit 157: Mitutoyo Corp. - Key offerings
            • 12.14 Nikon Corp.
              • Exhibit 158: Nikon Corp. - Overview
              • Exhibit 159: Nikon Corp. - Business segments
              • Exhibit 160: Nikon Corp. - Key news
              • Exhibit 161: Nikon Corp. - Key offerings
              • Exhibit 162: Nikon Corp. - Segment focus
            • 12.15 Optimax Imaging Inspection and Measurement Ltd
              • Exhibit 163: Optimax Imaging Inspection and Measurement Ltd - Overview
              • Exhibit 164: Optimax Imaging Inspection and Measurement Ltd - Product / Service
              • Exhibit 165: Optimax Imaging Inspection and Measurement Ltd - Key offerings
            • 12.16 Renishaw Plc
              • Exhibit 166: Renishaw Plc - Overview
              • Exhibit 167: Renishaw Plc - Business segments
              • Exhibit 168: Renishaw Plc - Key offerings
              • Exhibit 169: Renishaw Plc - Segment focus
            • 12.17 Trescal International SAS
              • Exhibit 170: Trescal International SAS - Overview
              • Exhibit 171: Trescal International SAS - Product / Service
              • Exhibit 172: Trescal International SAS - Key offerings

            13 Appendix

            • 13.1 Scope of the report
              • 13.2 Inclusions and exclusions checklist
                • Exhibit 173: Inclusions checklist
                • Exhibit 174: Exclusions checklist
              • 13.3 Currency conversion rates for US$
                • Exhibit 175: Currency conversion rates for US$
              • 13.4 Research methodology
                • Exhibit 176: Research methodology
                • Exhibit 177: Validation techniques employed for market sizing
                • Exhibit 178: Information sources
              • 13.5 List of abbreviations
                • Exhibit 179: List of abbreviations

              Research Methodology

              Technavio presents a detailed picture of the market by way of study, synthesis, and summation of data from multiple sources. The analysts have presented the various facets of the market with a particular focus on identifying the key industry influencers. The data thus presented is comprehensive, reliable, and the result of extensive research, both primary and secondary.

              INFORMATION SOURCES

              Primary sources

              • Manufacturers and suppliers
              • Channel partners
              • Industry experts
              • Strategic decision makers

              Secondary sources

              • Industry journals and periodicals
              • Government data
              • Financial reports of key industry players
              • Historical data
              • Press releases

              DATA ANALYSIS

              Data Synthesis

              • Collation of data
              • Estimation of key figures
              • Analysis of derived insights

              Data Validation

              • Triangulation with data models
              • Reference against proprietary databases
              • Corroboration with industry experts

              REPORT WRITING

              Qualitative

              • Market drivers
              • Market challenges
              • Market trends
              • Five forces analysis

              Quantitative

              • Market size and forecast
              • Market segmentation
              • Geographical insights
              • Competitive landscape

              Interested in this report?

              Get your sample now to see our research methodology and insights!

              Download Now

              Frequently Asked Questions

              Metrology Services market growth will increase by $ 1196.63 mn during 2024-2028 .

              The Metrology Services market is expected to grow at a CAGR of 14.72% during 2024-2028 .

              Metrology Services market is segmented by Application( Heavy equipment, Automotive, Aerospace and defense, Others) Product( Coordinate measuring machines (CMM), Optical digitizers, scanners (ODS), South America, Middle East and Africa)

              AMETEK Inc., Apex Metrology Ltd, Atlas Copco AB, ATT Metrology Services, Automated Precision Inc., Avon Dynamic Calibration Ltd., Carl Zeiss AG, FARO Technologies Inc., Hexagon AB, In Place Machining Company LLC, Intertek Group Plc, Keyence India Pvt. Ltd., KLA Corp., Mitutoyo Corp., Nikon Corp., Optical Metrology Services Ltd, Optimax Imaging Inspection and Measurement Ltd, Quality Vision International Inc., Renishaw Plc, Trescal International SAS are a few of the key vendors in the Metrology Services market.

              Europe will register the highest growth rate of 29% among the other regions. Therefore, the Metrology Services market in Europe is expected to garner significant business opportunities for the vendors during the forecast period.

              US, Canada, China, Germany, UK

              • Growing use of CAD by manufacturersThe primary purpose of modern metrology tools such as CMMs and ODS is to compare a tool or component with a reference tool or component and identify deviations is the driving factor this market.
              • if any. The reference could be a physical or a digital model of the tool or component. Comparing a tool or component with a physical model is the driving factor this market.
              • which has generally been done in the past is the driving factor this market.
              • is a time-consuming exercise and is prone to a lot of mistakes. Thus is the driving factor this market.
              • manufacturers tend to use metrology tools only for critical parts and equipment is the driving factor this market.
              • and this limited metrology tools from being extensively used in the past. However is the driving factor this market.
              • modern manufacturing increasingly requires manufacturers to use CAD software is the driving factor this market.
              • even for non-critical parts in the automotive is the driving factor this market.
              • aerospace and defense is the driving factor this market.
              • and heavy equipment industries. This is because CAD not only automates the design process but also offers an opportunity to introduce minor or major design changes in the CAD model of the current component. This is quite useful given that the lifecycle of most consumer and industrial products has currently become shorter than in the past. Thus is the driving factor this market.
              • the use of CAD reduces the time spent on designing an upgraded product. Moreover is the driving factor this market.
              • manufacturers are increasingly using CAM software to automate machine tool operations. CAM requires CAD models to automate machine tool processes. This is leading to increasing demand for CAD software in the global manufacturing industry. Thus is the driving factor this market.
              • the growing adoption of CAD by manufacturers is also increasing demand for metrology services as the comparison of a tool or component produced can be made quickly with a CAD model using a CMM (coordinate measuring machine) is the driving factor this market.
              • tracker is the driving factor this market.
              • scanner is the driving factor this market.
              • or visual device. Thus is the driving factor this market.
              • the efficiency of the inspection process improves significantly. Also is the driving factor this market.
              • metrology service providers offer reverse engineering services to manufacturers. Reverse engineering refers to the process of producing a CAD model of a component or tool using metrology tools. Thus is the driving factor this market.
              • CAD models of complex tools or components can be produced with the highest level of accuracy using reverse engineering. This is leading to increasing demand for metrology services and driving the growth of the market. Therefore is the driving factor this market.
              • such factors will propel the growth of the global metrology services market during the forecast period. is the driving factor this market.

              The Metrology Services market vendors should focus on grabbing business opportunities from the Heavy equipment segment as it accounted for the largest market share in the base year.