Microgrid As A Service Market Analysis APAC, North America, Europe, South America, Middle East and Africa - US, China, Japan, India, Germany - Size and Forecast 2024-2028

Microgrid As A Service Market Analysis APAC, North America, Europe, South America, Middle East and Africa - US, China, Japan, India, Germany - Size and Forecast 2024-2028

Published: Jul 2024 171 Pages SKU: IRTNTR75027

Market Overview at a Glance

$8.66 B
Market Opportunity
16.83%
CAGR
14.01
YoY growth 2023-2024(%)

Microgrid As A Service Market Size 2024-2028

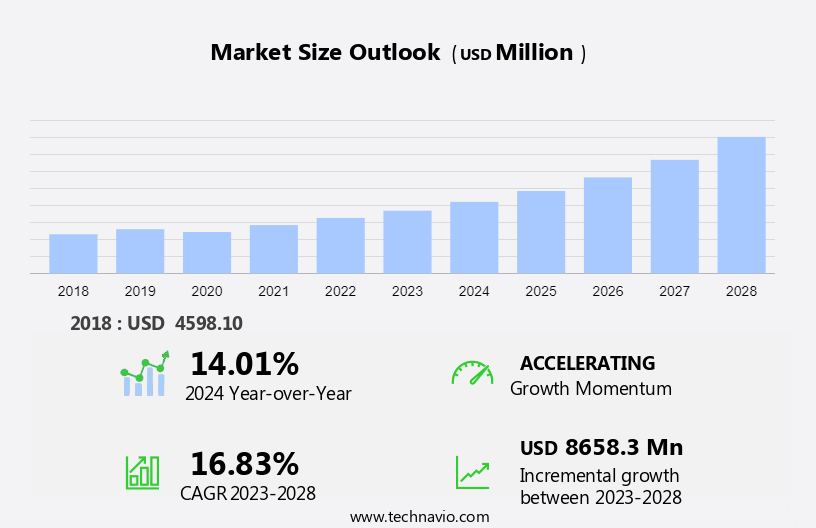
The microgrid as a service market size is forecast to increase by USD 8.66 billion at a CAGR of 16.83% between 2023 and 2028.

  • The market is experiencing significant growth due to the increasing demand for reliable and sustainable energy solutions. Key trends driving market expansion include rapid advances in technology and the integration of renewable energy sources. However, reluctance to adopt microgrid technology due to high upfront costs and regulatory challenges remains a major hurdle. The market is expected to witness substantial growth in the coming years as these challenges are addressed through innovative financing models and regulatory frameworks. Additionally, the microgrid as a service model offers benefits such as cost savings, improved energy efficiency, and enhanced grid resilience, making it an attractive option for businesses, data centers, and communities in North America and beyond. The market analysis report provides a comprehensive assessment of these trends and challenges, offering valuable insights for stakeholders looking to capitalize on the growing opportunities In the market.

What will be the Size of the Microgrid As A Service Market During the Forecast Period?

Microgrid As A Service Market Size

 Request Free Sample

  • The market is experiencing significant growth as educational universities, hospitals, and remote localities seek energy resiliency and reliability to meet their unique energy needs. These organizations aim to reduce their reliance on traditional electric companies and the energy grid, particularly in areas prone to power outages or transmission losses. Microgrids offer cleaner energy goals through the integration of renewable energy sources, such as hydro, solar, and wind energy, and energy storage solutions.
  • Real-time data streaming, processing, and monitoring infrastructure enable these systems to optimize energy use and adapt to changing energy demands. Human intervention and automated controls ensure the efficient operation of microgrids, minimizing the need for long-distance distribution lines and reducing transmission losses. Public benefits from microgrids include improved energy security, reduced greenhouse gas emissions, and potential cost savings. The market is expected to continue growing as more organizations recognize the advantages of microgrids in meeting their energy requirements.

How is this Microgrid As A Service Industry segmented and which is the largest segment?

The microgrid as a service industry research report provides comprehensive data (region-wise segment analysis), with forecasts and estimates in "USD billion" for the period 2024-2028, as well as historical data from 2018-2022 for the following segments.
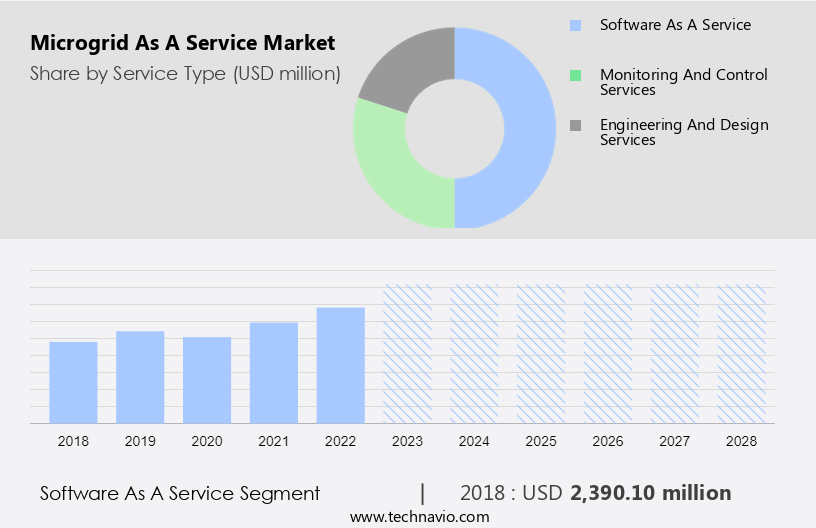
  • Service Type
    • Software as a service
    • Monitoring and control services
    • Engineering and design services
  • Type
    • Remote
    • Grid-connected
    • Networked
  • Geography
    • APAC
      • China
      • India
      • Japan
    • North America
      • US
    • Europe
      • Germany
    • South America
    • Middle East and Africa

By Service Type Insights

  • The software as a service segment is estimated to witness significant growth during the forecast period.

Microgrid as a Service (MaaS) enables microgrid owners to manage their systems more effectively with a single point of accountability, minimizing project risks and ensuring safer, more reliable, and power-efficient operations. Siemens AG, a leading industrial manufacturing company in Europe, offers MaaS for various sectors, including utilities, universities, enterprises, and communities. Their solution, located at Siemens' data center off-site, simplifies microgrid software management. It caters to the energy needs of these entities, promoting energy resiliency and reliability. Siemens' MaaS supports cleaner energy goals by integrating renewable energy sources such as hydro, solar, and wind energy into grid systems. The solution facilitates real-time data streaming, processing, storage, and monitoring infrastructure, allowing for human intervention when necessary.

By reducing transmission losses and emissions, MaaS contributes to public benefits and infrastructure projects, making it an essential component of the renewable energy landscape.

Microgrid As A Service Market Size

Get a glance at the  Microgrid As A Service Industry report of share of various segments Request Free Sample

The Software as a service segment was valued at USD 2.39 billion in 2018 and showed a gradual increase during the forecast period.

Regional Analysis

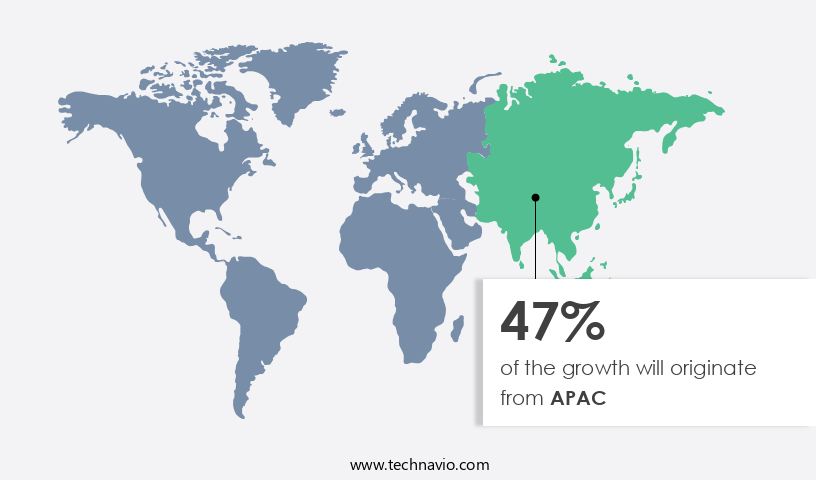
  • APAC is estimated to contribute 47% to the growth of the global market during the forecast period.

Technavio's analysts have elaborately explained the regional trends and drivers that shape the market during the forecast period.

Microgrid As A Service Market Share by Geography

For more insights on the market share of various regions, Request Free Sample

The market in Asia Pacific is projected to experience significant growth due to increasing urbanization and industrialization In the region. This expansion is driven by substantial investments in microgrid infrastructure and the escalating demand for reliable and uninterrupted power supplies. Countries like the Philippines, heavily reliant on coal and oil imports for energy needs, face challenges in establishing a centralized power system due to geographical constraints and vulnerability to natural disasters. Microgrids offer resilience and reliability, particularly in remote localities and critical institutions such as educational universities, hospitals, and enterprises. These systems enable the integration of renewable energy sources like hydro, solar, and wind, contributing to cleaner energy goals and emissions reduction.

Energy companies and public institutions are increasingly adopting microgrids to mitigate transmission losses and provide real-time data streaming, processing, storage, and monitoring infrastructure. This infrastructure enhances human intervention capabilities, ensuring efficient energy use and reducing summer cooling costs. The US Department of Energy (DOE) is funding various programs to promote microgrid innovation and connectivity, enabling real-time insights and infrastructure projects for a more sustainable energy future.

Market Dynamics

Our researchers analyzed the data with 2023 as the base year, along with the key drivers, trends, and challenges. A holistic analysis of drivers will help companies refine their marketing strategies to gain a competitive advantage.

What are the key market drivers leading to the rise In the adoption of Microgrid As A Service Industry?

Growing demand for microgrids is the key driver of the market.

  • Microgrids have emerged as a promising solution to address the challenges of energy reliability and resiliency, particularly in remote localities and critical institutions such as educational universities and hospitals. These microgrids enable these entities to meet their energy needs with cleaner energy sources, including hydro, solar, and wind energy while reducing emissions and improving energy use efficiency. Microgrids offer real-time data streaming, processing, storage, and monitoring infrastructure, allowing for human intervention when necessary. This technology is essential in areas prone to power outages, ensuring continuity of operations and public benefits. Electric companies are increasingly investing in microgrids to enhance grid systems' reliability and reduce transmission losses.
  • Renewable energy sources, such as solar and wind energy, are becoming more cost-effective, making microgrids an attractive option for enterprises. The energy storage capacity of microgrids plays a crucial role in providing energy during power outages and peak demand periods, reducing summer cooling costs and insulation barrier requirements. The US Department of Energy (DOE) has funded several programs to accelerate the product innovation and deployment of microgrids. Microgrids provide real-time insights into energy use and offer connectivity to the traditional energy grid when available. The technicalities of microgrids, including solar panels and energy storage, require ongoing research and development to optimize their performance and reduce costs.

What are the market trends shaping the Microgrid As A Service Industry?

Rapid advances in technology is the upcoming market trend.

  • The market is experiencing significant growth due to the increasing energy needs of various sectors such as educational universities, hospitals, and remote localities. These institutions require energy solutions that offer resiliency and reliability, which microgrids provide through real-time data streaming, processing, storage, and monitoring infrastructure. The shift towards cleaner energy goals is another driving factor, with electric companies and enterprises seeking to reduce emissions and improve the efficiency of their energy use. Microgrids enable the integration of renewable energy sources like hydro, solar, and wind energy into the grid systems, reducing transmission losses and providing energy storage solutions. The declining costs of renewable energy and the increasing awareness of the benefits of microgrids are expected to boost the market's growth.
  • Moreover, microgrids offer human intervention capabilities, enabling users to manage their energy use and summer cooling costs more effectively. The US Department of Energy (DOE) has launched several funded programs to promote product innovation and infrastructure projects In the microgrid sector. The market's growth is further driven by the need for reliable energy sources during power outages and the potential for energy savings through efficient energy management. 

What challenges does the Microgrid As A Service Industry face during its growth?

Reluctance in the adoption of microgrid technology is a key challenge affecting the industry growth.

  • The market is experiencing significant growth due to the increasing energy needs of various sectors, including educational universities, hospitals, and remote localities. These institutions and communities seek energy resiliency and reliability, aligning with their cleaner energy goals. Electric companies face challenges in meeting these demands through the existing energy grid due to transmission losses and the intermittency of hydro, solar, and wind energy. MaaS offers a solution through real-time data streaming, processing, storage, and monitoring infrastructure. Energy storage and renewable energy sources like solar panels play a crucial role in this model. Human intervention is minimal, ensuring efficient energy use and emissions reduction.
  • Enterprises, especially those in critical sectors, are increasingly adopting MaaS to mitigate power outages and reduce electric bills. The infrastructure projects associated with MaaS require connectivity and real-time insights for optimal performance. The US Department of Energy (DOE) has funded various programs to promote product innovation and awareness. As energy storage technologies become more affordable and efficient, MaaS is poised to revolutionize the energy landscape, offering significant public benefits.

Exclusive Customer Landscape

The market forecasting report includes the adoption lifecycle of the market, covering from the innovator's stage to the laggard's stage. It focuses on adoption rates in different regions based on penetration. Furthermore, the market report also includes key purchase criteria and drivers of price sensitivity to help companies evaluate and develop their market growth analysis strategies.
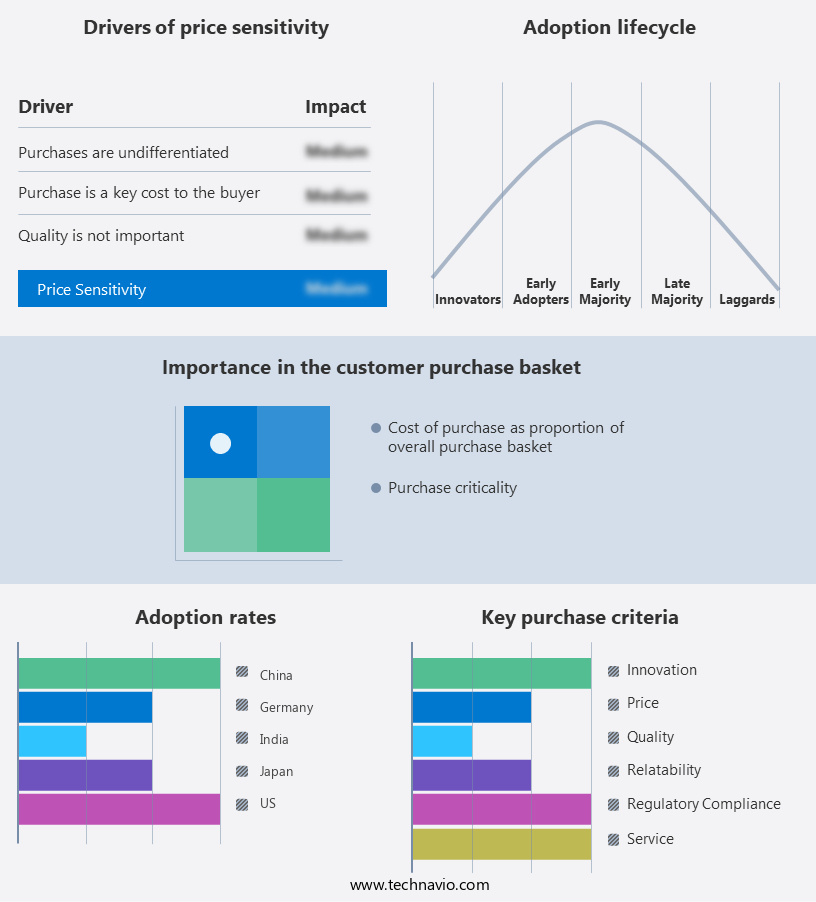
Microgrid As A Service Market Share by Geography

 Customer Landscape

Key Companies & Market Insights

Companies are implementing various strategies, such as strategic alliances, microgrid as a service market forecast, partnerships, mergers and acquisitions, geographical expansion, and product/service launches, to enhance their presence In the industry.

The industry research and growth report includes detailed analyses of the competitive landscape of the market and information about key companies, including:

  • ABB Ltd.
  • Aggreko Plc
  • AIO Systems Ltd.
  • Anbaric Development Partners LLC
  • Canopy Power
  • Capstone Green Energy Corp.
  • Duke Energy Corp.
  • Eaton Corp. Plc
  • Emerson Electric Co.
  • Enchanted Rock LLC
  • ENGIE SA
  • General Electric Co.
  • General MicroGrids
  • Metco Engineering
  • NRG Energy Inc.
  • Pareto Energy
  • Schneider Electric SE
  • Siemens AG
  • Spirae LLC
  • Tech Mahindra Ltd.
  • Tesla Inc.

Qualitative and quantitative analysis of companies has been conducted to help clients understand the wider business environment as well as the strengths and weaknesses of key industry players. Data is qualitatively analyzed to categorize companies as pure play, category-focused, industry-focused, and diversified; it is quantitatively analyzed to categorize companies as dominant, leading, strong, tentative, and weak.

Research Analyst Overview

Microgrids, autonomous local power systems that can operate independently from the main electricity grid, have gained significant attention in recent years due to their ability to provide energy resiliency and reliability. These systems, which can be integrated with various renewable energy sources such as hydro, solar, and wind, offer numerous benefits for a range of energy consumers. Microgrids are particularly valuable for institutions with unique energy needs, such as educational universities and hospitals. In remote localities, where access to the main power grid may be limited or unreliable, microgrids can provide a critical energy solution. By generating and storing energy on-site, these institutions can reduce their reliance on traditional electric companies and mitigate the risks associated with power outages.

Moreover, microgrids align with the cleaner energy goals of many organizations. By utilizing renewable energy sources, microgrids can help reduce emissions and contribute to a more sustainable energy mix. The real-time data streaming, processing, and storage capabilities of microgrids enable enterprises to optimize their energy use and monitor infrastructure performance with greater accuracy and efficiency. The microgrid market is driven by several factors, including the increasing awareness of energy resiliency and reliability, the technicalities of grid systems, and the need for emissions reduction. The integration of renewable energy sources into the grid infrastructure has also been a significant factor In the growth of the microgrid market.

Furthermore, the microgrid market is characterized by ongoing product innovation and infrastructure projects. The development of advanced energy storage technologies, such as batteries and capacitors, has enabled microgrids to provide more consistent power and improve their overall efficiency. The integration of human intervention and monitoring infrastructure has also enhanced the capabilities of microgrids, allowing for greater control and flexibility. The microgrid market is expected to continue growing as more organizations recognize the benefits of these systems. The ability to provide real-time insights into energy usage and infrastructure performance, as well as the potential for cost savings through energy optimization, make microgrids an attractive solution for enterprises looking to reduce their energy bills and improve their overall energy management.

Market Scope

Report Coverage

Details

Page number

171

Base year

2023

Historic period

2018-2022

Forecast period

2024-2028

Growth momentum & CAGR

Accelerate at a CAGR of 16.83%

Market Growth 2024-2028

USD 8.66 billion

Market structure

Fragmented

YoY growth 2023-2024(%)

14.01

Key countries

US, China, Japan, India, and Germany

Competitive landscape

Leading Companies, Market Positioning of Companies, Competitive Strategies, and Industry Risks

Request Free Sample

What are the Key Data Covered in this Market Research and Growth Report?

  • CAGR of the Microgrid As A Service industry during the forecast period
  • Detailed information on factors that will drive the market growth and forecasting between 2024 and 2028
  • Precise estimation of the size of the market and its contribution of the industry in focus to the parent market
  • Accurate predictions about upcoming growth and trends and changes in consumer behaviour
  • Growth of the market across APAC, North America, Europe, South America, and Middle East and Africa
  • Thorough analysis of the market's competitive landscape and detailed information about companies
  • Comprehensive analysis of factors that will challenge the microgrid as a service market growth of industry companies

We can help! Our analysts can customize this microgrid as a service market research report to meet your requirements.

Get in touch

1 Executive Summary

  • 1.1 Market overview
    • Executive Summary - Chart on Market Overview
    • Executive Summary - Data Table on Market Overview
    • Executive Summary - Chart on Global Market Characteristics
    • Executive Summary - Chart on Market by Geography
    • Executive Summary - Chart on Market Segmentation by Service Type
    • Executive Summary - Chart on Market Segmentation by Type
    • Executive Summary - Chart on Incremental Growth
    • Executive Summary - Data Table on Incremental Growth
    • Executive Summary - Chart on Company Market Positioning

2 Market Landscape

  • 2.1 Market ecosystem
    • Parent Market
    • Data Table on - Parent Market
  • 2.2 Market characteristics
    • Market characteristics analysis
  • 2.3 Value chain analysis
    • Value Chain Analysis

3 Market Sizing

  • 3.1 Market definition
    • Offerings of companies included in the market definition
  • 3.2 Market segment analysis
    • Market segments
  • 3.3 Market size 2023
    • 3.4 Market outlook: Forecast for 2023-2028
      • Chart on Global - Market size and forecast 2023-2028 ($ million)
      • Data Table on Global - Market size and forecast 2023-2028 ($ million)
      • Chart on Global Market: Year-over-year growth 2023-2028 (%)
      • Data Table on Global Market: Year-over-year growth 2023-2028 (%)

    4 Historic Market Size

    • 4.1 Global Microgrid As A Service Market 2018 - 2022
      • Historic Market Size - Data Table on Global Microgrid As A Service Market 2018 - 2022 ($ million)
    • 4.2 Service Type segment analysis 2018 - 2022
      • Historic Market Size - Service Type Segment 2018 - 2022 ($ million)
    • 4.3 Type segment analysis 2018 - 2022
      • Historic Market Size - Type Segment 2018 - 2022 ($ million)
    • 4.4 Geography segment analysis 2018 - 2022
      • Historic Market Size - Geography Segment 2018 - 2022 ($ million)
    • 4.5 Country segment analysis 2018 - 2022
      • Historic Market Size - Country Segment 2018 - 2022 ($ million)

    5 Five Forces Analysis

    • 5.1 Five forces summary
      • Five forces analysis - Comparison between 2023 and 2028
    • 5.2 Bargaining power of buyers
      • Bargaining power of buyers - Impact of key factors 2023 and 2028
    • 5.3 Bargaining power of suppliers
      • Bargaining power of suppliers - Impact of key factors in 2023 and 2028
    • 5.4 Threat of new entrants
      • Threat of new entrants - Impact of key factors in 2023 and 2028
    • 5.5 Threat of substitutes
      • Threat of substitutes - Impact of key factors in 2023 and 2028
    • 5.6 Threat of rivalry
      • Threat of rivalry - Impact of key factors in 2023 and 2028
    • 5.7 Market condition
      • Chart on Market condition - Five forces 2023 and 2028

    6 Market Segmentation by Service Type

    • 6.1 Market segments
      • Chart on Service Type - Market share 2023-2028 (%)
      • Data Table on Service Type - Market share 2023-2028 (%)
    • 6.2 Comparison by Service Type
      • Chart on Comparison by Service Type
      • Data Table on Comparison by Service Type
    • 6.3 Software as a service - Market size and forecast 2023-2028
      • Chart on Software as a service - Market size and forecast 2023-2028 ($ million)
      • Data Table on Software as a service - Market size and forecast 2023-2028 ($ million)
      • Chart on Software as a service - Year-over-year growth 2023-2028 (%)
      • Data Table on Software as a service - Year-over-year growth 2023-2028 (%)
    • 6.4 Monitoring and control services - Market size and forecast 2023-2028
      • Chart on Monitoring and control services - Market size and forecast 2023-2028 ($ million)
      • Data Table on Monitoring and control services - Market size and forecast 2023-2028 ($ million)
      • Chart on Monitoring and control services - Year-over-year growth 2023-2028 (%)
      • Data Table on Monitoring and control services - Year-over-year growth 2023-2028 (%)
    • 6.5 Engineering and design services - Market size and forecast 2023-2028
      • Chart on Engineering and design services - Market size and forecast 2023-2028 ($ million)
      • Data Table on Engineering and design services - Market size and forecast 2023-2028 ($ million)
      • Chart on Engineering and design services - Year-over-year growth 2023-2028 (%)
      • Data Table on Engineering and design services - Year-over-year growth 2023-2028 (%)
    • 6.6 Market opportunity by Service Type
      • Market opportunity by Service Type ($ million)
      • Data Table on Market opportunity by Service Type ($ million)

    7 Market Segmentation by Type

    • 7.1 Market segments
      • Chart on Type - Market share 2023-2028 (%)
      • Data Table on Type - Market share 2023-2028 (%)
    • 7.2 Comparison by Type
      • Chart on Comparison by Type
      • Data Table on Comparison by Type
    • 7.3 Remote - Market size and forecast 2023-2028
      • Chart on Remote - Market size and forecast 2023-2028 ($ million)
      • Data Table on Remote - Market size and forecast 2023-2028 ($ million)
      • Chart on Remote - Year-over-year growth 2023-2028 (%)
      • Data Table on Remote - Year-over-year growth 2023-2028 (%)
    • 7.4 Grid-connected - Market size and forecast 2023-2028
      • Chart on Grid-connected - Market size and forecast 2023-2028 ($ million)
      • Data Table on Grid-connected - Market size and forecast 2023-2028 ($ million)
      • Chart on Grid-connected - Year-over-year growth 2023-2028 (%)
      • Data Table on Grid-connected - Year-over-year growth 2023-2028 (%)
    • 7.5 Networked - Market size and forecast 2023-2028
      • Chart on Networked - Market size and forecast 2023-2028 ($ million)
      • Data Table on Networked - Market size and forecast 2023-2028 ($ million)
      • Chart on Networked - Year-over-year growth 2023-2028 (%)
      • Data Table on Networked - Year-over-year growth 2023-2028 (%)
    • 7.6 Market opportunity by Type
      • Market opportunity by Type ($ million)
      • Data Table on Market opportunity by Type ($ million)

    8 Customer Landscape

    • 8.1 Customer landscape overview
      • Analysis of price sensitivity, lifecycle, customer purchase basket, adoption rates, and purchase criteria

    9 Geographic Landscape

    • 9.1 Geographic segmentation
      • Chart on Market share by geography 2023-2028 (%)
      • Data Table on Market share by geography 2023-2028 (%)
    • 9.2 Geographic comparison
      • Chart on Geographic comparison
      • Data Table on Geographic comparison
    • 9.3 APAC - Market size and forecast 2023-2028
      • Chart on APAC - Market size and forecast 2023-2028 ($ million)
      • Data Table on APAC - Market size and forecast 2023-2028 ($ million)
      • Chart on APAC - Year-over-year growth 2023-2028 (%)
      • Data Table on APAC - Year-over-year growth 2023-2028 (%)
    • 9.4 North America - Market size and forecast 2023-2028
      • Chart on North America - Market size and forecast 2023-2028 ($ million)
      • Data Table on North America - Market size and forecast 2023-2028 ($ million)
      • Chart on North America - Year-over-year growth 2023-2028 (%)
      • Data Table on North America - Year-over-year growth 2023-2028 (%)
    • 9.5 Europe - Market size and forecast 2023-2028
      • Chart on Europe - Market size and forecast 2023-2028 ($ million)
      • Data Table on Europe - Market size and forecast 2023-2028 ($ million)
      • Chart on Europe - Year-over-year growth 2023-2028 (%)
      • Data Table on Europe - Year-over-year growth 2023-2028 (%)
    • 9.6 South America - Market size and forecast 2023-2028
      • Chart on South America - Market size and forecast 2023-2028 ($ million)
      • Data Table on South America - Market size and forecast 2023-2028 ($ million)
      • Chart on South America - Year-over-year growth 2023-2028 (%)
      • Data Table on South America - Year-over-year growth 2023-2028 (%)
    • 9.7 Middle East and Africa - Market size and forecast 2023-2028
      • Chart on Middle East and Africa - Market size and forecast 2023-2028 ($ million)
      • Data Table on Middle East and Africa - Market size and forecast 2023-2028 ($ million)
      • Chart on Middle East and Africa - Year-over-year growth 2023-2028 (%)
      • Data Table on Middle East and Africa - Year-over-year growth 2023-2028 (%)
    • 9.8 US - Market size and forecast 2023-2028
      • Chart on US - Market size and forecast 2023-2028 ($ million)
      • Data Table on US - Market size and forecast 2023-2028 ($ million)
      • Chart on US - Year-over-year growth 2023-2028 (%)
      • Data Table on US - Year-over-year growth 2023-2028 (%)
    • 9.9 China - Market size and forecast 2023-2028
      • Chart on China - Market size and forecast 2023-2028 ($ million)
      • Data Table on China - Market size and forecast 2023-2028 ($ million)
      • Chart on China - Year-over-year growth 2023-2028 (%)
      • Data Table on China - Year-over-year growth 2023-2028 (%)
    • 9.10 Japan - Market size and forecast 2023-2028
      • Chart on Japan - Market size and forecast 2023-2028 ($ million)
      • Data Table on Japan - Market size and forecast 2023-2028 ($ million)
      • Chart on Japan - Year-over-year growth 2023-2028 (%)
      • Data Table on Japan - Year-over-year growth 2023-2028 (%)
    • 9.11 India - Market size and forecast 2023-2028
      • Chart on India - Market size and forecast 2023-2028 ($ million)
      • Data Table on India - Market size and forecast 2023-2028 ($ million)
      • Chart on India - Year-over-year growth 2023-2028 (%)
      • Data Table on India - Year-over-year growth 2023-2028 (%)
    • 9.12 Germany - Market size and forecast 2023-2028
      • Chart on Germany - Market size and forecast 2023-2028 ($ million)
      • Data Table on Germany - Market size and forecast 2023-2028 ($ million)
      • Chart on Germany - Year-over-year growth 2023-2028 (%)
      • Data Table on Germany - Year-over-year growth 2023-2028 (%)
    • 9.13 Market opportunity by geography
      • Market opportunity by geography ($ million)
      • Data Tables on Market opportunity by geography ($ million)

    10 Drivers, Challenges, and Opportunity/Restraints

    • 10.1 Market drivers
      • 10.2 Market challenges
        • 10.3 Impact of drivers and challenges
          • Impact of drivers and challenges in 2023 and 2028
        • 10.4 Market opportunities/restraints

          11 Competitive Landscape

          • 11.1 Overview
            • 11.2 Competitive Landscape
              • Overview on criticality of inputs and factors of differentiation
            • 11.3 Landscape disruption
              • Overview on factors of disruption
            • 11.4 Industry risks
              • Impact of key risks on business

            12 Competitive Analysis

            • 12.1 Companies profiled
              • Companies covered
            • 12.2 Market positioning of companies
              • Matrix on companies position and classification
            • 12.3 ABB Ltd.
              • ABB Ltd. - Overview
              • ABB Ltd. - Business segments
              • ABB Ltd. - Key news
              • ABB Ltd. - Key offerings
              • ABB Ltd. - Segment focus
            • 12.4 Aggreko Plc
              • Aggreko Plc - Overview
              • Aggreko Plc - Product / Service
              • Aggreko Plc - Key offerings
            • 12.5 AIO Systems Ltd.
              • AIO Systems Ltd. - Overview
              • AIO Systems Ltd. - Product / Service
              • AIO Systems Ltd. - Key offerings
            • 12.6 Anbaric Development Partners LLC
              • Anbaric Development Partners LLC - Overview
              • Anbaric Development Partners LLC - Product / Service
              • Anbaric Development Partners LLC - Key offerings
            • 12.7 Capstone Green Energy Corp.
              • Capstone Green Energy Corp. - Overview
              • Capstone Green Energy Corp. - Business segments
              • Capstone Green Energy Corp. - Key news
              • Capstone Green Energy Corp. - Key offerings
              • Capstone Green Energy Corp. - Segment focus
            • 12.8 Eaton Corp. Plc
              • Eaton Corp. Plc - Overview
              • Eaton Corp. Plc - Business segments
              • Eaton Corp. Plc - Key news
              • Eaton Corp. Plc - Key offerings
              • Eaton Corp. Plc - Segment focus
            • 12.9 ENGIE SA
              • ENGIE SA - Overview
              • ENGIE SA - Business segments
              • ENGIE SA - Key news
              • ENGIE SA - Key offerings
              • ENGIE SA - Segment focus
            • 12.10 General Electric Co.
              • General Electric Co. - Overview
              • General Electric Co. - Business segments
              • General Electric Co. - Key news
              • General Electric Co. - Key offerings
              • General Electric Co. - Segment focus
            • 12.11 NRG Energy Inc.
              • NRG Energy Inc. - Overview
              • NRG Energy Inc. - Business segments
              • NRG Energy Inc. - Key offerings
              • NRG Energy Inc. - Segment focus
            • 12.12 Pareto Energy
              • Pareto Energy - Overview
              • Pareto Energy - Product / Service
              • Pareto Energy - Key offerings
            • 12.13 Schneider Electric SE
              • Schneider Electric SE - Overview
              • Schneider Electric SE - Business segments
              • Schneider Electric SE - Key news
              • Schneider Electric SE - Key offerings
              • Schneider Electric SE - Segment focus
            • 12.14 Siemens AG
              • Siemens AG - Overview
              • Siemens AG - Business segments
              • Siemens AG - Key news
              • Siemens AG - Key offerings
              • Siemens AG - Segment focus
            • 12.15 Spirae LLC
              • Spirae LLC - Overview
              • Spirae LLC - Product / Service
              • Spirae LLC - Key offerings
            • 12.16 Tech Mahindra Ltd.
              • Tech Mahindra Ltd. - Overview
              • Tech Mahindra Ltd. - Business segments
              • Tech Mahindra Ltd. - Key news
              • Tech Mahindra Ltd. - Key offerings
              • Tech Mahindra Ltd. - Segment focus
            • 12.17 Tesla Inc.
              • Tesla Inc. - Overview
              • Tesla Inc. - Business segments
              • Tesla Inc. - Key news
              • Tesla Inc. - Key offerings
              • Tesla Inc. - Segment focus

            13 Appendix

            • 13.1 Scope of the report
              • 13.2 Inclusions and exclusions checklist
                • Inclusions checklist
                • Exclusions checklist
              • 13.3 Currency conversion rates for US$
                • Currency conversion rates for US$
              • 13.4 Research methodology
                • Research methodology
              • 13.5 Data procurement
                • Information sources
              • 13.6 Data validation
                • Data validation
              • 13.7 Validation techniques employed for market sizing
                • Validation techniques employed for market sizing
              • 13.8 Data synthesis
                • Data synthesis
              • 13.9 360 degree market analysis
                • 360 degree market analysis
              • 13.10 List of abbreviations
                • List of abbreviations

              Research Methodology

              Technavio presents a detailed picture of the market by way of study, synthesis, and summation of data from multiple sources. The analysts have presented the various facets of the market with a particular focus on identifying the key industry influencers. The data thus presented is comprehensive, reliable, and the result of extensive research, both primary and secondary.

              INFORMATION SOURCES

              Primary sources

              • Manufacturers and suppliers
              • Channel partners
              • Industry experts
              • Strategic decision makers

              Secondary sources

              • Industry journals and periodicals
              • Government data
              • Financial reports of key industry players
              • Historical data
              • Press releases

              DATA ANALYSIS

              Data Synthesis

              • Collation of data
              • Estimation of key figures
              • Analysis of derived insights

              Data Validation

              • Triangulation with data models
              • Reference against proprietary databases
              • Corroboration with industry experts

              REPORT WRITING

              Qualitative

              • Market drivers
              • Market challenges
              • Market trends
              • Five forces analysis

              Quantitative

              • Market size and forecast
              • Market segmentation
              • Geographical insights
              • Competitive landscape

              Interested in this report?

              Get your sample now to see our research methodology and insights!

              Download Now

              Frequently Asked Questions

              Microgrid As A Service market growth will increase by $ 8658.3 mn during 2024-2028.

              The Microgrid As A Service market is expected to grow at a CAGR of 16.83% during 2024-2028.

              Microgrid As A Service market is segmented by Service Type( Software as a service, Monitoring and control services, Engineering and design services) Type( Remote, Grid-connected, Networked)

              ABB Ltd., Aggreko Plc, AIO Systems Ltd., Anbaric Development Partners LLC, Canopy Power, Capstone Green Energy Corp., Duke Energy Corp., Eaton Corp. Plc, Emerson Electric Co., Enchanted Rock LLC, ENGIE SA, General Electric Co., General MicroGrids, Metco Engineering, NRG Energy Inc., Pareto Energy, Schneider Electric SE, Siemens AG, Spirae LLC, Tech Mahindra Ltd., Tesla Inc. are a few of the key vendors in the Microgrid As A Service market.

              APAC will register the highest growth rate of 47% among the other regions. Therefore, the Microgrid As A Service market in APAC is expected to garner significant business opportunities for the vendors during the forecast period.

              US, China, Japan, India, Germany

              • Growing demand for microgridsAging infrastructure is the driving factor this market.
              • climate change is the driving factor this market.
              • rising energy costs is the driving factor this market.
              • and mass electrification are some major problems in the power industry. These problems are common across the world in any power industry and occur at different levels. Developed countries have well-developed power infrastructure that faces outages due to aging infrastructure is the driving factor this market.
              • whereas developing countries such as Asia and Africa suffer from low electrification rates. Traditional grids follow a hierarchical power structure is the driving factor this market.
              • where power is generated at a central location and then sent through the transmission line to substations is the driving factor this market.
              • distribution lines is the driving factor this market.
              • and finally to the end-users.   Any problem in one part of the system tends to have a domino effect on the rest of the system is the driving factor this market.
              • thereby affecting the reliability of the grid. Therefore is the driving factor this market.
              • the need to overcome the challenges faced by traditional grids has driven the need for microgrids.   A microgrid is a composition of multiple energy generation sources such as wind is the driving factor this market.
              • solar is the driving factor this market.
              • biomass is the driving factor this market.
              • geothermal is the driving factor this market.
              • and fossil fuels that are used to supply energy to a local community is the driving factor this market.
              • university is the driving factor this market.
              • or military base. These microgrids are connected to the main grid as a single point of load. The use of renewable sources along with energy storage systems makes microgrids self-sufficient and allows them to generate power as long as the sun is shining and the wind is blowing. The entire network can be managed by an energy management system. Microgrids can be grid-connected to supply power blended with their own source or can operate independently of the grid. They provide electricity backup and offer ancillary services to the main grid at times of power outages. Such factors are expected to drive the growth of the global microgrid as a service market during the forecast period.  is the driving factor this market.

              The Microgrid As A Service market vendors should focus on grabbing business opportunities from the Software as a service segment as it accounted for the largest market share in the base year.