Mid-high Level Precision GPS Market Analysis, Size, and Forecast 2025-2029: North America (US, Canada, and Mexico), Europe (Germany, UK, and France), APAC (China, Japan, and India), Middle East and Africa (Saudi Arabia, UAE, and South Africa), South America (Brazil, Argentina, and Colombia), and Rest of World (ROW)

Mid-high Level Precision GPS Market Analysis, Size, and Forecast 2025-2029:
North America (US, Canada, and Mexico), Europe (Germany, UK, and France), APAC (China, Japan, and India), Middle East and Africa (Saudi Arabia, UAE, and South Africa), South America (Brazil, Argentina, and Colombia), and Rest of World (ROW)

Published: Dec 2025 291 Pages SKU: IRTNTR81127

Market Overview at a Glance

$3.20 B
Market Opportunity
15.5%
CAGR 2024 - 2029
36.3%
North America Growth
$1.66 B
Single frequency segment 2023

Mid-high Level Precision GPS Market Size 2025-2029

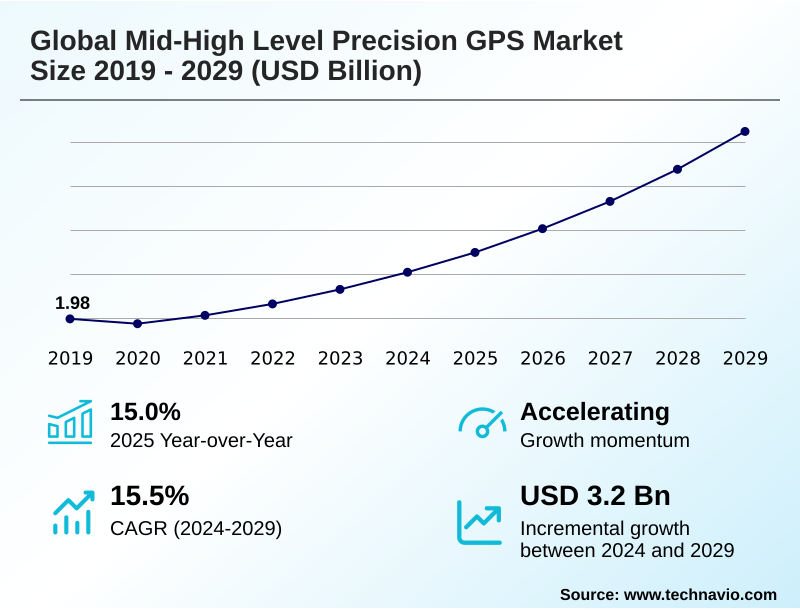
The mid-high level precision gps market size is valued to increase by USD 3.20 billion, at a CAGR of 15.5% from 2024 to 2029. Proliferation of automation and autonomous systems across key industries will drive the mid-high level precision gps market.

Major Market Trends & Insights

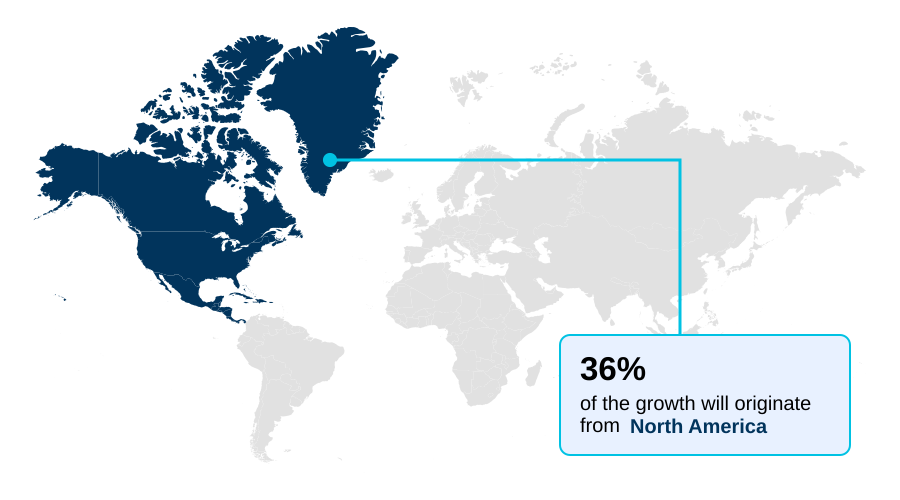
  • North America dominated the market and accounted for a 36.3% growth during the forecast period.
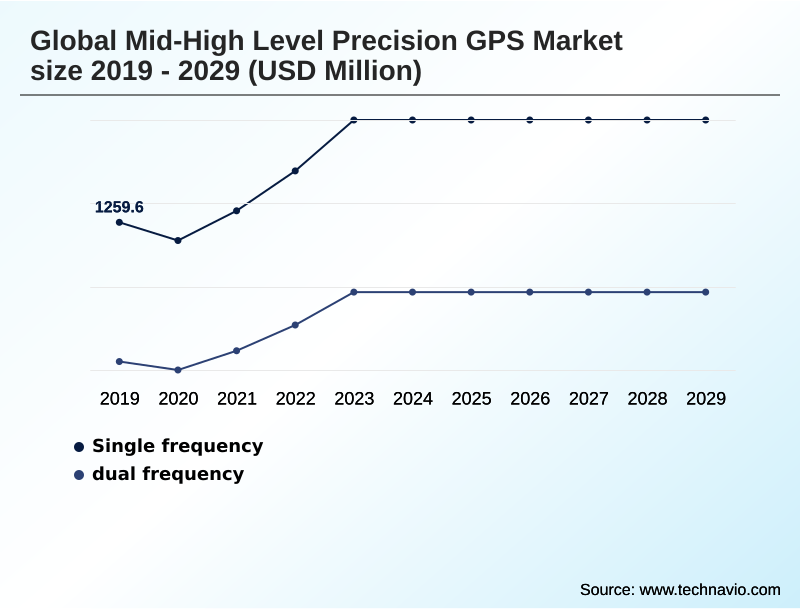
  • By Frequency Range - Single frequency segment was valued at USD 1.66 billion in 2023
  • By Type - Differential grade segment accounted for the largest market revenue share in 2023

Market Size & Forecast

  • Market Opportunities: USD 4.26 billion
  • Market Future Opportunities: USD 3.20 billion
  • CAGR from 2024 to 2029 : 15.5%

Market Summary

  • The mid-high level precision GPS market is defined by hardware, software, and services engineered for sub-meter to centimeter-level accuracy. This is achieved using advanced multi-constellation GNSS and multi-frequency receivers that process signals from multiple satellite systems.
  • The core of this market is the use of augmentation techniques like Real Time Kinematic (RTK) and Precise Point Positioning (PPP), which correct for atmospheric and other signal errors. This technology is critical for professional sectors where precise location is non-negotiable.
  • For instance, in a large-scale construction project, machine control systems on earthmoving equipment use this precision to grade sites according to digital plans, ensuring accuracy and reducing rework. The expansion of automation, the push for industrial digitalization through digital twins, and the constant modernization of satellite infrastructure are key drivers.
  • However, challenges such as signal vulnerability in obstructed environments and the high total cost of ownership persist, shaping the competitive landscape for applications in surveying, agriculture, and autonomous mobility.

What will be the Size of the Mid-high Level Precision GPS Market during the forecast period?

Get Key Insights on Market Forecast (PDF) Request Free Sample

How is the Mid-high Level Precision GPS Market Segmented?

The mid-high level precision gps industry research report provides comprehensive data (region-wise segment analysis), with forecasts and estimates in "USD million" for the period 2025-2029, as well as historical data from 2019-2023 for the following segments.

  • Frequency range
    • Single frequency
    • Dual frequency
  • Type
    • Differential grade
    • Survey grade
  • End-user
    • Agriculture
    • Construction
    • Oil and gas
    • Others
  • Geography
    • North America
      • US
      • Canada
      • Mexico
    • Europe
      • Germany
      • UK
      • France
    • APAC
      • China
      • Japan
      • India
    • Middle East and Africa
      • Saudi Arabia
      • UAE
      • South Africa
    • South America
      • Brazil
      • Argentina
      • Colombia
    • Rest of World (ROW)

By Frequency Range Insights

The single frequency segment is estimated to witness significant growth during the forecast period.

The mid-high level precision GPS market is segmented by offerings, including a foundational category that leverages single-frequency bands.

These solutions are defined by lower cost and power consumption, but their reliance on a single band makes them susceptible to ionospheric scintillation, a significant source of positional error. Performance can be compromised in environments prone to multipath interference.

Despite these limitations, advancements in processing and the use of a satellite based augmentation system (sbas) are improving performance. For applications in autonomous systems navigation, where meter-level precision is adequate, these systems provide a cost-effective solution.

The ongoing focus on optimizing system on chip (soc) design and providing georeferenced data for less demanding fleet management optimization ensures this segment's continued relevance, reducing data acquisition errors by up to 30% compared to uncorrected devices.

Request Free Sample

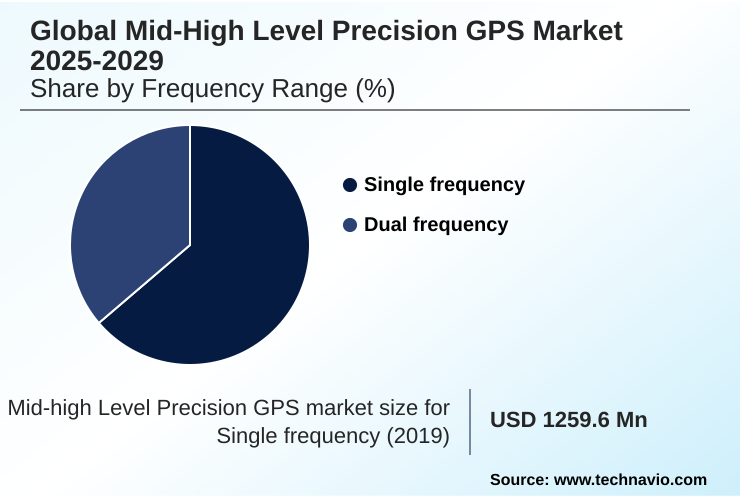
The Single frequency segment was valued at USD 1.66 billion in 2023 and showed a gradual increase during the forecast period.

Request Free Sample

Regional Analysis

North America is estimated to contribute 36.3% to the growth of the global market during the forecast period.Technavio’s analysts have elaborately explained the regional trends and drivers that shape the market during the forecast period.

See How Mid-high Level Precision GPS Market Demand is Rising in North America Request Free Sample

The geographic landscape of the mid-high level precision GPS market is diverse, with regional dynamics shaped by distinct industrial priorities.

North America leads in developing autonomous systems, while Europe's market is driven by its advanced automotive sector and the Galileo satellite system, which offers a high-accuracy service enabling 20-centimeter precision.

APAC is the fastest-growing region, fueled by China's massive infrastructure projects and the BeiDou Navigation Satellite System (BDS). The adoption of reality capture technology is pivotal for these large-scale developments.

In South America, demand is concentrated in large-scale agriculture and mining, where precision is essential for operational efficiency. The use of differential grade systems in these sectors boosts productivity by over 25%.

Even in emerging markets in the Middle East and Africa, giga-projects are creating unprecedented demand for survey grade equipment and associated services like remote asset inspection.

Market Dynamics

Our researchers analyzed the data with 2024 as the base year, along with the key drivers, trends, and challenges. A holistic analysis of drivers will help companies refine their marketing strategies to gain a competitive advantage.

  • Strategic decisions in the mid-high level precision GPS market are increasingly influenced by detailed performance evaluations, such as the RTK vs PPP accuracy comparison, which dictates investment choices for specific applications.
  • The trend toward GNSS IMU integration for robotics is critical for ensuring operational continuity in signal-denied environments like warehouses, where navigation errors can be reduced by over 60% compared to systems without it. This addresses a major challenge of GNSS in urban canyons and other obstructed areas.
  • The benefits of multi-band GNSS in agriculture are now well-documented, directly impacting yield through precise machinery guidance. Similarly, the growing adoption of high precision GPS for drone surveying is transforming land management and construction workflows by enabling rapid, accurate data collection.
  • This is central to using GNSS for infrastructure digital twins, where the fidelity of the virtual model depends on the accuracy of the initial geospatial data. As a result, the cost of ownership for survey grade GPS is being weighed against the significant efficiency gains and risk mitigation it provides.
  • The evolution of sensor fusion in autonomous vehicle navigation continues to be a primary area of R&D, as it is fundamental to achieving the required safety and reliability for mass-market deployment.

What are the key market drivers leading to the rise in the adoption of Mid-high Level Precision GPS Industry?

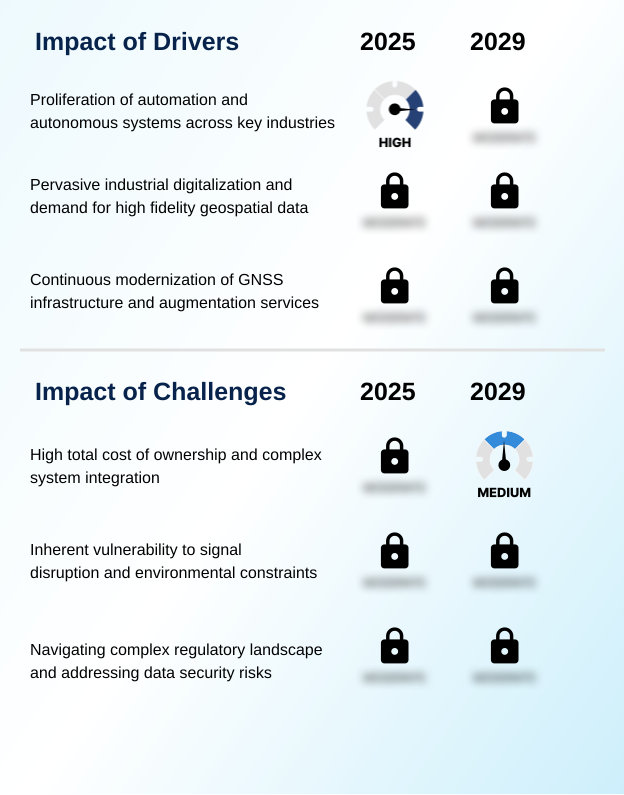
  • The proliferation of automation and autonomous systems across key industries is a primary driver for market growth.

  • Market growth is fundamentally driven by the pervasive trend of industrial digitalization and automation. The demand for high-fidelity geospatial data is surging as industries from agriculture to construction adopt data-driven optimization strategies.
  • For example, the use of precision agriculture applications powered by high-accuracy GNSS has increased crop yields by up to 15% while reducing input costs.
  • Furthermore, the continuous modernization of satellite infrastructure, including the deployment of new constellations and L-band correction signals, enhances signal availability and integrity.
  • This improved infrastructure underpins the expansion of autonomous systems navigation, where reliable centimeter-level accuracy is a prerequisite for safe operation. This technological advancement enables a 20% increase in the operational efficiency of automated machinery in sectors like mining and logistics.

What are the market trends shaping the Mid-high Level Precision GPS Industry?

  • A defining market trend is the convergence of Global Navigation Satellite System (GNSS) technology with sensor fusion. This integration provides more robust and reliable positioning for mission-critical applications.

  • Key trends are reshaping the market, moving beyond standalone hardware to comprehensive positioning engines. The convergence of GNSS with sensor fusion algorithms is critical, creating solutions that provide continuous and reliable navigation. This approach is becoming standard for dynamic positioning systems, where uptime is paramount.
  • By tightly coupling data from multiple sensors, these systems can bridge GNSS signal outages, reducing positioning interruptions by over 80% in obstructed environments like urban canyons. Concurrently, the shift toward positioning as a service (PaaS) and cloud-based platforms is making high precision technology more accessible, converting large capital expenditures into manageable operational costs.
  • This model is accelerating the creation of digital twins and improving site surveying automation, where data can be processed and shared in near-real-time, enhancing collaboration.

What challenges does the Mid-high Level Precision GPS Industry face during its growth?

  • The high total cost of ownership and the complexity of system integration present a key challenge to industry growth.

  • Despite technological advancements, significant challenges constrain broader market adoption. The high total cost of ownership, which includes hardware, software, and recurring subscriptions for correction services, remains a barrier for smaller enterprises. Integrating systems is also complex, often requiring specialized expertise that can increase initial project costs by up to 25%.
  • Furthermore, the inherent vulnerability of GNSS signals to environmental and man-made interference poses a persistent reliability risk. Signal disruption in dense urban canyons can lead to positioning errors or complete loss of service in over 40% of operational time for un-augmented systems.
  • Navigating complex regulatory landscapes and addressing data security risks associated with sensitive geospatial data add further layers of operational complexity, impacting everything from structural health monitoring to pipeline integrity management and smart city infrastructure.

Exclusive Technavio Analysis on Customer Landscape

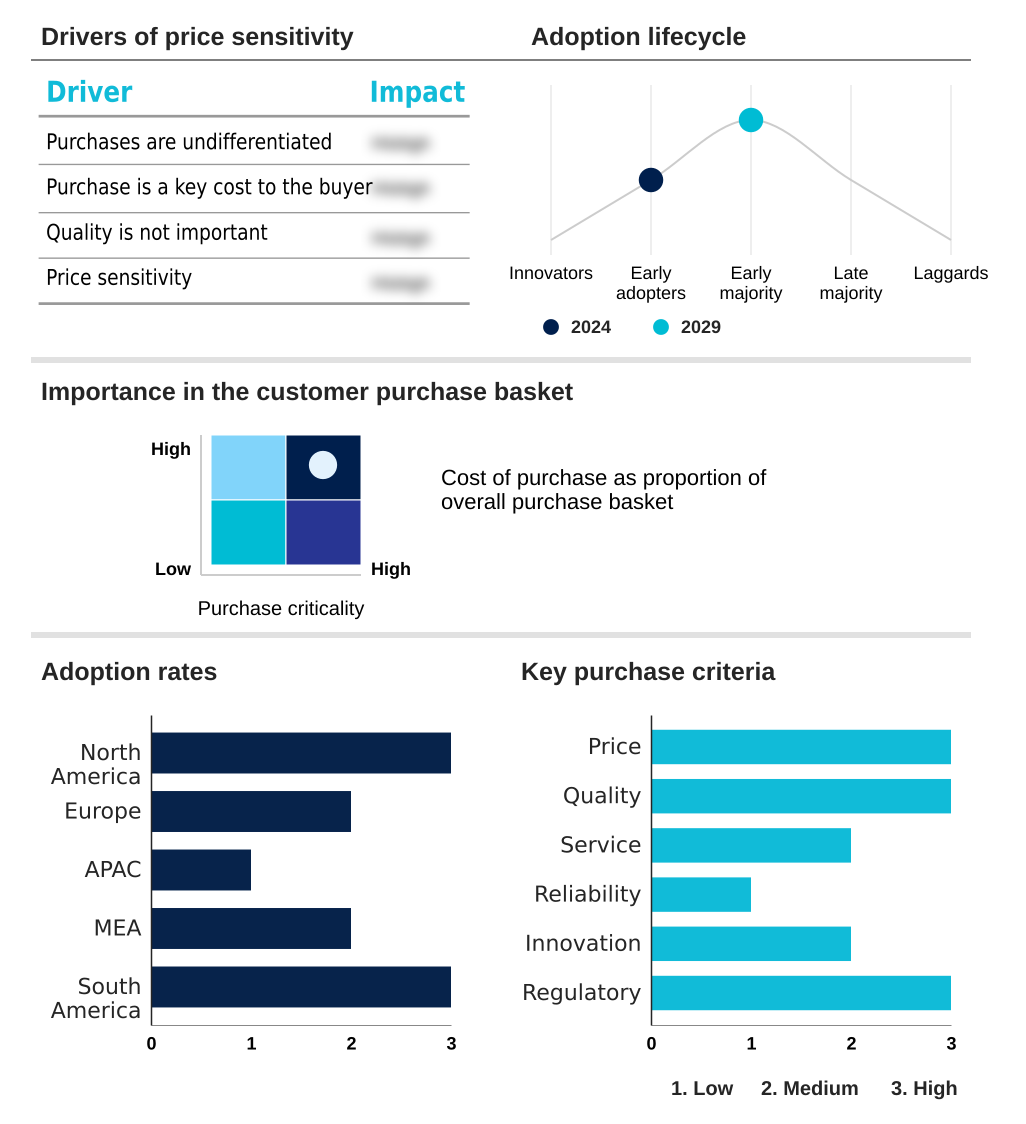
The mid-high level precision gps market forecasting report includes the adoption lifecycle of the market, covering from the innovator’s stage to the laggard’s stage. It focuses on adoption rates in different regions based on penetration. Furthermore, the mid-high level precision gps market report also includes key purchase criteria and drivers of price sensitivity to help companies evaluate and develop their market growth analysis strategies.

Customer Landscape of Mid-high Level Precision GPS Industry

Competitive Landscape

Companies are implementing various strategies, such as strategic alliances, mid-high level precision gps market forecast, partnerships, mergers and acquisitions, geographical expansion, and product/service launches, to enhance their presence in the industry.

AAA Taranis Visual Ltd. - Engineered GNSS systems with proprietary engines, tilt compensation, and versatile correction services deliver high-integrity positioning for professional applications.

The industry research and growth report includes detailed analyses of the competitive landscape of the market and information about key companies, including:

  • AAA Taranis Visual Ltd.
  • Ag Leader Technology
  • AGCO Corp.
  • AgEagle Aerial Systems
  • Bayer AG
  • CropMetrics LLC
  • CropX Technologies Ltd.
  • Deere and Co.
  • Digital Agri Solutions
  • Farmers Edge Inc.
  • GEA Group AG
  • Madison One Holdings LLC
  • Precision Planting
  • Raven Industries Inc.
  • Tetra Laval SA
  • Topcon Positioning Systems Inc.
  • Trimble Inc.
  • Valmont Industries Inc.

Qualitative and quantitative analysis of companies has been conducted to help clients understand the wider business environment as well as the strengths and weaknesses of key industry players. Data is qualitatively analyzed to categorize companies as pure play, category-focused, industry-focused, and diversified; it is quantitatively analyzed to categorize companies as dominant, leading, strong, tentative, and weak.

Recent Development and News in Mid-high level precision gps market

  • In September, 2024, Trimble Inc. launched a new line of compact, low-power multi-frequency receivers designed for mass-market deployment in autonomous lawnmowers and delivery robots, aiming to democratize centimeter-level accuracy.
  • In November, 2024, Hexagon AB announced a strategic partnership with a leading automotive Tier 1 supplier to integrate its Precise Point Positioning (PPP) correction services directly into next-generation vehicle infotainment platforms, enabling lane-level navigation as a standard feature.
  • In February, 2025, Deere and Co. acquired a European startup specializing in AI-driven sensor fusion algorithms, a move intended to enhance the performance of its autonomous tractors in environments with frequent GNSS signal outages.
  • In April, 2025, the European Union Agency for the Space Programme (EUSPA) declared the initial operational capability of a new Galileo authentication service, providing a verifiable layer of trust for safety-critical applications like unmanned aerial vehicle (UAV) guidance in controlled airspace.

Dive into Technavio’s robust research methodology, blending expert interviews, extensive data synthesis, and validated models for unparalleled Mid-high Level Precision GPS Market insights. See full methodology.

Market Scope
Page number 291
Base year 2024
Historic period 2019-2023
Forecast period 2025-2029
Growth momentum & CAGR Accelerate at a CAGR of 15.5%
Market growth 2025-2029 USD 3201.7 million
Market structure Fragmented
YoY growth 2024-2025(%) 15.0%
Key countries US, Canada, Mexico, Germany, UK, France, Italy, Spain, The Netherlands, China, Japan, India, South Korea, Australia, Indonesia, Saudi Arabia, UAE, South Africa, Turkey, Israel, Brazil, Argentina and Colombia
Competitive landscape Leading Companies, Market Positioning of Companies, Competitive Strategies, and Industry Risks

Request Free Sample

Research Analyst Overview

  • The mid-high level precision GPS market is evolving beyond hardware-centric sales into an integrated ecosystem where data and services are paramount. At the core of this transformation are advanced technologies like multi-constellation GNSS and multi-frequency receivers, which are becoming standard.
  • The use of carrier phase measurement techniques, including real time kinematic (RTK) and precise point positioning (PPP), delivers the centimeter-level accuracy required by professional applications. For boardroom consideration, the decision to invest in survey grade equipment versus less precise differential grade systems now hinges on the total cost of ownership versus the ROI from operational efficiency.
  • For instance, adopting systems with advanced multipath mitigation and anti-jamming capabilities, often coupled with inertial measurement units (IMUs) using dead reckoning technology, ensures uptime in challenging environments, achieving a 30% reduction in field survey times.
  • This reliability is critical for geodetic surveying, machine control systems, and preventing gnss signal outages, making technology selection a key strategic decision impacting long-term capital expenditure and project viability.

What are the Key Data Covered in this Mid-high Level Precision GPS Market Research and Growth Report?

  • What is the expected growth of the Mid-high Level Precision GPS Market between 2025 and 2029?

    • USD 3.20 billion, at a CAGR of 15.5%

  • What segmentation does the market report cover?

    • The report is segmented by Frequency Range (Single frequency, and dual frequency), Type (Differential grade, and Survey grade), End-user (Agriculture, Construction, Oil and gas, and Others) and Geography (North America, Europe, APAC, Middle East and Africa, South America)

  • Which regions are analyzed in the report?

    • North America, Europe, APAC, Middle East and Africa and South America

  • What are the key growth drivers and market challenges?

    • Proliferation of automation and autonomous systems across key industries, High total cost of ownership and complex system integration

  • Who are the major players in the Mid-high Level Precision GPS Market?

    • AAA Taranis Visual Ltd., Ag Leader Technology, AGCO Corp., AgEagle Aerial Systems, Bayer AG, CropMetrics LLC, CropX Technologies Ltd., Deere and Co., Digital Agri Solutions, Farmers Edge Inc., GEA Group AG, Madison One Holdings LLC, Precision Planting, Raven Industries Inc., Tetra Laval SA, Topcon Positioning Systems Inc., Trimble Inc. and Valmont Industries Inc.

Market Research Insights

  • The market's momentum is driven by the demand for high-fidelity geospatial data across industries. The adoption of positioning as a service (PaaS) is lowering entry barriers, enabling more businesses to access advanced capabilities. For example, using this model for as-built verification improves accuracy by over 40% compared to traditional methods.
  • Furthermore, the integration of this technology in the construction project lifecycle has demonstrated a 15% reduction in project timelines by minimizing rework. The push for lane-level positioning in advanced driver assistance systems (ADAS) and the need for precision in variable rate technology (VRT) for agriculture are expanding application frontiers.
  • This shift toward service-based, high-accuracy solutions is reshaping operational standards and creating new value streams.

We can help! Our analysts can customize this mid-high level precision gps market research report to meet your requirements.

Get in touch

1. Executive Summary

1.1 Market overview

Executive Summary - Chart on Market Overview
Executive Summary - Data Table on Market Overview
Executive Summary - Chart on Global Market Characteristics
Executive Summary - Chart on Market by Geography
Executive Summary - Chart on Market Segmentation by Frequency Range
Executive Summary - Chart on Market Segmentation by Type
Executive Summary - Chart on Market Segmentation by End-user
Executive Summary - Chart on Incremental Growth
Executive Summary - Data Table on Incremental Growth
Executive Summary - Chart on Company Market Positioning

2. Technavio Analysis

2.1 Analysis of price sensitivity, lifecycle, customer purchase basket, adoption rates, and purchase criteria

2.2 Criticality of inputs and Factors of differentiation

Chart on Overview on criticality of inputs and factors of differentiation

2.3 Factors of disruption

Chart on Overview on factors of disruption

2.4 Impact of drivers and challenges

Chart on Impact of drivers and challenges in 2024 and 2029

3. Market Landscape

3.1 Market ecosystem

Chart on Parent Market
Data Table on - Parent Market

3.2 Market characteristics

Chart on Market characteristics analysis

3.3 Value chain analysis

Chart on Value chain analysis

4. Market Sizing

4.1 Market definition

Data Table on Offerings of companies included in the market definition

4.2 Market segment analysis

Market segments

4.3 Market size 2024

4.4 Market outlook: Forecast for 2024-2029

Chart on Global - Market size and forecast 2024-2029 ($ million)
Data Table on Global - Market size and forecast 2024-2029 ($ million)
Chart on Global Market: Year-over-year growth 2024-2029 (%)
Data Table on Global Market: Year-over-year growth 2024-2029 (%)

5. Historic Market Size

5.1 Global Mid-High Level Precision GPS Market 2019 - 2023

Historic Market Size - Data Table on Global Mid-High Level Precision GPS Market 2019 - 2023 ($ million)

5.2 Frequency Range segment analysis 2019 - 2023

Historic Market Size - Frequency Range Segment 2019 - 2023 ($ million)

5.3 Type segment analysis 2019 - 2023

Historic Market Size - Type Segment 2019 - 2023 ($ million)

5.4 End-user segment analysis 2019 - 2023

Historic Market Size - End-user Segment 2019 - 2023 ($ million)

5.5 Geography segment analysis 2019 - 2023

Historic Market Size - Geography Segment 2019 - 2023 ($ million)

5.6 Country segment analysis 2019 - 2023

Historic Market Size - Country Segment 2019 - 2023 ($ million)

6. Five Forces Analysis

6.1 Five forces summary

Five forces analysis - Comparison between 2024 and 2029

6.2 Bargaining power of buyers

Bargaining power of buyers - Impact of key factors 2024 and 2029

6.3 Bargaining power of suppliers

Bargaining power of suppliers - Impact of key factors in 2024 and 2029

6.4 Threat of new entrants

Threat of new entrants - Impact of key factors in 2024 and 2029

6.5 Threat of substitutes

Threat of substitutes - Impact of key factors in 2024 and 2029

6.6 Threat of rivalry

Threat of rivalry - Impact of key factors in 2024 and 2029

6.7 Market condition

Chart on Market condition - Five forces 2024 and 2029

7. Market Segmentation by Frequency Range

7.1 Market segments

Chart on Frequency Range - Market share 2024-2029 (%)
Data Table on Frequency Range - Market share 2024-2029 (%)

7.2 Comparison by Frequency Range

Chart on Comparison by Frequency Range
Data Table on Comparison by Frequency Range

7.3 Single frequency - Market size and forecast 2024-2029

Chart on Single frequency - Market size and forecast 2024-2029 ($ million)
Data Table on Single frequency - Market size and forecast 2024-2029 ($ million)
Chart on Single frequency - Year-over-year growth 2024-2029 (%)
Data Table on Single frequency - Year-over-year growth 2024-2029 (%)

7.4 Dual frequency - Market size and forecast 2024-2029

Chart on Dual frequency - Market size and forecast 2024-2029 ($ million)
Data Table on Dual frequency - Market size and forecast 2024-2029 ($ million)
Chart on Dual frequency - Year-over-year growth 2024-2029 (%)
Data Table on Dual frequency - Year-over-year growth 2024-2029 (%)

7.5 Market opportunity by Frequency Range

Market opportunity by Frequency Range ($ million)
Data Table on Market opportunity by Frequency Range ($ million)

8. Market Segmentation by Type

8.1 Market segments

Chart on Type - Market share 2024-2029 (%)
Data Table on Type - Market share 2024-2029 (%)

8.2 Comparison by Type

Chart on Comparison by Type
Data Table on Comparison by Type

8.3 Differential grade - Market size and forecast 2024-2029

Chart on Differential grade - Market size and forecast 2024-2029 ($ million)
Data Table on Differential grade - Market size and forecast 2024-2029 ($ million)
Chart on Differential grade - Year-over-year growth 2024-2029 (%)
Data Table on Differential grade - Year-over-year growth 2024-2029 (%)

8.4 Survey grade - Market size and forecast 2024-2029

Chart on Survey grade - Market size and forecast 2024-2029 ($ million)
Data Table on Survey grade - Market size and forecast 2024-2029 ($ million)
Chart on Survey grade - Year-over-year growth 2024-2029 (%)
Data Table on Survey grade - Year-over-year growth 2024-2029 (%)

8.5 Market opportunity by Type

Market opportunity by Type ($ million)
Data Table on Market opportunity by Type ($ million)

9. Market Segmentation by End-user

9.1 Market segments

Chart on End-user - Market share 2024-2029 (%)
Data Table on End-user - Market share 2024-2029 (%)

9.2 Comparison by End-user

Chart on Comparison by End-user
Data Table on Comparison by End-user

9.3 Agriculture - Market size and forecast 2024-2029

Chart on Agriculture - Market size and forecast 2024-2029 ($ million)
Data Table on Agriculture - Market size and forecast 2024-2029 ($ million)
Chart on Agriculture - Year-over-year growth 2024-2029 (%)
Data Table on Agriculture - Year-over-year growth 2024-2029 (%)

9.4 Construction - Market size and forecast 2024-2029

Chart on Construction - Market size and forecast 2024-2029 ($ million)
Data Table on Construction - Market size and forecast 2024-2029 ($ million)
Chart on Construction - Year-over-year growth 2024-2029 (%)
Data Table on Construction - Year-over-year growth 2024-2029 (%)

9.5 Oil and gas - Market size and forecast 2024-2029

Chart on Oil and gas - Market size and forecast 2024-2029 ($ million)
Data Table on Oil and gas - Market size and forecast 2024-2029 ($ million)
Chart on Oil and gas - Year-over-year growth 2024-2029 (%)
Data Table on Oil and gas - Year-over-year growth 2024-2029 (%)

9.6 Others - Market size and forecast 2024-2029

Chart on Others - Market size and forecast 2024-2029 ($ million)
Data Table on Others - Market size and forecast 2024-2029 ($ million)
Chart on Others - Year-over-year growth 2024-2029 (%)
Data Table on Others - Year-over-year growth 2024-2029 (%)

9.7 Market opportunity by End-user

Market opportunity by End-user ($ million)
Data Table on Market opportunity by End-user ($ million)

10. Customer Landscape

10.1 Customer landscape overview

Analysis of price sensitivity, lifecycle, customer purchase basket, adoption rates, and purchase criteria

11. Geographic Landscape

11.1 Geographic segmentation

Chart on Market share by geography 2024-2029 (%)
Data Table on Market share by geography 2024-2029 (%)

11.2 Geographic comparison

Chart on Geographic comparison
Data Table on Geographic comparison

11.3 North America - Market size and forecast 2024-2029

Chart on North America - Market size and forecast 2024-2029 ($ million)
Data Table on North America - Market size and forecast 2024-2029 ($ million)
Chart on North America - Year-over-year growth 2024-2029 (%)
Data Table on North America - Year-over-year growth 2024-2029 (%)
Chart on Regional Comparison - North America
Data Table on Regional Comparison - North America

11.3.1 US - Market size and forecast 2024-2029

Chart on US - Market size and forecast 2024-2029 ($ million)
Data Table on US - Market size and forecast 2024-2029 ($ million)
Chart on US - Year-over-year growth 2024-2029 (%)
Data Table on US - Year-over-year growth 2024-2029 (%)

11.3.2 Canada - Market size and forecast 2024-2029

Chart on Canada - Market size and forecast 2024-2029 ($ million)
Data Table on Canada - Market size and forecast 2024-2029 ($ million)
Chart on Canada - Year-over-year growth 2024-2029 (%)
Data Table on Canada - Year-over-year growth 2024-2029 (%)

11.3.3 Mexico - Market size and forecast 2024-2029

Chart on Mexico - Market size and forecast 2024-2029 ($ million)
Data Table on Mexico - Market size and forecast 2024-2029 ($ million)
Chart on Mexico - Year-over-year growth 2024-2029 (%)
Data Table on Mexico - Year-over-year growth 2024-2029 (%)

11.4 Europe - Market size and forecast 2024-2029

Chart on Europe - Market size and forecast 2024-2029 ($ million)
Data Table on Europe - Market size and forecast 2024-2029 ($ million)
Chart on Europe - Year-over-year growth 2024-2029 (%)
Data Table on Europe - Year-over-year growth 2024-2029 (%)
Chart on Regional Comparison - Europe
Data Table on Regional Comparison - Europe

11.4.1 Germany - Market size and forecast 2024-2029

Chart on Germany - Market size and forecast 2024-2029 ($ million)
Data Table on Germany - Market size and forecast 2024-2029 ($ million)
Chart on Germany - Year-over-year growth 2024-2029 (%)
Data Table on Germany - Year-over-year growth 2024-2029 (%)

11.4.2 UK - Market size and forecast 2024-2029

Chart on UK - Market size and forecast 2024-2029 ($ million)
Data Table on UK - Market size and forecast 2024-2029 ($ million)
Chart on UK - Year-over-year growth 2024-2029 (%)
Data Table on UK - Year-over-year growth 2024-2029 (%)

11.4.3 France - Market size and forecast 2024-2029

Chart on France - Market size and forecast 2024-2029 ($ million)
Data Table on France - Market size and forecast 2024-2029 ($ million)
Chart on France - Year-over-year growth 2024-2029 (%)
Data Table on France - Year-over-year growth 2024-2029 (%)

11.4.4 Italy - Market size and forecast 2024-2029

Chart on Italy - Market size and forecast 2024-2029 ($ million)
Data Table on Italy - Market size and forecast 2024-2029 ($ million)
Chart on Italy - Year-over-year growth 2024-2029 (%)
Data Table on Italy - Year-over-year growth 2024-2029 (%)

11.4.5 Spain - Market size and forecast 2024-2029

Chart on Spain - Market size and forecast 2024-2029 ($ million)
Data Table on Spain - Market size and forecast 2024-2029 ($ million)
Chart on Spain - Year-over-year growth 2024-2029 (%)
Data Table on Spain - Year-over-year growth 2024-2029 (%)

11.4.6 The Netherlands - Market size and forecast 2024-2029

Chart on The Netherlands - Market size and forecast 2024-2029 ($ million)
Data Table on The Netherlands - Market size and forecast 2024-2029 ($ million)
Chart on The Netherlands - Year-over-year growth 2024-2029 (%)
Data Table on The Netherlands - Year-over-year growth 2024-2029 (%)

11.5 APAC - Market size and forecast 2024-2029

Chart on APAC - Market size and forecast 2024-2029 ($ million)
Data Table on APAC - Market size and forecast 2024-2029 ($ million)
Chart on APAC - Year-over-year growth 2024-2029 (%)
Data Table on APAC - Year-over-year growth 2024-2029 (%)
Chart on Regional Comparison - APAC
Data Table on Regional Comparison - APAC

11.5.1 China - Market size and forecast 2024-2029

Chart on China - Market size and forecast 2024-2029 ($ million)
Data Table on China - Market size and forecast 2024-2029 ($ million)
Chart on China - Year-over-year growth 2024-2029 (%)
Data Table on China - Year-over-year growth 2024-2029 (%)

11.5.2 Japan - Market size and forecast 2024-2029

Chart on Japan - Market size and forecast 2024-2029 ($ million)
Data Table on Japan - Market size and forecast 2024-2029 ($ million)
Chart on Japan - Year-over-year growth 2024-2029 (%)
Data Table on Japan - Year-over-year growth 2024-2029 (%)

11.5.3 India - Market size and forecast 2024-2029

Chart on India - Market size and forecast 2024-2029 ($ million)
Data Table on India - Market size and forecast 2024-2029 ($ million)
Chart on India - Year-over-year growth 2024-2029 (%)
Data Table on India - Year-over-year growth 2024-2029 (%)

11.5.4 South Korea - Market size and forecast 2024-2029

Chart on South Korea - Market size and forecast 2024-2029 ($ million)
Data Table on South Korea - Market size and forecast 2024-2029 ($ million)
Chart on South Korea - Year-over-year growth 2024-2029 (%)
Data Table on South Korea - Year-over-year growth 2024-2029 (%)

11.5.5 Australia - Market size and forecast 2024-2029

Chart on Australia - Market size and forecast 2024-2029 ($ million)
Data Table on Australia - Market size and forecast 2024-2029 ($ million)
Chart on Australia - Year-over-year growth 2024-2029 (%)
Data Table on Australia - Year-over-year growth 2024-2029 (%)

11.5.6 Indonesia - Market size and forecast 2024-2029

Chart on Indonesia - Market size and forecast 2024-2029 ($ million)
Data Table on Indonesia - Market size and forecast 2024-2029 ($ million)
Chart on Indonesia - Year-over-year growth 2024-2029 (%)
Data Table on Indonesia - Year-over-year growth 2024-2029 (%)

11.6 Middle East and Africa - Market size and forecast 2024-2029

Chart on Middle East and Africa - Market size and forecast 2024-2029 ($ million)
Data Table on Middle East and Africa - Market size and forecast 2024-2029 ($ million)
Chart on Middle East and Africa - Year-over-year growth 2024-2029 (%)
Data Table on Middle East and Africa - Year-over-year growth 2024-2029 (%)
Chart on Regional Comparison - Middle East and Africa
Data Table on Regional Comparison - Middle East and Africa

11.6.1 Saudi Arabia - Market size and forecast 2024-2029

Chart on Saudi Arabia - Market size and forecast 2024-2029 ($ million)
Data Table on Saudi Arabia - Market size and forecast 2024-2029 ($ million)
Chart on Saudi Arabia - Year-over-year growth 2024-2029 (%)
Data Table on Saudi Arabia - Year-over-year growth 2024-2029 (%)

11.6.2 UAE - Market size and forecast 2024-2029

Chart on UAE - Market size and forecast 2024-2029 ($ million)
Data Table on UAE - Market size and forecast 2024-2029 ($ million)
Chart on UAE - Year-over-year growth 2024-2029 (%)
Data Table on UAE - Year-over-year growth 2024-2029 (%)

11.6.3 South Africa - Market size and forecast 2024-2029

Chart on South Africa - Market size and forecast 2024-2029 ($ million)
Data Table on South Africa - Market size and forecast 2024-2029 ($ million)
Chart on South Africa - Year-over-year growth 2024-2029 (%)
Data Table on South Africa - Year-over-year growth 2024-2029 (%)

11.6.4 Turkey - Market size and forecast 2024-2029

Chart on Turkey - Market size and forecast 2024-2029 ($ million)
Data Table on Turkey - Market size and forecast 2024-2029 ($ million)
Chart on Turkey - Year-over-year growth 2024-2029 (%)
Data Table on Turkey - Year-over-year growth 2024-2029 (%)

11.6.5 Israel - Market size and forecast 2024-2029

Chart on Israel - Market size and forecast 2024-2029 ($ million)
Data Table on Israel - Market size and forecast 2024-2029 ($ million)
Chart on Israel - Year-over-year growth 2024-2029 (%)
Data Table on Israel - Year-over-year growth 2024-2029 (%)

11.7 South America - Market size and forecast 2024-2029

Chart on South America - Market size and forecast 2024-2029 ($ million)
Data Table on South America - Market size and forecast 2024-2029 ($ million)
Chart on South America - Year-over-year growth 2024-2029 (%)
Data Table on South America - Year-over-year growth 2024-2029 (%)
Chart on Regional Comparison - South America
Data Table on Regional Comparison - South America

11.7.1 Brazil - Market size and forecast 2024-2029

Chart on Brazil - Market size and forecast 2024-2029 ($ million)
Data Table on Brazil - Market size and forecast 2024-2029 ($ million)
Chart on Brazil - Year-over-year growth 2024-2029 (%)
Data Table on Brazil - Year-over-year growth 2024-2029 (%)

11.7.2 Argentina - Market size and forecast 2024-2029

Chart on Argentina - Market size and forecast 2024-2029 ($ million)
Data Table on Argentina - Market size and forecast 2024-2029 ($ million)
Chart on Argentina - Year-over-year growth 2024-2029 (%)
Data Table on Argentina - Year-over-year growth 2024-2029 (%)

11.7.3 Colombia - Market size and forecast 2024-2029

Chart on Colombia - Market size and forecast 2024-2029 ($ million)
Data Table on Colombia - Market size and forecast 2024-2029 ($ million)
Chart on Colombia - Year-over-year growth 2024-2029 (%)
Data Table on Colombia - Year-over-year growth 2024-2029 (%)

11.8 Market opportunity by geography

Market opportunity by geography ($ million)
Data Tables on Market opportunity by geography ($ million)

12. Drivers, Challenges, and Opportunity

12.1 Market drivers

Proliferation of automation and autonomous systems across key industries
Pervasive industrial digitalization and demand for high fidelity geospatial data
Continuous modernization of GNSS infrastructure and augmentation services

12.2 Market challenges

High total cost of ownership and complex system integration
Inherent vulnerability to signal disruption and environmental constraints
Navigating complex regulatory landscape and addressing data security risks

12.3 Impact of drivers and challenges

Impact of drivers and challenges in 2024 and 2029

12.4 Market opportunities

Convergence of GNSS with sensor fusion for robust positioning
Shift towards positioning as service and cloud based platforms
Miniaturization, cost reduction, and democratization of high precision

13. Competitive Landscape

13.1 Overview

13.2

Overview on criticality of inputs and factors of differentiation

13.3 Landscape disruption

Overview on factors of disruption

13.4 Industry risks

Impact of key risks on business

14. Competitive Analysis

14.1 Companies profiled

Companies covered

14.2 Company ranking index

14.3 Market positioning of companies

Matrix on companies position and classification

14.4 AAA Taranis Visual Ltd.

AAA Taranis Visual Ltd. - Overview
AAA Taranis Visual Ltd. - Product / Service
AAA Taranis Visual Ltd. - Key offerings
SWOT

14.5 Ag Leader Technology

Ag Leader Technology - Overview
Ag Leader Technology - Product / Service
Ag Leader Technology - Key offerings
SWOT

14.6 AGCO Corp.

AGCO Corp. - Overview
AGCO Corp. - Business segments
AGCO Corp. - Key news
AGCO Corp. - Key offerings
AGCO Corp. - Segment focus
SWOT

14.7 AgEagle Aerial Systems

AgEagle Aerial Systems - Overview
AgEagle Aerial Systems - Product / Service
AgEagle Aerial Systems - Key offerings
SWOT

14.8 Bayer AG

Bayer AG - Overview
Bayer AG - Business segments
Bayer AG - Key news
Bayer AG - Key offerings
Bayer AG - Segment focus
SWOT

14.9 CropX Technologies Ltd.

CropX Technologies Ltd. - Overview
CropX Technologies Ltd. - Product / Service
CropX Technologies Ltd. - Key offerings
SWOT

14.10 Deere and Co.

Deere and Co. - Overview
Deere and Co. - Business segments
Deere and Co. - Key news
Deere and Co. - Key offerings
Deere and Co. - Segment focus
SWOT

14.11 GEA Group AG

GEA Group AG - Overview
GEA Group AG - Business segments
GEA Group AG - Key offerings
GEA Group AG - Segment focus
SWOT

14.12 Madison One Holdings LLC

Madison One Holdings LLC - Overview
Madison One Holdings LLC - Product / Service
Madison One Holdings LLC - Key offerings
SWOT

14.13 Precision Planting

Precision Planting - Overview
Precision Planting - Product / Service
Precision Planting - Key offerings
SWOT

14.14 Raven Industries Inc.

Raven Industries Inc. - Overview
Raven Industries Inc. - Product / Service
Raven Industries Inc. - Key offerings
SWOT

14.15 Tetra Laval SA

Tetra Laval SA - Overview
Tetra Laval SA - Product / Service
Tetra Laval SA - Key news
Tetra Laval SA - Key offerings
SWOT

14.16 Topcon Positioning Systems Inc.

Topcon Positioning Systems Inc. - Overview
Topcon Positioning Systems Inc. - Product / Service
Topcon Positioning Systems Inc. - Key offerings
SWOT

14.17 Trimble Inc.

Trimble Inc. - Overview
Trimble Inc. - Business segments
Trimble Inc. - Key news
Trimble Inc. - Key offerings
Trimble Inc. - Segment focus
SWOT

14.18 Valmont Industries Inc.

Valmont Industries Inc. - Overview
Valmont Industries Inc. - Business segments
Valmont Industries Inc. - Key offerings
Valmont Industries Inc. - Segment focus
SWOT

15. Appendix

15.1 Scope of the report

Market definition
Objectives
Notes and caveats

15.2 Inclusions and exclusions checklist

Inclusions checklist
Exclusions checklist

15.3 Currency conversion rates for US$

15.4 Research methodology

15.5 Data procurement

Information sources

15.6 Data validation

15.7 Validation techniques employed for market sizing

15.8 Data synthesis

15.9 360 degree market analysis

15.10 List of abbreviations

Research Methodology

Technavio presents a detailed picture of the market by way of study, synthesis, and summation of data from multiple sources. The analysts have presented the various facets of the market with a particular focus on identifying the key industry influencers. The data thus presented is comprehensive, reliable, and the result of extensive research, both primary and secondary.

INFORMATION SOURCES

Primary sources

  • Manufacturers and suppliers
  • Channel partners
  • Industry experts
  • Strategic decision makers

Secondary sources

  • Industry journals and periodicals
  • Government data
  • Financial reports of key industry players
  • Historical data
  • Press releases

DATA ANALYSIS

Data Synthesis

  • Collation of data
  • Estimation of key figures
  • Analysis of derived insights

Data Validation

  • Triangulation with data models
  • Reference against proprietary databases
  • Corroboration with industry experts

REPORT WRITING

Qualitative

  • Market drivers
  • Market challenges
  • Market trends
  • Five forces analysis

Quantitative

  • Market size and forecast
  • Market segmentation
  • Geographical insights
  • Competitive landscape

Interested in this report?

Get your sample now to see our research methodology and insights!

Download Now

Frequently Asked Questions

Mid-high Level Precision GPS market growth will increase by USD 3201.7 million during 2025-2029.

The Mid-high Level Precision GPS market is expected to grow at a CAGR of 15.5% during 2025-2029.

Mid-high Level Precision GPS market is segmented by Frequency range (Single frequency, Dual frequency) Type (Differential grade, Survey grade) End-user (Agriculture, Construction, Oil and gas, Others)

AAA Taranis Visual Ltd., Ag Leader Technology, AGCO Corp., AgEagle Aerial Systems, Bayer AG, CropMetrics LLC, CropX Technologies Ltd., Deere and Co., Digital Agri Solutions, Farmers Edge Inc., GEA Group AG, Madison One Holdings LLC, Precision Planting, Raven Industries Inc., Tetra Laval SA, Topcon Positioning Systems Inc., Trimble Inc., Valmont Industries Inc. are a few of the key vendors in the Mid-high Level Precision GPS market.

North America will register the highest growth rate of 36.3% among the other regions. Therefore, the Mid-high Level Precision GPS market in North America is expected to garner significant business opportunities for the vendors during the forecast period.

US, Canada, Mexico, Germany, UK, France, Italy, Spain, The Netherlands, China, Japan, India, South Korea, Australia, Indonesia, Saudi Arabia, UAE, South Africa, Turkey, Israel, Brazil, Argentina, Colombia

  • Proliferation of automation and autonomous systems across key industries is the driving factor this market.

The Mid-high Level Precision GPS market vendors should focus on grabbing business opportunities from the Frequency range segment as it accounted for the largest market share in the base year.