Military Camouflage Uniform Market Size 2025-2029
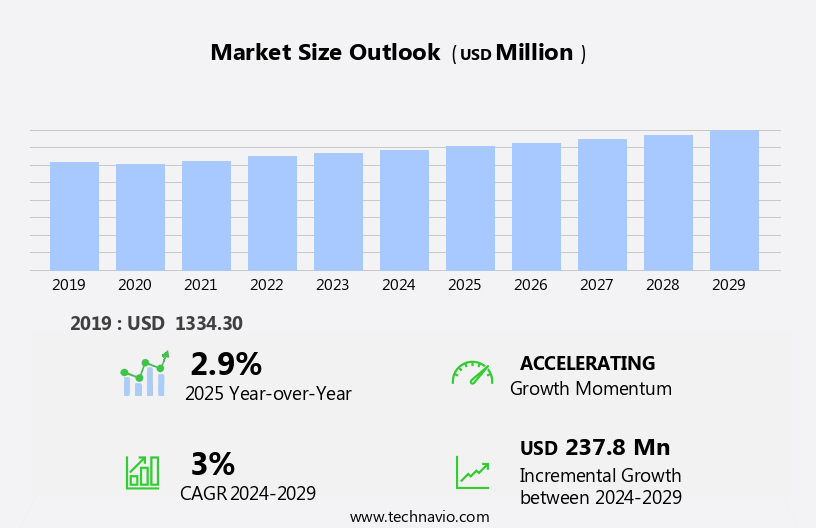
The military camouflage uniform market size is forecast to increase by USD 237.8 million, at a CAGR of 3% between 2024 and 2029.
- The market is experiencing significant shifts, driven by the increasing importance of weather and terrain-specific uniforms. This trend underscores the need for advanced camouflage technologies that effectively conceal soldiers in diverse environments. The fibers in military combat uniforms offer technical advantages, such as stiffening upon shrapnel impact, providing an initial layer of protection in body armor. Military uniform performance and combat clothing technology remain key priorities for tactical apparel manufacturers. Another key driver is the evolution of military camouflage uniforms towards smart technology integration. These next-generation uniforms offer enhanced functionality, such as temperature regulation and protective features, providing soldiers with a competitive edge on the battlefield. However, failure to adapt to these advancements can lead to high costs for military organizations.
- As competitors invest in cutting-edge camouflage solutions, those who lag behind may find themselves at a disadvantage. To remain competitive, companies must stay abreast of technological developments and invest in research and development to create innovative, effective, and cost-efficient camouflage uniforms. This strategic approach will enable them to cater to the evolving needs of military clients and capitalize on the growing demand for advanced uniforms.
What will be the Size of the Military Camouflage Uniform Market during the forecast period?
Explore in-depth regional segment analysis with market size data - historical 2019-2023 and forecasts 2025-2029 - in the full report.
Request Free Sample
The market continues to evolve, driven by the dynamic nature of military operations and advancements in technology. Tactical uniforms integrate body armor, ensuring soldier comfort and protection. Retail channels and defense procurement entities collaborate to deliver uniforms that meet military specifications, including seam sealing, night vision compatibility, and digital camouflage. Garment construction employs various fabrics, such as nylon and cotton, with ballistic protection and moisture wicking properties. Uniform design incorporates digital printing and insignia placement for operational effectiveness. Sustainability initiatives and ethical sourcing are becoming increasingly important, with recycled materials and supply chain optimization gaining traction. Uniform construction also addresses environmental factors, with flame resistance, water resistance, and temperature regulation ensuring soldier readiness.
Testing standards ensure uniforms meet rigorous military requirements, while customization options cater to individual soldier needs. Fabric technology advances continue to impact the market, with ripstop nylon, pixel camouflage, and UV resistance enhancing uniform functionality. Manufacturing processes prioritize quality control and adhere to international trade regulations. In the realm of protective clothing, work uniforms and ghillie suits also incorporate similar technologies for operational effectiveness and environmental adaptability. The market's continuous dynamism underscores the importance of adaptability and innovation in addressing the evolving needs of military personnel.
How is this Military Camouflage Uniform Industry segmented?
The military camouflage uniform industry research report provides comprehensive data (region-wise segment analysis), with forecasts and estimates in "USD million" for the period 2025-2029, as well as historical data from 2019-2023 for the following segments.
- Type
- Combat
- Operational
- Application
- Army
- Air force
- Navy
- Technology
- Traditional camouflage
- Digital camouflage
- Adaptive camouflage
- Material
- Polyester
- Nylon
- Cotton
- Blends
- Variant
- Woodland
- Desert
- Urban
- Snow
- Geography
- North America
- US
- Canada
- Europe
- France
- Germany
- UK
- APAC
- China
- India
- Japan
- South Korea
- Rest of World (ROW)
- North America
By Type Insights
The combat segment is estimated to witness significant growth during the forecast period.
The combat segment of the military uniform market encompasses specialized camouflage uniforms, designed with advanced textiles that enable soldiers to blend seamlessly with their environment, enhancing their tactical advantage. These uniforms incorporate body armor integration for enhanced protection, while soldier comfort is prioritized through moisture wicking and breathability. Defense procurement agencies procure these uniforms adhering to military specifications, ensuring night vision compatibility and testing standards. Nylon and ripstop fabrics, with their durability and lightweight properties, dominate the uniform construction. Digital camouflage patterns, achieved through dye sublimation or digital printing, cater to various terrains. Uniform design includes insignia placement, ensuring uniformity and customization options.
Supply chain management plays a crucial role in the timely delivery of these uniforms, with distribution networks optimized for international trade. Sustainability initiatives, such as the use of recycled materials, are gaining traction. Fabric technology advances include flame resistance, chemical resistance, and UV resistance, ensuring operational effectiveness in diverse conditions. Manufacturing processes prioritize quality control, with ethical sourcing and adherence to labor standards. Uniforms are designed with temperature regulation, water resistance, and infrared reflectivity for optimal performance in extreme environments. Pattern design considers environmental factors, such as wind resistance and abrasion resistance, to ensure durability. In the realm of protective clothing, work uniforms and ghillie suits are integral to the military uniform market.
Body armor integration, ballistic protection, and customization options cater to the unique needs of various military roles. Combat uniforms are engineered with the latest manufacturing processes, ensuring the highest standards of performance and reliability.
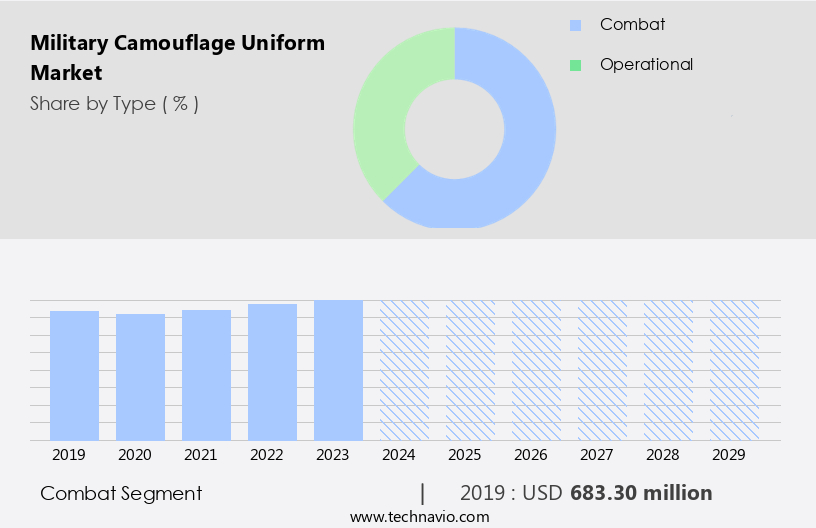
The Combat segment was valued at USD 683.30 million in 2019 and showed a gradual increase during the forecast period.
Regional Analysis
North America is estimated to contribute 34% to the growth of the global market during the forecast period. Technavio's analysts have elaborately explained the regional trends and drivers that shape the market during the forecast period.
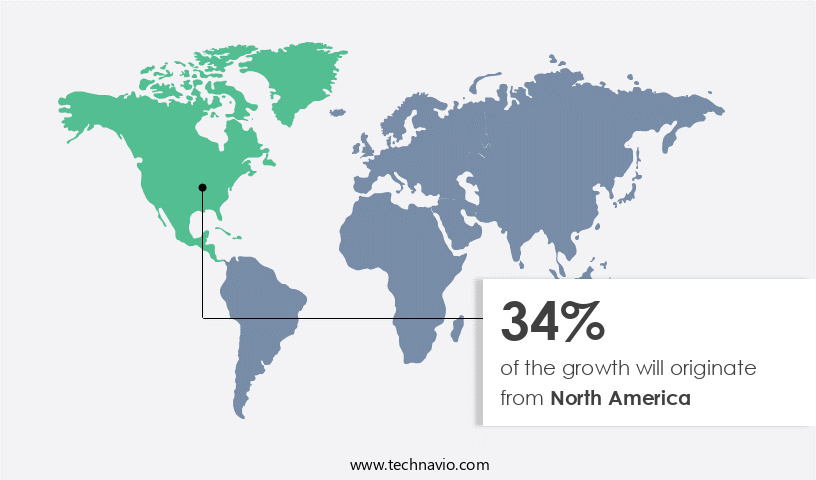
The market in the US has seen significant advancements, with the Army adopting various camouflage patterns and investing heavily in their design and development. Over ten distinct camouflage patterns have been implemented, and hundreds of millions of dollars have been allocated for their creation. The US Department of Defense (DoD) is currently focusing on the development of high-tech fibers and textiles for military uniforms. These advanced fabrics can potentially integrate circuits, solar cells, LEDs, and other capabilities, creating a fabric that can regulate temperature, power equipment, and detect environmental hazards such as radioactive elements or chemical substances.
The uniforms made from these fabrics could offer enhanced operational effectiveness, including temperature regulation, power supply, and hazard warnings. Additionally, the market trends include the use of sustainable initiatives, such as recycled materials, and adherence to military specifications and government contracts. The focus on soldier comfort, night vision compatibility, and testing standards continues to be crucial. The supply chain management and optimization, along with ethical sourcing and customization options, further enhance the tactical advantage of these uniforms. The integration of body armor and digital camouflage, along with moisture wicking and water resistance, ensures the uniforms cater to various environmental factors.
The use of ripstop nylon, cotton fabrics, ballistic protection, and digital printing further enhances the uniform's durability and design. The market continues to evolve, with a focus on fabric technology, biological resistance, and UV resistance, among other factors.
Market Dynamics
Our researchers analyzed the data with 2024 as the base year, along with the key drivers, trends, and challenges. A holistic analysis of drivers will help companies refine their marketing strategies to gain a competitive advantage.
The market caters to the demand for protective clothing designed to blend soldiers into their surroundings, enhancing their stealth and survival in various terrain. This niche market encompasses advanced fabric technologies, camouflage patterns, and ergonomic designs. Key players innovate in areas such as moisture-wicking materials, thermal insulation, and ballistic protection. Camouflage patterns include digital, woodland, desert, and urban designs, catering to diverse environments. Customization options, such as name tapes and rank insignia, add functionality and personalization. The market is driven by ongoing military modernization efforts, evolving battlefield conditions, and advancements in textile technology. Sustainability and durability are crucial factors, with eco-friendly materials and extended lifespan features gaining importance. Ultimately, military camouflage uniforms serve a vital role in ensuring the safety and effectiveness of military personnel in the field.
What are the key market drivers leading to the rise in the adoption of Military Camouflage Uniform Industry?
- The market's growth is primarily attributed to the heightened importance of weather and topography-specific uniforms in various industries. These uniforms cater to specific work environments, ensuring employee comfort and productivity while enhancing safety and professionalism.
- The market has seen notable advancements in design and fabrication, aligning with the dynamic nature of modern battlefields. Despite attempts to establish a unified camouflage pattern for various military branches, the success has been limited due to the distinct terrain requirements for each. As a result, militaries worldwide are focusing on producing specialized camouflage uniforms tailored to specific topographical conditions. For instance, the US Army introduced the Scorpion W2 operational camouflage uniform for soldiers operating in Afghanistan, Europe, Iraq, and the Horn of Africa. The uniform is engineered with high-quality polyester fabrics, ensuring abrasion resistance and durability.
- Additionally, these uniforms incorporate recycled materials, contributing to sustainability efforts. In terms of performance, military camouflage uniforms are engineered with advanced features such as chemical resistance, UV resistance, and infrared signature reduction. Pixel camouflage patterns are increasingly popular due to their ability to blend seamlessly with various environments. Manufacturing processes have evolved to ensure quality control, with a focus on immersive, harmonious designs that strike a balance between functionality and comfort. Camouflage uniforms are subjected to rigorous testing and regulatory compliance, including import regulations, to ensure they meet the highest standards. These uniforms are essential for combat readiness and the safety of military personnel, making them a vital investment for defense forces worldwide.
What are the market trends shaping the Military Camouflage Uniform Industry?
- The evolution of military uniforms incorporating smart camouflage technology is a notable market trend. Advanced military uniforms, equipped with this technology, are gaining increasing attention and demand.
- The market is witnessing significant advancements, particularly in the integration of technology into uniforms. These advanced uniforms include sensors, actuators, and control units that interact with the environment and react to physical stimuli from various sources. This innovation reduces the need for multiple batteries and decreases the likelihood of gadget failure by up to 50%. Traditional military uniforms often require soldiers to carry numerous devices, each with individual battery backups. Seam sealing and garment construction have been crucial aspects of military uniform manufacturing. Retail channels have adopted dye sublimation and screen printing techniques for customization.
- Nylon fabrics have become popular due to their durability and biological resistance. Supply chain management plays a vital role in ensuring the timely delivery of tactical uniforms and body armor to defense procurement agencies. Military camouflage uniforms must meet rigorous testing standards for night vision compatibility and tactical advantage. Integration of technology and focus on soldier comfort have been key market drivers. Smart uniforms with night vision compatibility and seamless body armor integration offer a tactical advantage in various military operations. In summary, the market is characterized by technological advancements, focus on soldier comfort, and stringent testing standards.
- The integration of sensors, actuators, and control units into uniforms has led to the development of smart uniforms, reducing the need for multiple batteries and enhancing overall performance.
What challenges does the Military Camouflage Uniform Industry face during its growth?
- The industry's inability to adapt results in significant costs, posing a significant challenge to its growth.
- The market faces significant challenges in ensuring operational effectiveness through the adoption of suitable textiles and designs. The development process for these uniforms is lengthy and costly, taking 3-5 years and involving substantial investments in research and development. Failures in the implementation of specific fabrics and patterns can result in substantial financial and temporal losses. For instance, the US Army's investment of nearly USD5 billion in the Universal Camouflage Pattern Uniforms (UCP) serves as a notable example. To address these challenges, uniform designers focus on incorporating advanced features such as ballistic protection, digital camouflage, and sustainability initiatives.
- The use of cotton fabrics and ripstop nylon, along with military specifications and government contracts, ensures the production of high-quality protective clothing. Digital printing techniques enable the creation of intricate camouflage patterns, enhancing operational effectiveness. Additionally, flame resistance and insignia placement are crucial considerations to ensure the uniforms' functionality and durability. In the context of international trade, the market benefits from the exchange of knowledge and resources among various countries. This collaboration leads to the development of innovative designs and technologies that cater to the evolving needs of military forces worldwide. Overall, the market's dynamics are shaped by the continuous pursuit of operational effectiveness, technological advancements, and the demands of various military organizations.
Exclusive Customer Landscape
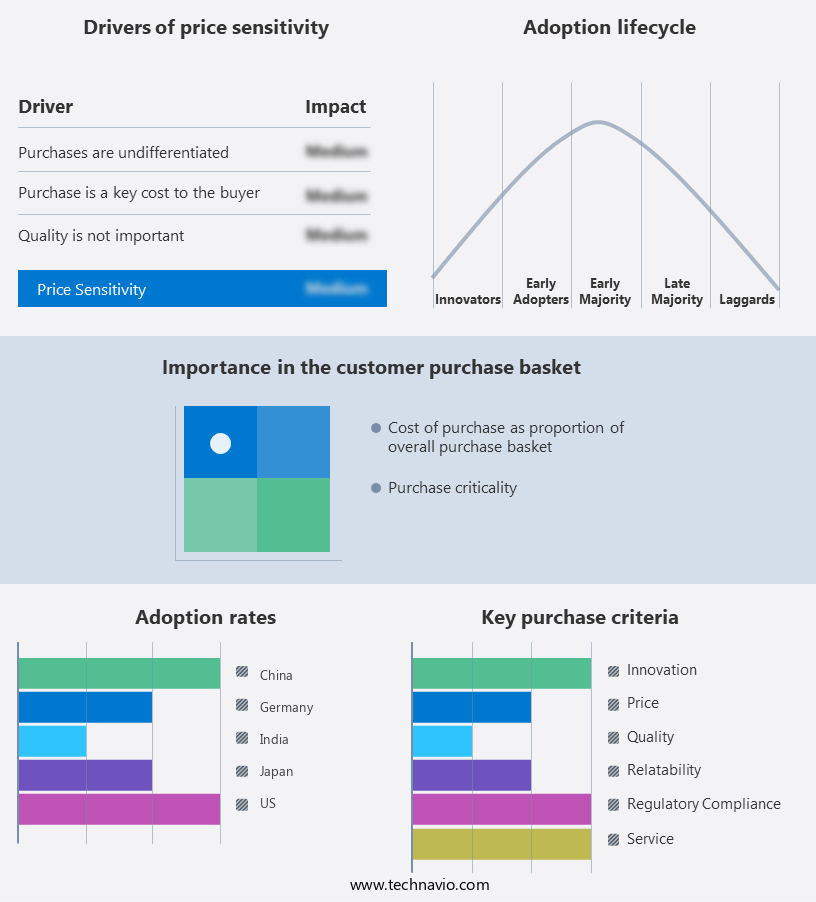
The military camouflage uniform market forecasting report includes the adoption lifecycle of the market, covering from the innovator's stage to the laggard's stage. It focuses on adoption rates in different regions based on penetration. Furthermore, the military camouflage uniform market report also includes key purchase criteria and drivers of price sensitivity to help companies evaluate and develop their market growth analysis strategies.
Customer Landscape
Key Companies & Market Insights
Companies are implementing various strategies, such as strategic alliances, military camouflage uniform market forecast, partnerships, mergers and acquisitions, geographical expansion, and product/service launches, to enhance their presence in the industry.
American Apparel Inc. - This company specializes in providing military camouflage uniforms for various branches of the armed forces, including the Air Force, Army, Navy, Marines, and Coast Guard.
The industry research and growth report includes detailed analyses of the competitive landscape of the market and information about key companies, including:
- American Apparel Inc.
- Cortman Textiles Ltd.
- Crye Precision LLC
- DuPont de Nemours Inc.
- Guangzhou Junyiku Industrial Co. Ltd.
- HyperStealth Biotechnology Corp.
- IBENA Textilwerke GmbH
- Kel Lac Uniforms Inc.
- Koch Industries Inc.
- Milliken and Co.
- National Safety Apparel Inc.
- Raff Military Textile
- Rothco
- TenCate Fabrics EU
- Woven Fabric Co.
Qualitative and quantitative analysis of companies has been conducted to help clients understand the wider business environment as well as the strengths and weaknesses of key industry players. Data is qualitatively analyzed to categorize companies as pure play, category-focused, industry-focused, and diversified; it is quantitatively analyzed to categorize companies as dominant, leading, strong, tentative, and weak.
Recent Development and News in Military Camouflage Uniform Market
- In January 2024, the United States Army announced a contract worth USD1.1 billion with Crye Precision to provide Enhanced Fractal Pattern (EFTP) camouflage uniforms for its soldiers (U.S. Army press release). This contract marked a significant shift towards advanced camouflage technology, aiming to enhance military stealth and effectiveness.
- In March 2024, British multinational defense, security, and services company, BAE Systems, and American textile company, Milliken & Company, joined forces to develop advanced camouflage textiles for military uniforms (BAE Systems press release). This strategic partnership combined BAE Systems' military expertise with Milliken's textile innovation, aiming to create superior camouflage solutions.
- In May 2024, Israeli defense technology company, Rafael Advanced Defense Systems, showcased its new Adir camouflage system at the Eurosatory defense exhibition in Paris (Defense News). Adir uses artificial intelligence and machine learning algorithms to adapt to various environments, providing soldiers with real-time camouflage solutions.
- In April 2025, the European Union approved a â¬2.5 billion (USD 2.7 billion) fund to support the development and production of advanced military equipment, including camouflage uniforms, as part of its European Defence Fund (European Commission press release). This significant investment demonstrated the EU's commitment to enhancing its military capabilities and modernizing its armed forces.
Research Analyst Overview
- The market is characterized by a focus on advanced materials and innovative design to enhance soldier performance. Fabric breathability rating and moisture transport properties are crucial considerations for ensuring comfort in various climates. Product lifecycle management and circular economy practices are gaining importance to reduce waste and minimize carbon footprint. Reinforcement stitching, tensile strength, and velcro adhesion ensure uniform durability. Advanced materials include stretch properties, insect repellent treatments, and smart textiles. Demand forecasting and uniform fit are essential for meeting the needs of military forces. Militaries seek uniforms made of military-grade materials, with specialized uniforms and modular designs catering to specific roles.
- Quality assurance measures include garment labeling, dye fastness, anti-odor treatments, and flame-retardant treatments. Innovation in camouflage continues with waterproofing techniques, print resolution, and wearable technology. Uniform accessories, pocket design, button types, color matching, and zipper durability are also key factors. Stitching techniques, waste reduction, and anti-microbial treatments further contribute to the market's growth. Inventory management and production planning are crucial aspects of supplying uniforms to military forces.
Dive into Technavio's robust research methodology, blending expert interviews, extensive data synthesis, and validated models for unparalleled Military Camouflage Uniform Market insights. See full methodology.
|
Market Scope |
|
|
Report Coverage |
Details |
|
Page number |
255 |
|
Base year |
2024 |
|
Historic period |
2019-2023 |
|
Forecast period |
2025-2029 |
|
Growth momentum & CAGR |
Accelerate at a CAGR of 3% |
|
Market growth 2025-2029 |
USD 237.8 million |
|
Market structure |
Fragmented |
|
YoY growth 2024-2025(%) |
2.9 |
|
Key countries |
US, China, Germany, Canada, Japan, India, UK, France, South Korea, and Saudi Arabia |
|
Competitive landscape |
Leading Companies, Market Positioning of Companies, Competitive Strategies, and Industry Risks |
What are the Key Data Covered in this Military Camouflage Uniform Market Research and Growth Report?
- CAGR of the Military Camouflage Uniform industry during the forecast period
- Detailed information on factors that will drive the growth and forecasting between 2025 and 2029
- Precise estimation of the size of the market and its contribution of the industry in focus to the parent market
- Accurate predictions about upcoming growth and trends and changes in consumer behaviour
- Growth of the market across North America, APAC, Europe, Middle East and Africa, and South America
- Thorough analysis of the market's competitive landscape and detailed information about companies
- Comprehensive analysis of factors that will challenge the military camouflage uniform market growth of industry companies
We can help! Our analysts can customize this military camouflage uniform market research report to meet your requirements.
 RIA -
RIA - 
