Military Simulation and Virtual Training Market Size 2024-2028
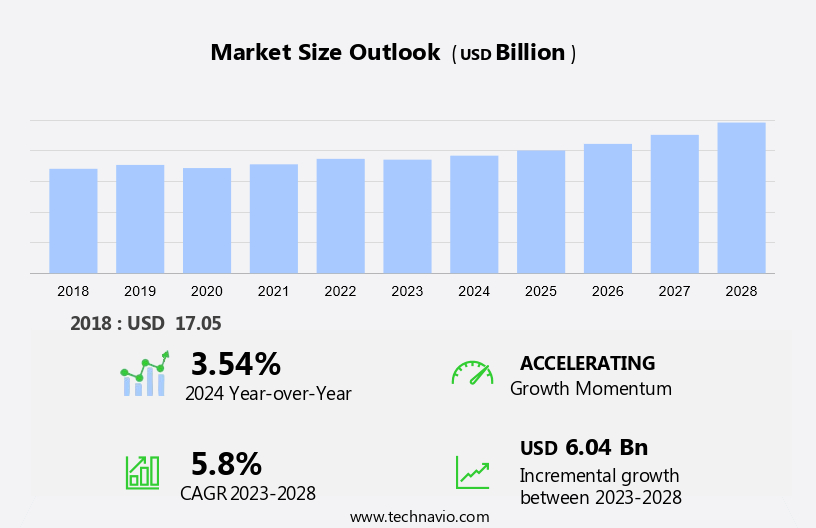
The military simulation and virtual training market size is forecast to increase by USD 6.04 billion at a CAGR of 5.8% between 2023 and 2028. The market is witnessing significant growth due to the cost-effectiveness of virtual training and the increased emphasis on portable simulators and head-mounted virtual reality (VR) systems. These systems enable soldiers to train in realistic environments without the need for expensive physical assets, reducing overall training costs. Moreover, portable simulation systems, such as vehicle and flight simulators for tanks and aircraft like the F-35 and J-15, offer the advantage of being easily transportable for field training. However, the high cost of simulation training remains a challenge for market growth, as it requires significant investment in hardware and software. Despite this, the benefits of virtual training, including improved training efficiency and safety, are driving the market forward.
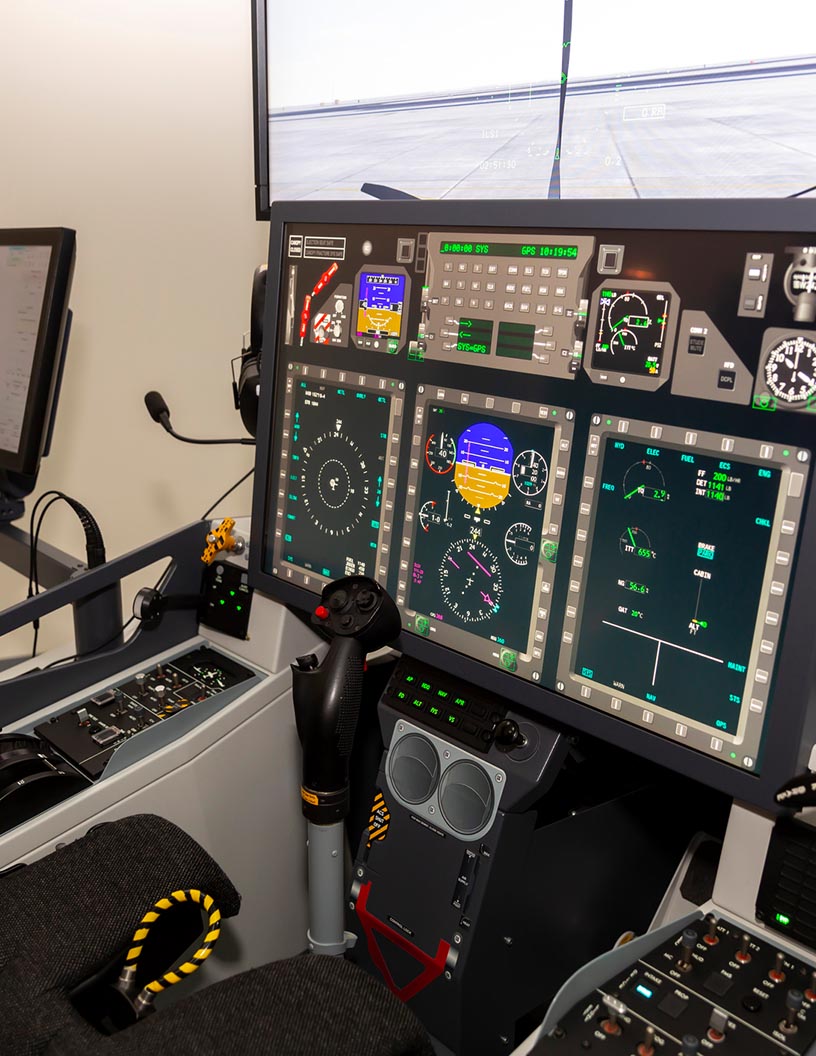
Military simulation and virtual training have gained significant importance in the defense sector due to their ability to provide realistic and effective training experiences. These simulations utilize technologies such as virtual reality (VR) and mixed reality (MR) to create environments for air combat training, pilot training programs, maritime security, and vehicle simulation. The market for military simulation is expanding rapidly, driven by the demand for advanced hardware and software solutions. Air combat simulators, UAV and drone simulators, and F-35 aircraft simulators are some of the key types of military simulation technologies. Virtual scenarios are designed to replicate real-world conditions, enabling skilled experts to train for various missions and combat situations.
VR and MR technologies enable the creation of realistic battlefield simulations, including tank battles and naval warfare. Battlefield simulation software provides a platform for training in various military scenarios, allowing for effective planning and execution of military strategies. Hardware and software solutions for military simulation include flight simulation systems, VR headsets, and haptic feedback devices. The VRLT programme and VRAI are two notable initiatives focused on advancing military simulation and virtual training technologies. The military is increasingly investing in these technologies to enhance the capabilities of its forces and improve operational readiness.
Market Segmentation
The market research report provides comprehensive data (region-wise segment analysis), with forecasts and estimates in "USD billion" for the period 2024-2028, as well as historical data from 2018-2022 for the following segments.
- Product
- Flight simulators
- Maritime simulators
- Combat simulators
- Environment
- Synthetic
- Gaming
- Geography
- North America
- US
- APAC
- China
- Europe
- Germany
- UK
- Middle East and Africa
- South America
- North America
By Product Insights
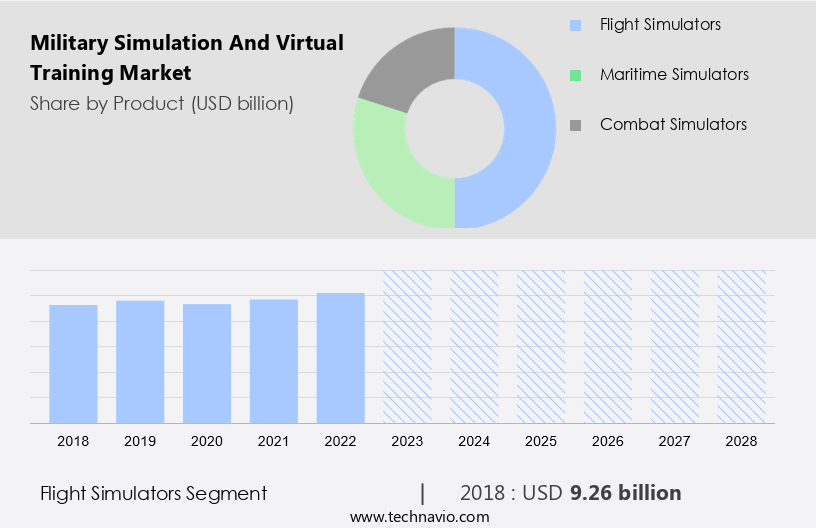
The flight simulators segment is estimated to witness significant growth during the forecast period. The market encompasses portable simulation systems, vehicle simulation, and battlefield simulation. Among these segments, the flight simulators sector is projected to experience significant expansion during the forecast period. The primary drivers of this growth include the escalating demand for synthetic training environments and the increasing focus on virtual training camps. Flight simulators can be classified into two categories: full-flight simulators (FFS) and flight simulation training devices (FSTD). In FFS, pilots train on a replica of a specific aircraft model, while in FSTD, soldiers learn on simulated flight controls and other devices. Defense organizations worldwide are increasingly adopting flight simulators for pilot training, with applications ranging from F-35 aircraft simulators to J-15 flight simulators.
Get a glance at the market share of various segments Request Free Sample
The flight simulators segment was valued at USD 9.26 billion in 2018 and showed a gradual increase during the forecast period.
Regional Insights
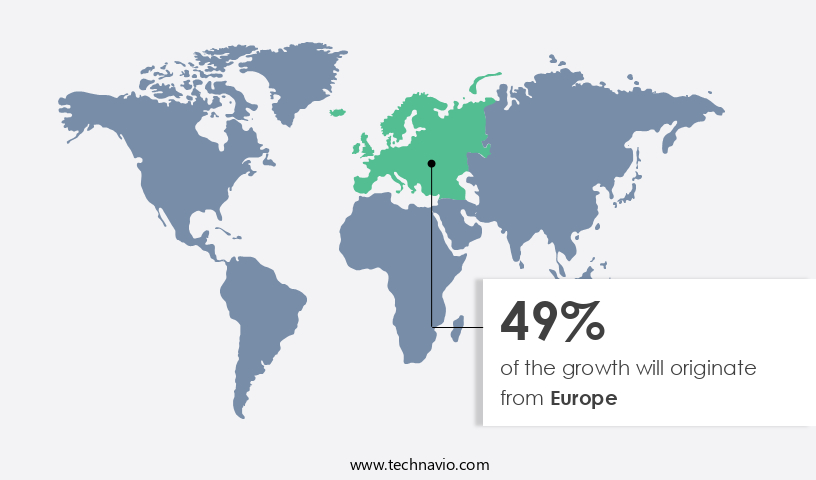
Europe is estimated to contribute 49% to the growth of the global market during the forecast period. Technavio's analysts have elaborately explained the regional trends and drivers that shape the market during the forecast period.
For more insights on the market share of various regions Request Free Sample
The market in North America is experiencing significant growth due to escalating defense ministry investments in military training. The United States and Canada lead the market in this region. The US Department of Defense (DOD) is actively collaborating with training and simulation companies to meet the increasing demand for military simulation and virtual training. companies are prioritizing inorganic growth strategies, such as mergers and acquisitions, to expand their presence in the market. For instance, in March 2021, CAE Inc. Acquired L3Harris' military training business to bolster its offerings for US programs. Portable simulation systems, including vehicle simulation and flight simulation, are gaining popularity due to their flexibility and ease of use. Military simulation covers battlefield simulations, while virtual training encompasses F-35 aircraft simulators and J-15 flight simulators, among others. These systems enable military personnel to train in various scenarios, enhancing their readiness and effectiveness.
Our researchers analyzed the data with 2023 as the base year, along with the key drivers, trends, and challenges. A holistic analysis of drivers will help companies refine their marketing strategies to gain a competitive advantage.
Market Driver
The cost-effectiveness of virtual training is the key driver of the market. The market is experiencing significant growth due to the cost-effectiveness and risk mitigation benefits of virtual training over real-time training. In real-time training, defense agencies incur additional expenses on fuel for military platforms, procurement of training ammunition, and operational costs. Virtual training, on the other hand, utilizes advanced technologies such as Air combat simulators, UAV, and Drone simulators, offered by industry leaders like VRAI, VRLT Programme, Navy, and others, to provide realistic training experiences at a fraction of the cost. Furthermore, virtual training minimizes risks to personnel and equipment, making it an attractive alternative for defense and law enforcement agencies. Moreover, the increasing defense and law enforcement budgets have accelerated the demand for innovative simulation training systems, as military forces and police seek to enhance their capabilities through technology-driven training solutions.
Market Trends
Increased emphasis on portable simulators and head-worn VR systems is the upcoming trend in the market. Military simulation and virtual training have gained significant importance in the defense sector due to the increasing need for skilled experts in various military operations. One of the key areas of focus in this market is the development of advanced simulators for air combat and Unmanned Aerial Vehicles (UAVs). companies such as United Technologies Corp. And Meggitt PLC are at the forefront of providing innovative solutions in this domain. Meggitt Training Systems, a subsidiary of Meggitt PLC, offers the FATS 100P virtual training system. This portable simulator is a cost-effective alternative to real-time training exercises, as it can be easily transported to multiple training sites.
Moreover, the FATS 100P system offers a dynamic training experience through high-definition video scenarios, enabling militaries to provide judgmental training to soldiers. The system assesses the user's reaction to verbal cues, facial expressions, and overall body language to produce a realistic conversation with individuals. Another trend in the market is the development of Virtual Reality Advanced Individual Training (VRAI) and Virtual Reality Live Training (VRLT) Programmes. These programs offer training experiences, allowing soldiers to engage in realistic simulations of various military scenarios. These advanced training methods are essential for preparing military personnel for complex missions and ensuring their readiness for real-world situations.
Further, in conclusion, the market is witnessing significant growth due to the increasing demand for advanced training solutions. Portable simulators, UAV drone simulators, and VR-based training programs are some of the key areas of focus in this market. companies such as United Technologies Corp., Meggitt PLC, and others are leading the way in providing innovative solutions to meet the evolving needs of the defense sector.
Market Challenge
The high cost of simulation training is a key challenge affecting the market growth. The market witnessed significant growth due to the increasing investments by defense ministries in advanced training programs. Skilled experts are in high demand to develop air combat simulators, UAV, and drone simulators using Virtual Reality Advanced Imaging (VRAI) and Virtual Reality Live Training (VRLT) Programme. However, the high cost of military simulation training products and software remains a challenge. Although the cost is justifiable due to the innovative and advanced nature of these simulations, the operating costs associated with simulators, including installation of software, infrastructure, and trained personnel, add to the overall expense. Furthermore, the need for allocated space increases the cost of implementing simulations. However, despite these costs, the market is expected to grow due to the significant cost reduction in simulations and virtual training modules.
Exclusive Customer Landscape
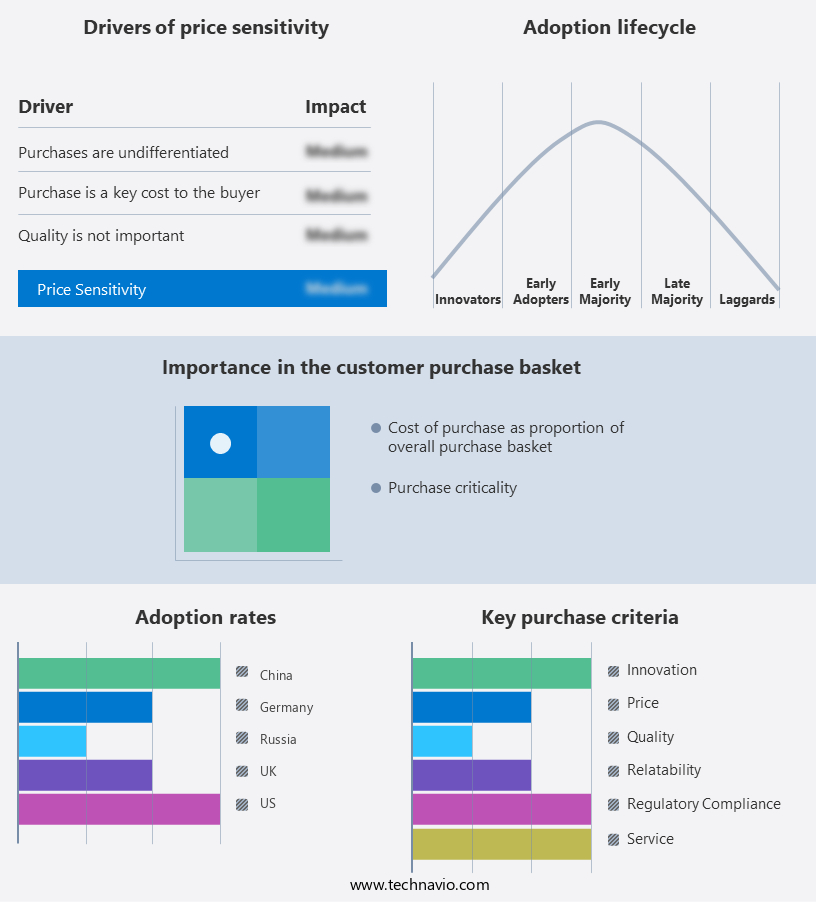
The market forecasting report includes the adoption lifecycle of the market, covering from the innovator's stage to the laggard's stage. It focuses on adoption rates in different regions based on penetration. Furthermore, the report also includes key purchase criteria and drivers of price sensitivity to help companies evaluate and develop their market growth analysis strategies.
Customer Landscape
Key Companies & Market Insights
Companies are implementing various strategies, such as strategic alliances, partnerships, mergers and acquisitions, geographical expansion, and product/service launches, to enhance their presence in the market.
The market research and growth report includes detailed analyses of the competitive landscape of the market and information about key companies, including:
- BAE Systems Plc
- Bohemia Interactive Simulations ks
- CAE Inc.
- Cubic Corp.
- Fidelity Technologies Corp.
- Groupe Gorge
- HAVELSAN Inc.
- Inveris Training Solutions
- Kratos Defense and Security Solutions Inc.
- L3Harris Technologies Inc.
- Lockheed Martin Corp.
- Northrop Grumman Corp.
- Parker Hannifin Corp.
- Raytheon Technologies Corp.
- Rheinmetall AG
- Saab AB
- Teledyne Technologies Inc.
- Textron Inc.
- Thales Group
- The Boeing Co.
Qualitative and quantitative analysis of companies has been conducted to help clients understand the wider business environment as well as the strengths and weaknesses of key market players. Data is qualitatively analyzed to categorize companies as pure play, category-focused, industry-focused, and diversified; it is quantitatively analyzed to categorize companies as dominant, leading, strong, tentative, and weak.
Research Analyst Overview
Military simulation and virtual training have become essential components of modern military preparedness, with virtual reality (VR), augmented reality (AR), and mixed reality (MR) technologies playing a pivotal role. Simulators for air combat training, virtual scenarios, and hardware-software combinations are transforming pilot training programs in aviation and maritime security. VR, AR, and MR technologies enable the creation of realistic and training environments, allowing military personnel to experience various scenarios without the risks associated with real-world training. Hardware and software advancements continue to drive the military simulation market, with technological developments in VR, AR, and MR enabling more realistic and effective training.
Moreover, cybersecurity concerns are a significant challenge, as digital battlefield products become increasingly sophisticated. Training requirements for various military fleets, including fighter jets, UAVs, drones, tanks, and naval vessels, are driving the demand for simulators. Skilled experts in artificial intelligence, machine learning, and multi-domain modeling are essential for developing advanced simulation systems. Geopolitical tensions and the need for unmanned systems, such as UAVs and drones, are also fueling the growth of the military simulation market. Portable simulation systems and vehicle simulation are other areas of focus, with flight simulation and battlefield simulation remaining key applications.
|
Market Scope |
|
|
Report Coverage |
Details |
|
Page number |
173 |
|
Base year |
2023 |
|
Historic period |
2018-2022 |
|
Forecast period |
2024-2028 |
|
Growth momentum & CAGR |
Accelerate at a CAGR of 5.8% |
|
Market growth 2024-2028 |
USD 6.04 billion |
|
Market structure |
Fragmented |
|
YoY growth 2023-2024(%) |
3.54 |
|
Regional analysis |
North America, APAC, Europe, Middle East and Africa, and South America |
|
Performing market contribution |
Europe at 49% |
|
Key countries |
US, China, Russia, UK, and Germany |
|
Competitive landscape |
Leading Companies, Market Positioning of Companies, Competitive Strategies, and Industry Risks |
|
Key companies profiled |
BAE Systems Plc, Bohemia Interactive Simulations ks, CAE Inc., Cubic Corp., Fidelity Technologies Corp., Groupe Gorge, HAVELSAN Inc., Inveris Training Solutions, Kratos Defense and Security Solutions Inc., L3Harris Technologies Inc., Lockheed Martin Corp., Northrop Grumman Corp., Parker Hannifin Corp., Raytheon Technologies Corp., Rheinmetall AG, Saab AB, Teledyne Technologies Inc., Textron Inc., Thales Group, and The Boeing Co. |
|
Market dynamics |
Parent market analysis, market growth inducers and obstacles, market forecast, fast-growing and slow-growing segment analysis, COVID-19 impact and recovery analysis and future consumer dynamics, market condition analysis for the forecast period |
|
Customization purview |
If our market report has not included the data that you are looking for, you can reach out to our analysts and get segments customized. |
What are the Key Data Covered in this Market Research and Growth Report?
- CAGR of the market during the forecast period
- Detailed information on factors that will drive the market growth and forecasting between 2024 and 2028
- Precise estimation of the size of the market and its contribution of the market in focus to the parent market
- Accurate predictions about upcoming market growth and trends and changes in consumer behaviour
- Growth of the market across North America, APAC, Europe, Middle East and Africa, and South America
- Thorough analysis of the market's competitive landscape and detailed information about companies
- Comprehensive analysis of factors that will challenge the growth of market companies
We can help! Our analysts can customize this market research report to meet your requirements. Get in touch
 RIA -
RIA - 
