Mining Flotation Chemicals Market Size 2024-2028
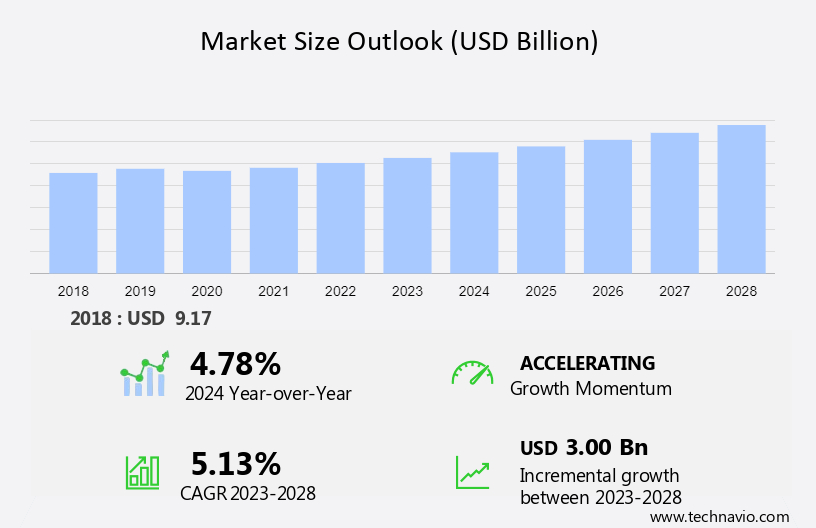
The mining flotation chemicals market size is forecast to increase by USD 3.00 billion at a CAGR of 5.13% between 2023 and 2028. The market is experiencing significant growth due to the increasing demand for minerals such as phosphate, potash, fluorite, base metals, and precious metals globally. The integration of digital technologies and smart solutions in the mining industry's flotation process is another driving factor. However, growing competition from alternative extraction methods poses a challenge to market growth. Sulfide ores and non-sulfide ores require different flotation chemicals, adding complexity to the market. Copper mining is a significant end-user industry for mining flotation chemicals. Key players in the market strive to dominate with innovative products and solutions to cater to the evolving needs of the mining industry. The market analysis also highlights the importance of dispersants in the flotation process, ensuring the efficient separation of minerals from the ore.
The mining industry's reliance on flotation chemicals has been significant during the historical period. This process is crucial for the extraction of various metals and minerals, including copper, gold, platinum metals, zinc, silver, and nickel, from their respective ores. Mining infrastructure plays a vital role in the efficient production of these metals and minerals. Mining for metals and minerals involves the extraction of ore with varying mineralogical species and copper ore grades. To optimize the mining production process, it is essential to understand the flotation collector responses for each mineral species. Flotation is a widely used mineral processing technique that involves the selective separation of hydrophobic minerals from hydrophilic gangue minerals. Flotation chemicals, such as collectors, frothers, and modifiers, are essential components of the flotation process.
Additionally, flotation chemicals, such as Moleaer's gas infusion technology, are used to improve the flotation process's efficiency and reduce the environmental impact. Strategic partnerships between mining companies and flotation chemical manufacturers have been a trend in the mining industry. For example, Solvay, a leading global chemical company, has partnered with various mining companies to provide customized flotation solutions to optimize mineral recovery and reduce production costs. In conclusion, the mining industry's dependence on flotation chemicals is crucial for the efficient and sustainable production of various metals and minerals. The selection of appropriate flotation chemicals based on mineralogy and ore grade is essential for maximizing mineral recovery while minimizing environmental impact. The development of environmentally friendly flotation techniques and strategic partnerships between mining companies and flotation chemical manufacturers will continue to drive the growth of the flotation chemicals market in the mining industry.
Market Segmentation
The market research report provides comprehensive data (region-wise segment analysis), with forecasts and estimates in "USD billion" for the period 2024-2028, as well as historical data from 2018-2022 for the following segments.
- Type
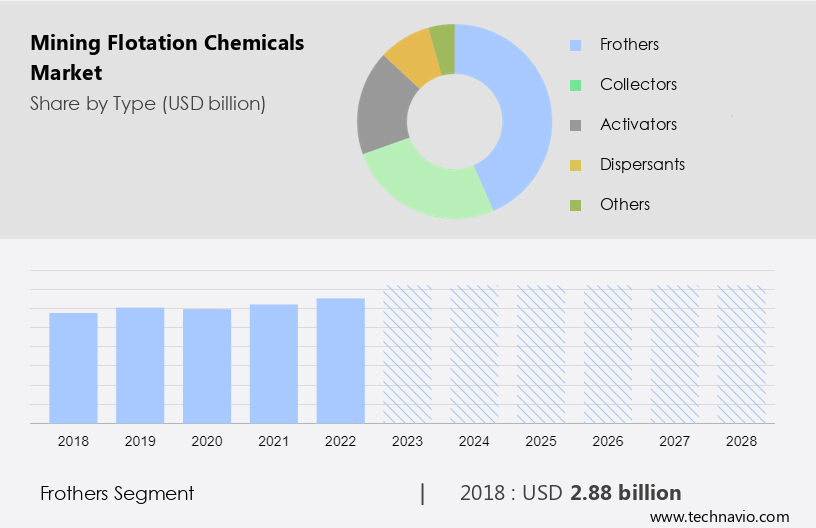
- Frothers
- Collectors
- Activators
- Dispersants
- Others
- Application
- Base metal mining
- Precious metal mining
- Industrial minerals mining
- Geography
- APAC
- China
- North America
- Canada
- US
- South America
- Brazil
- Europe
- Middle East and Africa
- APAC
By Type Insights
The frothers segment is estimated to witness significant growth during the forecast period. Flotation chemicals, specifically frothers, play a vital role in the mining industry, particularly in processes for extracting metals and minerals such as gold, platinum metals, zinc, silver, nickel, and copper. The increasing construction sector's demand for metals and minerals, driven by infrastructure development and technological advancements, necessitates efficient mining methods to meet this growing need.
Advanced flotation techniques, which rely on selective frothers to separate specific minerals from complex ores, are increasingly popular. These frothers must exhibit high selectivity and compatibility with various mineral types to maximize mineral recovery. For instance, gold mining and iron ore mining require specialized frothers to optimize mineral extraction. The market for mining flotation chemicals is expected to grow significantly due to this trend.
Get a glance at the market share of various segments Request Free Sample
The frothers segment accounted for USD 2.88 billion in 2018 and showed a gradual increase during the forecast period.
Regional Insights
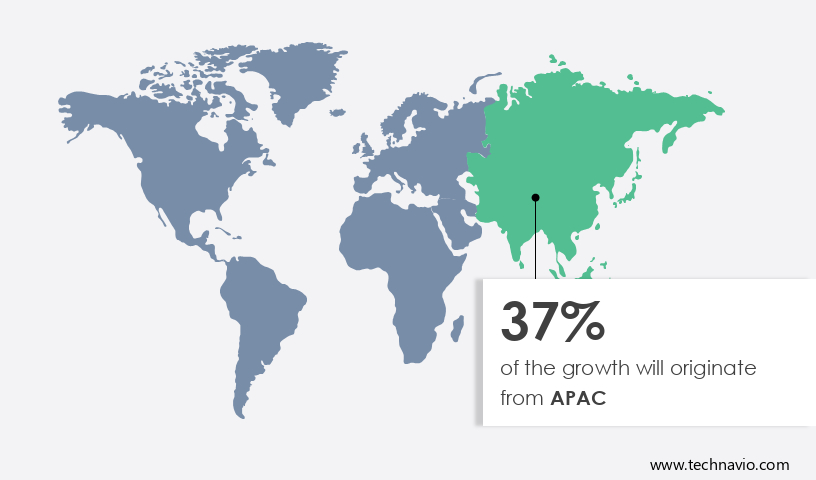
APAC is estimated to contribute 37% to the growth of the global market during the forecast period. Technavio's analysts have elaborately explained the regional trends and drivers that shape the market during the forecast period.
For more insights on the market share of various regions Request Free Sample
The Asia Pacific region is rich in mineral resources, including coal, iron ore, copper, gold, bauxite, and rare earth elements. The extraction and processing of these minerals require the use of flotation chemicals to enhance the flotation process. This process is essential for separating valuable minerals, such as copper from ores with a low chalcopyrite content. The region's industrialization and infrastructure development, particularly in countries like China, India, and Indonesia, have created a constant demand for minerals and construction materials. As a result, the mining industry's reliance on flotation chemicals to optimize mineral extraction continues to grow. Moreover, the increasing urban population in APAC countries necessitates the production of construction materials, leading to a ripple in mining activities and the utilization of flotation chemicals.
Additionally, the growing trend towards the use of bio-based thermoprotection agents in flotation chemicals is expected to offer significant opportunities for market growth. In summary, the Asia Pacific region's mineral-rich resources, industrialization, and economic growth create a continuous demand for flotation chemicals to support mining operations.
Our researchers analyzed the data with 2023 as the base year, along with the key drivers, trends, and challenges. A holistic analysis of drivers will help companies refine their marketing strategies to gain a competitive advantage.
Market Driver
Increasing demand for minerals globally is the key driver of the market. The mining industry's expansion, driven by the growing demand for minerals in sectors such as construction, electronics, automotive, and agriculture, is fueling The market. Mining flotation chemicals are essential for optimizing mineral extraction processes and enhancing recovery rates. These specialized reagents facilitate the attachment of mineral particles to air bubbles, enabling their separation from the slurry during the flotation process. Infrastructure development and advancements in mining technologies are further driving the market's growth.
Further, mining companies prioritize sustainable and environmentally friendly solutions to minimize losses and maximize efficiency. Mining flotation chemicals contribute significantly to achieving these goals by improving mineral processing and reducing waste. The market's future looks promising as the mining industry continues to evolve and adapt to the increasing demand for minerals.
Market Trends
Integration of digital technologies and smart solutions in mining flotation process is the upcoming trend in the market. Flotation chemicals play a crucial role in the mining industry, particularly in the extraction of both sulfide and non-sulfide ores. These chemicals, including dispersants, are essential for the flotation process, which is used to separate valuable minerals such as phosphate, potash, fluorite, base metals, and precious metals from the waste rock. The market for flotation chemicals is dominated by key players, and the demand for these solutions is driven by the need for efficient ore extraction and enhanced mineral recovery rates. Digital technologies have revolutionized the mining industry, enabling advanced process control systems that monitor and optimize flotation processes in real-time.
Moreover, the use of digital twin technology in mining enables the creation of virtual replicas of flotation processes, allowing for simulation, monitoring, and optimization of operations in real-time. Artificial intelligence (AI) applications, including machine learning algorithms, are employed for predictive modeling and decision-making in mineral processing. By leveraging these advanced technologies, mining companies can optimize their flotation processes, reduce costs, and enhance overall operational efficiency.
Market Challenge
Growing competition from alternative extraction methods is a key challenge affecting the market growth. The global mining industry is witnessing a shift towards alternative extraction methods, challenging the long-standing prominence of mining flotation processes. Sustainability and eco-friendliness are driving this change, as methods like bioleaching and hydrometallurgy offer potential advantages over traditional flotation. These methods may reduce the reliance on flotation chemicals and lower environmental impact. The focus on sustainable mining practices is increasing, and alternative extraction methods are gaining attention due to their reduced ecological footprint. Furthermore, innovations in technologies such as in-situ leaching and solvent extraction can lead to operational cost savings and are perceived as more energy-efficient alternatives to flotation. Logistical constraints and economic uncertainties can impact investment decisions in mining activities.
However, the adoption of smart flotation technologies and frothers can help improve mineral recovery while minimizing environmental impact. In conclusion, the mining industry is exploring various methods to reduce its environmental footprint and improve operational efficiency, with alternative extraction methods gaining traction.
Exclusive Customer Landscape
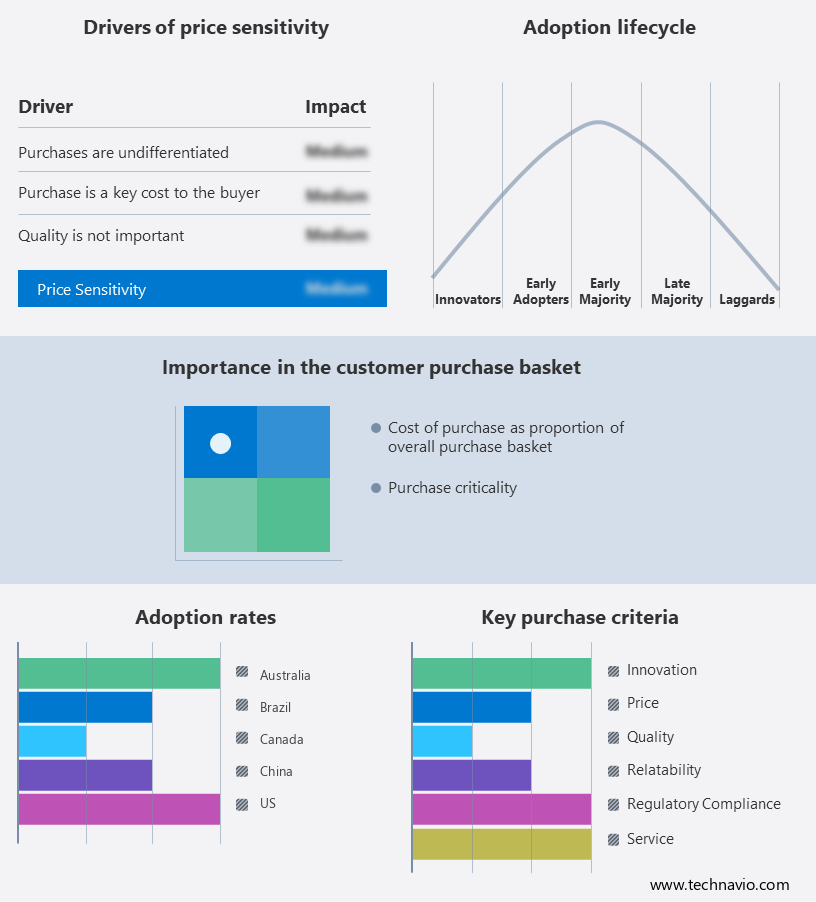
The market forecasting report includes the adoption lifecycle of the market, covering from the innovator's stage to the laggard's stage. It focuses on adoption rates in different regions based on penetration. Furthermore, the report also includes key purchase criteria and drivers of price sensitivity to help companies evaluate and develop their market growth analysis strategies.
Customer Landscape
Key Companies & Market Insights
Companies are implementing various strategies, such as strategic alliances, partnerships, mergers and acquisitions, geographical expansion, and product/service launches, to enhance their presence in the market.
Axis House Group: The company offers mining flotation-chemical namely Hydrofroth.
The market research and growth report includes detailed analyses of the competitive landscape of the market and information about key companies, including:
- Air Products and Chemicals Inc.
- Arkema Group
- BASF SE
- Beijing Hengju Chemical Group Co. Ltd.
- Charles Tennant and Co.
- Chevron Corp.
- Clariant International Ltd.
- Coogee
- Dow Chemical Co.
- Fardad Mining Chem
- FMC Corp.
- Huntsman International LLC
- Kemira Oyj
- KHD Humboldt Wedag International AG
- Nasaco International Ltd.
- Qixia Aotong Chemical Co. Ltd.
- Solvay SA
- The SNF Group
- Yantai Humon Group Co. Ltd.
Qualitative and quantitative analysis of companies has been conducted to help clients understand the wider business environment as well as the strengths and weaknesses of key market players. Data is qualitatively analyzed to categorize companies as pure play, category-focused, industry-focused, and diversified; it is quantitatively analyzed to categorize companies as dominant, leading, strong, tentative, and weak.
Research Analyst Overview
The market is driven by the increasing demand for specialized reagents used in the flotation process to extract minerals from slurry. Mineral particles in the slurry attach to air bubbles, allowing for the selective extraction of minerals such as sulfide ores, phosphate, potash, fluorite, base metals, and precious metals. Infrastructure development and the adoption of advanced mining technologies have led to an increase in mining activities, despite logistical constraints and economic uncertainties influencing investment decisions. Sustainable and eco-friendly solutions are becoming increasingly important in the mining industry, with a focus on reducing the environmental impact of mining activities. Smart flotation technologies, including frothers, dispersants, and sulfide ore flotation collectors, are being developed to improve mineral recovery and minimize the use of raw materials. The market for mining flotation chemicals is diverse, with applications in various mineral mining industries such as copper mining, gold mining, platinum metals mining, zinc mining, silver mining, and nickel mining.
Further, the use of flotation collectors, conditioning agents, slime dispersants, and resurfacing agents in the flotation process is essential for efficient mineral extraction. The market for mining flotation chemicals is dominated by companies providing customized reagents for specific mineralogy species and mining operations. Overseas shipment and logistical constraints can impact the sales of minerals and the mining production process. The energy sector's reliance on minerals and the global mining industry's historical period of growth have contributed to the market's growth. Environmentally friendly techniques, such as the use of novel frothers and flocculants, are being adopted to minimize the environmental impact of mining activities. The use of bio-based thermoprotection and greenhouse gas reduction technologies is also gaining popularity in the mining industry. Strategic partnerships between companies, such as Moleaer and Solvay, are driving innovation in the market.
|
Market Scope |
|
|
Report Coverage |
Details |
|
Page number |
181 |
|
Base year |
2023 |
|
Historic period |
2018-2022 |
|
Forecast period |
2024-2028 |
|
Growth momentum & CAGR |
Accelerate at a CAGR of 5.13% |
|
Market Growth 2024-2028 |
USD 3.00 billion |
|
Market structure |
Fragmented |
|
YoY growth 2023-2024(%) |
4.78 |
|
Regional analysis |
APAC, North America, South America, Europe, and Middle East and Africa |
|
Performing market contribution |
APAC at 37% |
|
Key countries |
US, Canada, China, Australia, and Brazil |
|
Competitive landscape |
Leading Companies, Market Positioning of Companies, Competitive Strategies, and Industry Risks |
|
Key companies profiled |
Air Products and Chemicals Inc., Arkema Group, Axis House Group, BASF SE, Beijing Hengju Chemical Group Co. Ltd., Charles Tennant and Co., Chevron Corp., Clariant International Ltd., Coogee, Dow Chemical Co., Fardad Mining Chem, FMC Corp., Huntsman International LLC, Kemira Oyj, KHD Humboldt Wedag International AG, Nasaco International Ltd., Qixia Aotong Chemical Co. Ltd., Solvay SA, The SNF Group, and Yantai Humon Group Co. Ltd. |
|
Market dynamics |
Parent market analysis, market growth inducers and obstacles, market forecast, fast-growing and slow-growing segment analysis, COVID-19 impact and recovery analysis and future consumer dynamics, market condition analysis for the forecast period |
|
Customization purview |
If our market report has not included the data that you are looking for, you can reach out to our analysts and get segments customized. |
What are the Key Data Covered in this Market Research and Growth Report?
- CAGR of the market during the forecast period
- Detailed information on factors that will drive the market growth and forecasting between 2024 and 2028
- Precise estimation of the size of the market and its contribution of the market in focus to the parent market
- Accurate predictions about upcoming market growth and trends and changes in consumer behaviour
- Growth of the market across APAC, North America, South America, Europe, and Middle East and Africa
- Thorough analysis of the market's competitive landscape and detailed information about companies
- Comprehensive analysis of factors that will challenge the growth of market companies
We can help! Our analysts can customize this market research report to meet your requirements. Get in touch
 RIA -
RIA - 
