Missiles And Missile Defense Systems Market Size 2024-2028
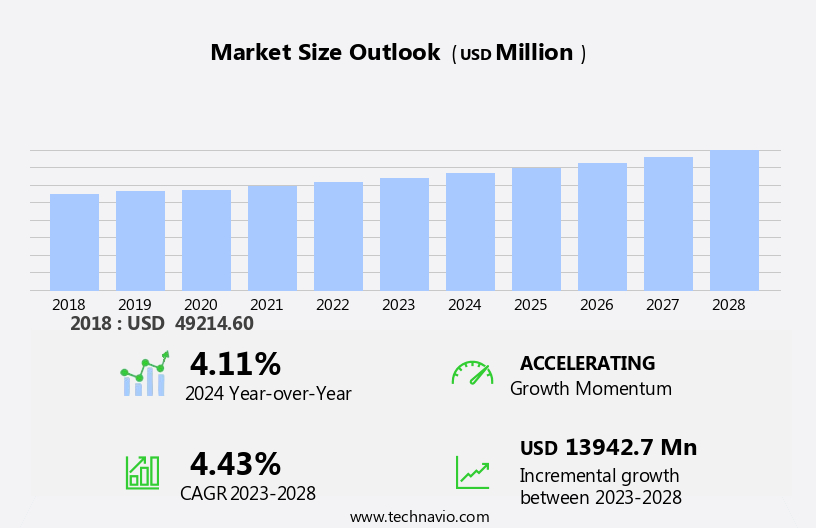
The missiles and missile defense systems market size is forecast to increase by USD 13.94 billion at a CAGR of 4.43% between 2023 and 2028.
- The market is experiencing significant growth due to escalating territorial disputes among nations, leading to an increase in the demand for advanced armored vehicles, hypersonic missiles, and air defense systems. Additionally, the adoption of ballistic missiles is on the rise, despite the cost and budget constraints associated with their development and use.
- In response to these challenges, innovations in technology such as LED systems, artificial intelligence, and machine learning are being integrated into defense systems to enhance their capabilities. Hypersonic missiles, with their ability to travel at Mach 5 or more, pose a significant threat and are driving the development of advanced defense systems. Overall, the market is expected to witness strong growth in the coming years as nations continue to invest in advanced missile technologies to secure their borders and protect their interests.
What will be the Size of the Missiles And Missile Defense Systems Market During the Forecast Period?
- The market encompasses the production, development, and deployment of various types of missiles and associated defense solutions. Key market drivers include regional conflicts and military modernization efforts, necessitating advanced strategic defense solutions. Propulsion systems, guidance technologies, and warhead innovations are critical components, with precision engineering, testing and validation, and defense budgets playing essential roles in market growth. Missile defense programs, including those for ballistic missiles and surface-to-air missiles, are a significant focus. Technological advancements in weapon system technology, such as artificial intelligence and fifth-generation weapon systems, are transforming the landscape.
- Additionally, stealth aircraft and interception capabilities are becoming increasingly important, with trajectory analysis and countermeasure strategies playing key roles. Military spending remains a significant factor, with ongoing investment in defense systems and continuous innovation in areas like propulsion, guidance, and weapon design.
How is this Missiles And Missile Defense Systems Industry segmented and which is the largest segment?
The missiles and missile defense systems industry research report provides comprehensive data (region-wise segment analysis), with forecasts and estimates in "USD billion" for the period 2024-2028, as well as historical data from 2018-2022 for the following segments.
- Product
- Missile defense systems
- Surface-to-surface missile
- Air-to-surface missile
- Surface-to-air missile
- Others
- End-user
- Army
- Airforce
- Navy
- Geography
- North America
- US
- APAC
- China
- India
- Europe
- France
- Middle East and Africa
- South America
- North America
By Product Insights
- The missile defense systems segment is estimated to witness significant growth during the forecast period.
Missile defense systems are essential components of national security, designed to intercept and destroy incoming missiles. These systems involve a coordinated series of actions, including tracking, identification, detection, and elimination of missiles during flight. Current defense solutions employ interceptors to cause an explosion on or near the missile or collide with it. However, future advancements may incorporate space-based or ground-based lasers for more powerful and precise interception. Despite advancements, no long-range missile interception has been successfully executed in a real-world situation. Short-range defense systems have shown varying degrees of success in combat scenarios. Military modernization efforts, regional conflicts, and defense contractors drive the market for strategic defense solutions.
Propulsion systems, guidance technologies, warhead innovations, precision engineering, testing, and validation are integral components of these systems. Missile defense systems protect defense platforms, including aircraft, ships, and ground-based systems, from air, ground, and space-based threats. Defense expenditures, geopolitical tensions, and security threats further fuel the market's growth. Hypersonic missiles, AI-integrated systems, network-centric warfare, cost-effective missile systems, and space-based defense are emerging trends. Missile defense programs include ballistic missiles, Patriot Advanced Capability-3, stealth aircraft, and various air, surface-to-air, and air-to-air missiles. The defense budget, defense programs, and military spending continue to prioritize these systems for national security.
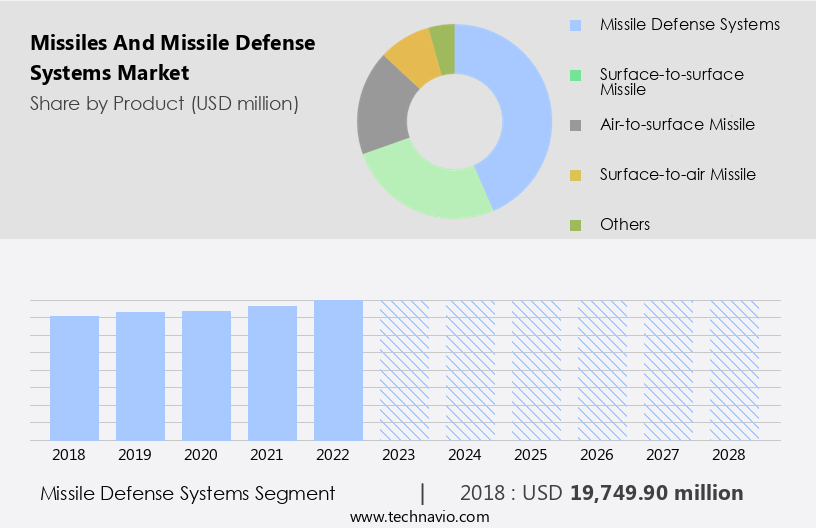
Get a glance at the market report of share of various segments Request Free Sample
The missile defense systems segment was valued at USD 19.75 billion in 2018 and showed a gradual increase during the forecast period.
Regional Analysis
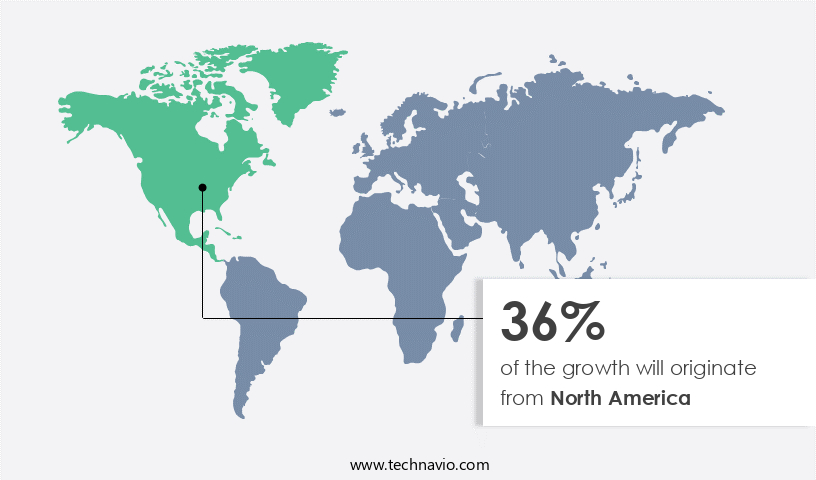
- North America is estimated to contribute 36% to the growth of the global market during the forecast period.
Technavio's analysts have elaborately explained the regional trends and drivers that shape the market during the forecast period.
For more insights on the market share of various regions, Request Free Sample
The North American region dominates The market due to advanced technological capabilities and substantial defense expenditures. The US, Canada, and Mexico possess developed defense sectors, driving market growth through investments in missile technology and defense systems. Key factors fueling market expansion include military modernization efforts, defense contractors, and strategic defense solutions. Technological advancements in propulsion systems, guidance technologies, warhead innovations, precision engineering, testing and validation, and radar and sensor technologies are crucial.
Hypersonic missiles, AI-integrated systems, network-centric warfare, and cost-effective missile systems are emerging trends. Geopolitical tensions and security threats necessitate continuous modernization programs and international collaborations. Export controls and defense systems play a significant role in ensuring national security. The market spans various domains, including air, ground, marine, and space, encompassing air defense systems, interceptors, military forces, and precision-guided munitions. Market growth is further influenced by defense budgets, defense programs, and ballistic missiles, such as the Patriot Advanced Capability-3, stealth aircraft, and interception technologies.
Market Dynamics
Our researchers analyzed the data with 2023 as the base year, along with the key drivers, trends, and challenges. A holistic analysis of drivers will help companies refine their marketing strategies to gain a competitive advantage.
What are the key market drivers leading to the rise in the adoption of Missiles And Missile Defense Systems Industry?
The increasing territorial disputes among nations is the key driver of the market.
- Missile and defense systems continue to be a significant focus for military modernization efforts in the face of regional conflicts and geopolitical tensions. Defense contractors are at the forefront of providing strategic defense solutions, developing advanced propulsion systems, guidance technologies, and warhead innovations.
- Moreover, precision engineering plays a crucial role in the deployment of defense platforms such as aircraft, ships, and ground-based systems. Regular maintenance and testing and validation are essential to ensure the effectiveness of these systems. Defense expenditures are on the rise due to the increasing threat of ballistic missiles, hypersonic missiles, and other advanced weapons. Thus, such factors are driving the growth of the market during the forecast period.
What are the market trends shaping the Missiles And Missile Defense Systems Industry?
Increasing adoption of ballistic missiles is the upcoming market trend.
- Missile and missile defense systems continue to be a significant focus for military modernization efforts in the face of regional conflicts and geopolitical tensions. Defense contractors are at the forefront of providing strategic defense solutions, developing advanced propulsion systems, guidance technologies, and warhead innovations.
- Moreover, precision engineering plays a crucial role in ensuring the effectiveness of these systems, with rigorous testing and validation processes in place. Deployment of defense systems is diverse, encompassing defense platforms such as aircraft, ships, and ground-based systems. Regular maintenance and upkeep are essential to ensure their readiness for deployment. Thus, such trends will shape the growth of the market during the forecast period.
What challenges does the Missiles And Missile Defense Systems Industry face during its growth?
Cost and budget constraints associated with development and use of missiles and defense systems is a key challenge affecting the industry growth.
- This systems continue to be a critical focus for military modernization efforts in the face of regional conflicts and geopolitical tensions. Defense contractors are at the forefront of providing strategic defense solutions, developing advanced propulsion systems, guidance technologies, and warhead innovations.
- Moreover, precision engineering plays a crucial role in testing and validating these systems on defense platforms such as aircraft, ships, and ground-based systems. Regular maintenance and deployment are essential for effective defense, requiring significant defense expenditures. Hence, the above factors will impede the growth of the market during the forecast period.
Exclusive Customer Landscape
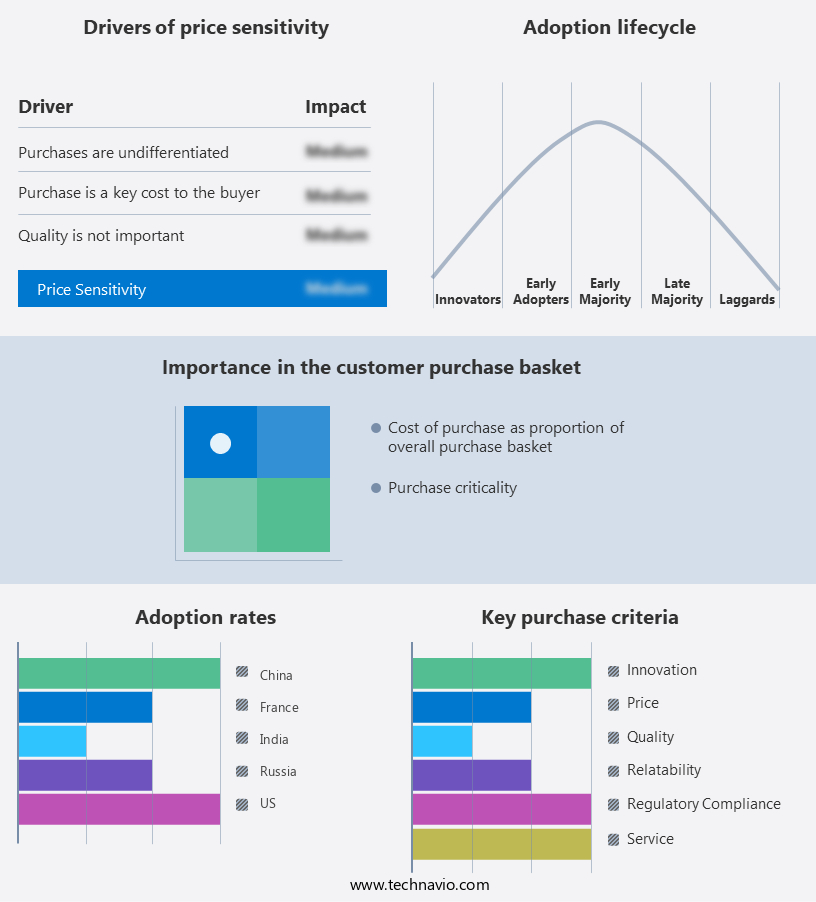
The market forecasting report includes the adoption lifecycle of the market, market growth and forecasting, covering from the innovator's stage to the laggard's stage. It focuses on adoption rates in different regions based on penetration. Furthermore, the market report also includes key purchase criteria and drivers of price sensitivity to help companies evaluate and develop their market growth analysis strategies.
Customer Landscape
Key Companies & Market Insights
Companies are implementing various strategies, such as strategic alliances, missiles and missile defense systems market forecast, partnerships, mergers and acquisitions, geographical expansion, and product/service launches, to enhance their presence in the industry.
The industry research and growth report includes detailed analyses of the competitive landscape of the market and information about key companies, including:
- Almaz Antey Air and Space Defense Corp.
- BAE Systems Plc
- Bharat Dynamics Ltd.
- China Aerospace Science and Technology Corp.
- Diehl Stiftung and Co. KG
- EDGE Group PJSC
- General Dynamics Corp.
- Israel Aerospace Industries Ltd.
- Kongsberg Gruppen ASA
- L3Harris Technologies Inc.
- Lockheed Martin Corp.
- MBDA
- Northrop Grumman Corp.
- Rheinmetall AG
- RTX Corp.
- Saab AB
- SAMI
- Tactical Missiles Corp.
- Thales Group
- The Boeing Co.
Qualitative and quantitative analysis of companies has been conducted to help clients understand the wider business environment as well as the strengths and weaknesses of key industry players. Data is qualitatively analyzed to categorize companies as pure play, category-focused, industry-focused, and diversified; it is quantitatively analyzed to categorize companies as dominant, leading, strong, tentative, and weak.
Research Analyst Overview
The market is experiencing significant growth due to various military modernization efforts and geopolitical tensions around the world. Defense contractors are investing heavily in research and development to provide strategic defense solutions that can counteract the evolving threat landscape. Propulsion systems and guidance technologies are key focus areas for missile development. Precision engineering plays a crucial role in ensuring the accuracy and effectiveness of these weapons. Testing and validation are essential components of the development process, ensuring that missile systems are reliable and effective in various environments. Defense platforms, including aircraft, ships, and ground-based systems, are being equipped with advanced systems to enhance their capabilities. Deployment and regular maintenance are critical aspects of ensuring the readiness of these systems. Defense expenditures continue to increase as nations prioritize national security and invest in modernization programs. Hypersonic missiles, which travel at speeds above Mach 5, are a new and significant threat to global security. AI-integrated systems and network-centric warfare are being explored as potential solutions to counteract these threats. Cost-effective missile systems are also in high demand, as countries seek to balance defense spending with other priorities. Space-based defense is another area of focus, as the ability to defend against missiles in the space domain becomes increasingly important.
Global defense spending continues to rise, driven in part by the need to address these emerging threats. Geopolitical tensions and security threats are major drivers of missile development and defense spending. Modernization programs and international collaborations are common as nations seek to enhance their defensive capabilities. Export controls are also a significant factor, as countries seek to protect their technological advantages. Radar technologies and sensor technologies are essential components of systems, providing early warning and targeting capabilities. Interceptors, such as surface-to-air missiles, air-to-surface missiles, air-to-air missiles, and anti-ship missiles, are being developed to counteract various types of threats. Military forces are increasingly relying on precision-guided munitions and AI-driven targeting systems to improve the effectiveness of their weapon systems. The defense budget continues to be a significant focus for governments around the world, with defense programs receiving significant funding. Ballistic missiles remain a significant threat, with various nations developing and deploying these weapons. The Patriot Advanced Capability-3 system is one example of a defense system designed to counteract ballistic missiles. Stealth aircraft and interception technologies are also being explored as potential solutions. Missile launchers come in various sizes and ranges, from short range to long range, and subsonic to supersonic.
The ground domain, air domain, marine domain, and space domain all present unique challenges and require specialized defense solutions. Directed energy and simulation exercises are also areas of research and development in the systems market. Furthermore, the integration of systems into helicopters and drones is gaining popularity for enhanced mobility and flexibility. As the threat landscape continues to evolve, defense contractors and military forces must stay ahead of the curve to ensure effective defense capabilities. Thus, the market is a dynamic and complex industry, driven by military modernization efforts, geopolitical tensions, and emerging threats. Defense contractors are investing in research and development to provide strategic solutions, while governments around the world prioritize national security and defense spending. The use of advanced technologies, such as AI and directed energy, is becoming increasingly important in the development of effective systems.
|
Market Scope |
|
|
Report Coverage |
Details |
|
Page number |
202 |
|
Base year |
2023 |
|
Historic period |
2018-2022 |
|
Forecast period |
2024-2028 |
|
Growth momentum & CAGR |
Accelerate at a CAGR of 4.43% |
|
Market growth 2024-2028 |
USD 13.94 billion |
|
Market structure |
Fragmented |
|
YoY growth 2023-2024(%) |
4.11 |
|
Key countries |
US, China, Russia, India, and France |
|
Competitive landscape |
Leading Companies, Market Positioning of Companies, Competitive Strategies, and Industry Risks |
What are the Key Data Covered in this Missiles And Missile Defense Systems Market Research and Growth Report?
- CAGR of the Missiles And Missile Defense Systems industry during the forecast period
- Detailed information on factors that will drive the growth and forecasting between 2024 and 2028
- Precise estimation of the size of the market and its contribution of the industry in focus to the parent market
- Accurate predictions about upcoming growth and trends and changes in consumer behaviour
- Growth of the market across North America, APAC, Europe, Middle East and Africa, and South America
- Thorough analysis of the market's competitive landscape and detailed information about companies
- Comprehensive analysis of factors that will challenge the missiles and missile defense systems market growth of industry companies
We can help! Our analysts can customize this missiles and missile defense systems market research report to meet your requirements.
 RIA -
RIA - 
