Mixed Martial Arts Equipment Market Analysis North America, Europe, APAC, South America, Middle East and Africa - US, Canada, Germany, UK, France, Italy, China, Brazil, India, Japan - Size and Forecast 2025-2029

Mixed Martial Arts Equipment Market Analysis North America, Europe, APAC, South America, Middle East and Africa - US, Canada, Germany, UK, France, Italy, China, Brazil, India, Japan - Size and Forecast 2025-2029

Published: Mar 2025 209 Pages SKU: IRTNTR40755

Market Overview at a Glance

$277.6 Mn
Market Opportunity
4.8%
CAGR
4.3
YoY growth 2024-2025(%)

Mixed Martial Arts Equipment Market Size 2025-2029

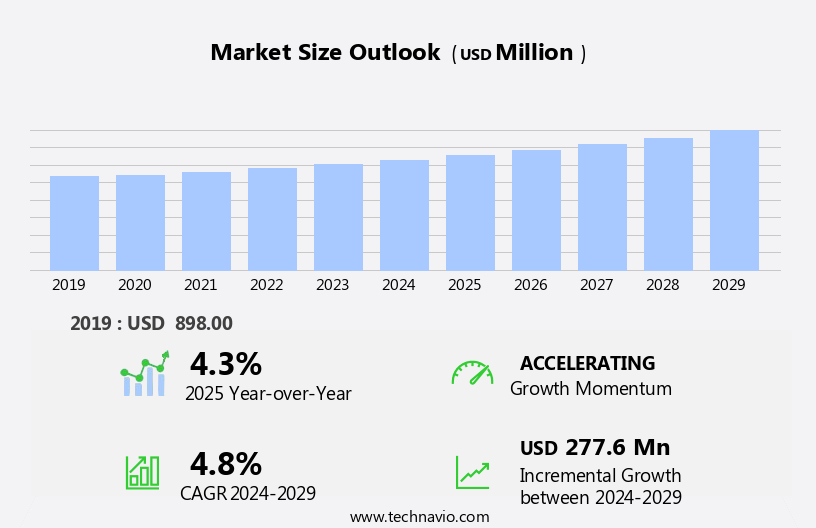
The mixed martial arts equipment market size is forecast to increase by USD 277.6 million at a CAGR of 4.8% between 2024 and 2029.

  • The Mixed Martial Arts (MMA) Equipment Market is experiencing significant growth due to several key trends. The increasing popularity of women in MMA is driving market expansion, as more females are taking up the sport and requiring specialized equipment. Additionally, the number of fitness centers and health clubs offering MMA classes is on the rise, providing a larger customer base for equipment suppliers. MMA gloves are distinct from those used in other combat sports like boxing, featuring open-fingered or half-fingered designs made primarily of leather and synthetic materials like polyurethane, neoprene, and polyvinyl chloride. Furthermore, the growing interest in alternative sports, particularly among the younger demographic, is fueling market growth. These trends are expected to continue, making the MMA Equipment Market an attractive investment opportunity.

What will be the Size of the Mixed Martial Arts Equipment Market During the Forecast Period?

Mixed Martial Arts Equipment Market Size

 Request Free Sample

  • The global mixed martial arts (MMA) equipment market encompasses a diverse range of training and protection gear utilized by players engaged in this high-intensity combat sport. Key product categories include punching bags, gloves, shorts, shin guards, hand wraps, ankle pads, elbow pads, knee pads, headgear, mouthguards, grappling dummies, rash guards, walkout gear, water bottles, gym bags, custom gloves, and wraps. This market experiences growth due to the increasing popularity of MMA as a recreational sport and the associated health benefits, such as improved heart health, stress reduction, and mitigation of chronic diseases. Consumers seek out high-quality training equipment and protection gear to enhance their performance and ensure safety during intense workouts.
  • The MMA equipment market is expected to continue expanding, driven by the ever-evolving nature of the sport and the ongoing demand for innovative, effective, and protective gear.

How is this Mixed Martial Arts Equipment Industry segmented and which is the largest segment?

The mixed martial arts equipment industry research report provides comprehensive data (region-wise segment analysis), with forecasts and estimates in "USD million" for the period 2025-2029, as well as historical data from 2019-2023 for the following segments.

  • Product
    • MMA gloves
    • Protective gear
    • Training equipment
  • Distribution Channel
    • Offline
    • Online
  • End-user
    • Individual
    • Organization
  • Geography
    • North America
      • Canada
      • US
    • Europe
      • Germany
      • UK
      • France
      • Italy
    • APAC
      • China
      • India
      • Japan
    • South America
      • Brazil
    • Middle East and Africa

By Product Insights

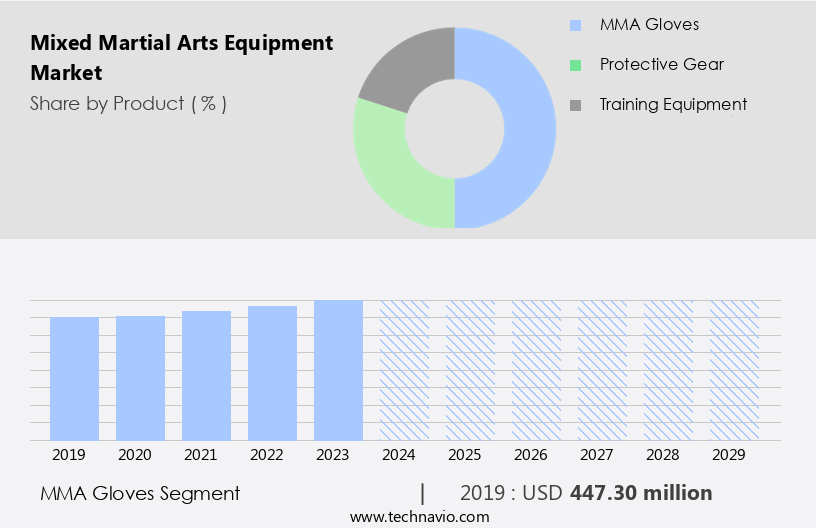
  • The MMA gloves segment is estimated to witness significant growth during the forecast period.

The MMA equipment market encompasses a range of training and protection gear used in mixed martial arts (MMA), a full-contact combat sport. The MMA gloves segment dominates the market due to their essential role In the sport. These gloves protect knuckles and wrists, minimizing the impact of punches on opponents. Durability is crucial for MMA gloves, as they must withstand the power and force exerted during training and competition.

Other equipment includes punching bags, shorts, shin guards, hand wraps, ankle pads, elbow pads, knee pads, headgear, mouthguards, grappling dummies, rash guards, walkout gear, water bottles, gym bags, custom gloves, and wraps. Consumers, including players, fitness enthusiasts, and professional fighters, utilize this equipment for recreational sports, health benefits, such as heart health, stress reduction, and combating chronic diseases, and for training in professional camps, advanced facilities, and fitness centers. Advertising campaigns, celebrity endorsements, the e-commerce sector, connected devices, and performance measurement tools, including real-time tracking, power measurement, speed measurement, and punch measurement, further drive market growth.

Mixed Martial Arts Equipment Market Size

Get a glance at the market report of share of various segments Request Free Sample

The MMA gloves segment was valued at USD 447.30 million in 2019 and showed a gradual increase during the forecast period.

Regional Analysis

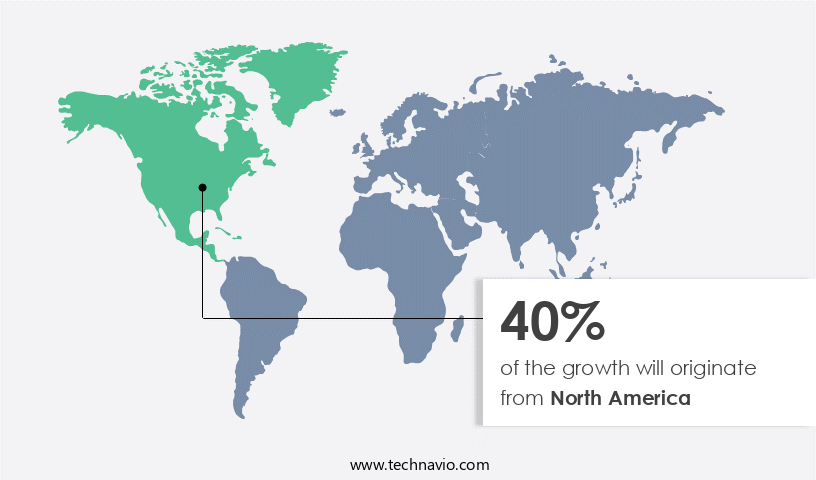
  • North America is estimated to contribute 40% to the growth of the global market during the forecast period.

Technavio's analysts have elaborately explained the regional trends and drivers that shape the market during the forecast period.

Mixed Martial Arts Equipment Market Share by Geography

For more insights on the market size of various regions, Request Free Sample

The Mixed Martial Arts (MMA) equipment market in North America is the largest globally, driven by the popularity of MMA as a sport, particularly among males aged 18-36 In the US. With over 70,000 martial arts schools and over 4.5 million participants, the market generates annual revenue of over USD 450 million from the sale of equipment. The Ultimate Fighting Championship (UFC), a leading MMA league, significantly contributes to the demand for training equipment and protection gear, including MMA gloves, punching bags, mouth guards, headgear, shin guards, hand wraps, ankle pads, elbow pads, and knee pads. Fitness centers, professional training camps, advanced training facilities, and players also contribute to the market's growth.

Consumers seek MMA equipment for recreational sports, health benefits such as heart health, stress reduction, and combating chronic diseases, as well as for professional training. The market is further boosted by advertising campaigns, celebrity endorsements, the e-commerce sector, and the integration of connected devices for performance measurement, real-time tracking, power measurement, speed measurement, and punch measurement.

Market Dynamics

Our researchers analyzed the data with 2024 as the base year, along with the key drivers, trends, and challenges. A holistic analysis of drivers will help companies refine their marketing strategies to gain a competitive advantage.

What are the key market drivers leading to the rise In the adoption of Mixed Martial Arts Equipment Industry?

Growing popularity of women MMA is the key driver of the market.

  • Mixed Martial Arts (MMA) has witnessed a notable rise in female participation, with an increasing number of women competing professionally and recreationally. Various organizations conduct championships, such as the UFC Women's Featherweight, Bantamweight, Flyweight, and Strawweight Championships, to promote women's involvement In the sport. MMA equipment, including punching bags, gloves, shorts, shin guards, hand wraps, ankle pads, elbow pads, knee pads, headgear, mouthguards, grappling dummies, rash guards, walkout gear, water bottles, gym bags, custom gloves, and wraps, caters to both players and consumers. These equipment cater to training needs, as well as offer protection during competitions. MMA's popularity is driven by its health benefits, such as heart health improvement, stress reduction, and the prevention and management of chronic diseases.
  • The trend towards combating sedentary lifestyles further fuels the demand for MMA equipment. Advanced training facilities, professional training camps, fitness centers, advertising campaigns, and celebrity endorsements contribute to the market's growth. The e-commerce sector, connected devices, performance measurement, real-time tracking, power measurement, speed measurement, and punch measurement also play a significant role In the market's expansion.

What are the market trends shaping the Mixed Martial Arts Equipment Industry?

Number of fitness centers and health clubs is the upcoming market trend.

  • The combat sport of Mixed Martial Arts (MMA) has witnessed significant growth, driven by the increasing number of fitness centers and health clubs worldwide. To attract and retain members, these establishments offer exclusive packages, including discounted annual or monthly memberships. These premium offerings provide additional benefits, such as free workouts for a month. The rise in fitness centers and health clubs is a primary factor contributing to the expanding MMA player base. As of 2023, over 113,300 gyms, health clubs, and fitness centers were operational In the US alone. MMA training equipment, including punching bags, gloves, shorts, shin guards, hand wraps, ankle pads, elbow pads, knee pads, headgear, mouth guards, grappling dummies, rash guards, walkout gear, water bottles, gym bags, custom gloves, and wraps, is in high demand to cater to the growing number of MMA players.
  • Consumers are drawn to MMA due to its health benefits, such as heart health improvement, stress reduction, and the prevention and management of chronic diseases. Sedentary lifestyles have become a major concern, making recreational sports like MMA increasingly popular. The e-commerce sector, connected devices, and advertising campaigns, including celebrity endorsements, further fuel the market's growth. Performance measurement tools, such as real-time tracking, power measurement, speed measurement, and punch measurement, are also gaining traction, enhancing the overall training experience.

What challenges does the Mixed Martial Arts Equipment Industry face during its growth?

Rising popularity of alternative sports is a key challenge affecting the industry growth.

  • The market caters to players and consumers engaged in combat sports, offering training equipment and protection gear. Key product categories include punching bags, gloves, shorts, shin guards, hand wraps, ankle pads, elbow pads, knee pads, headgear, mouthguards, grappling dummies, rash guards, walkout gear, water bottles, gym bags, custom gloves, and wraps. The market faces competition from other combat sports like boxing, judo, wrestling, fencing, kickboxing, Muay Thai, Savate, Capoeira, Sanda, Tae Kwon Do, HMB, Sambo, Brazilian jiu-jitsu, Kyokushin, and kudo. The popularity of outdoor sports, such as cricket, football, hockey, baseball, basketball, tennis, and swimming, also impacts the market. Consumers increasingly opt for fitness activities like yoga and cardio exercises, such as aerobics, walking, jogging, cycling, rope skipping, and dancing, which offer health benefits like heart health improvement, stress reduction, and chronic disease management.
  • The market includes advanced training facilities, professional training camps, fitness centers, advertising campaigns, and celebrity endorsements. The e-commerce sector, connected devices, performance measurement, real-time tracking, power measurement, speed measurement, and punch measurement are emerging trends.

Exclusive Customer Landscape

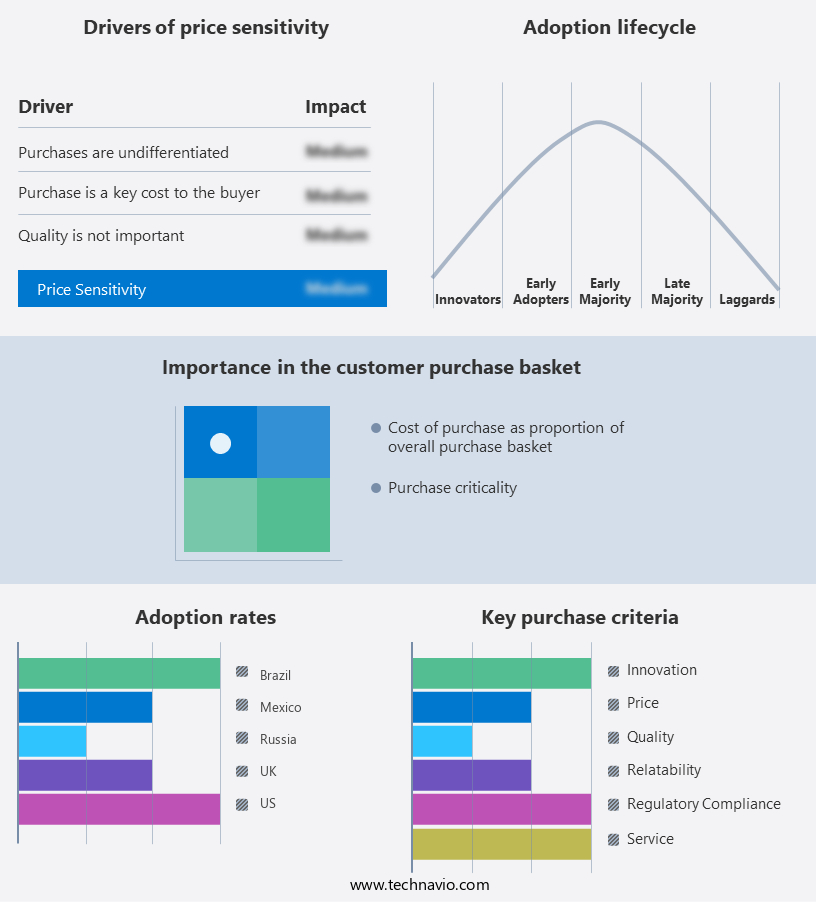
The mixed martial arts equipment market forecasting report includes the adoption lifecycle of the market, covering from the innovator's stage to the laggard's stage. It focuses on adoption rates in different regions based on penetration. Furthermore, the mixed martial arts equipment market report also includes key purchase criteria and drivers of price sensitivity to help companies evaluate and develop their market growth analysis strategies.

Mixed Martial Arts Equipment Market Share by Geography

 Customer Landscape

Key Companies & Market Insights

Companies are implementing various strategies, such as strategic alliances, mixed martial arts equipment market forecast, partnerships, mergers and acquisitions, geographical expansion, and product/service launches, to enhance their presence In the industry.

Adidas AG - The company offers Mixed martial arts equipment such as ADIDAS HYBRID 80, ADIDAS TILT 350, ADIDAS ADILIGHT UNIFORM, ADIDAS WTF CHEST GUARD, and others.

The industry research and growth report includes detailed analyses of the competitive landscape of the market and information about key companies, including:

  • Adidas AG
  • Blitz Corp. Ltd.
  • Century LLC
  • Combat Brands LLC
  • FAIRTEX EQUIPMENT CO. LTD.
  • Hayabusa Fightwear Inc.
  • King Martial Arts Supplies
  • KWON Inc.
  • MRX Products Inc.
  • Outslayer Fight Gear
  • Proforce Inc.
  • RDX Inc.
  • Revgear Sports Co.
  • SportsDirect.com Retail Ltd.
  • Tiger Claw
  • TITLE Boxing
  • Twins Special LLC
  • Venum
  • Zebra Athletics

Qualitative and quantitative analysis of companies has been conducted to help clients understand the wider business environment as well as the strengths and weaknesses of key industry players. Data is qualitatively analyzed to categorize companies as pure play, category-focused, industry-focused, and diversified; it is quantitatively analyzed to categorize companies as dominant, leading, strong, tentative, and weak.

Research Analyst Overview

The  market encompasses a wide range of products designed to enhance the training and performance of players participating in various combat sports. This market caters to both recreational consumers and professional athletes, with an emphasis on providing equipment that offers superior protection and performance. Combat sport equipment includes punching bags, gloves, shorts, shin guards, hand wraps, ankle pads, elbow pads, knee pads, headgear, and other protective gear. These items are essential for fighters, as they help minimize injuries and optimize training sessions. Additionally, combat sport equipment caters to the fitness community, with consumers seeking equipment to improve their overall health and wellness.

The benefits of combat sport training extend beyond physical fitness. Regular participation in combat sports has been linked to improved heart health, stress reduction, and the prevention and management of chronic diseases. With increasingly sedentary lifestyles becoming a global concern, combat sport equipment provides an effective solution for individuals looking to incorporate physical activity into their daily routines. Professional training camps and advanced training facilities are significant contributors to the combat sport equipment market. These institutions rely on high-quality equipment to provide their athletes with the best possible training experience. Fighters, in particular, require specialized gear that can withstand the rigors of intense training sessions.

Fitness centers and gyms also play a crucial role In the market, offering combat sport classes and equipment rentals to their members. These establishments provide an accessible and convenient solution for individuals looking to try combat sports without investing In their own equipment. Advertising campaigns and celebrity endorsements have significantly influenced the market's growth. High-profile athletes and influencers In the combat sports world have lent their endorsement to various brands, driving consumer interest and sales. The e-commerce sector has emerged as a significant distribution channel for combat sport equipment, allowing consumers to purchase items online from the comfort of their own homes.

Connected devices, such as performance measurement tools and real-time tracking systems, have also gained popularity among combat sport enthusiasts, providing valuable insights into their training progress and performance metrics. Power measurement, speed measurement, and punch measurement technologies have become increasingly important In the combat sport equipment market. These advanced features allow athletes to monitor and analyze their training data, enabling them to optimize their performance and achieve better results. Institutions, offline retail stores, and online retail stores all play a role In the distribution of combat sport equipment. Each channel offers unique advantages, catering to different consumer preferences and shopping behaviors.

Custom gloves, wraps, clothes, and other personalized equipment have gained popularity in recent years, allowing consumers to express their individuality and enhance their training experience. Rash guards, grappling dummies, mouth guards, headgear, and walkout gear are just a few examples of the diverse range of combat sport equipment available In the market. Water bottles, gym bags, and other essential accessories complete the combat sport equipment landscape, ensuring that athletes and fitness enthusiasts have all the tools they need to train effectively and safely. Overall, the market continues to evolve, driven by advancements in technology, consumer preferences, and the growing popularity of combat sports.

Market Scope

Report Coverage

Details

Page number

209

Base year

2024

Historic period

2019-2023

Forecast period

2025-2029

Growth momentum & CAGR

Accelerate at a CAGR of 4.8%

Market growth 2025-2029

USD 277.6 million

Market structure

Fragmented

YoY growth 2024-2025(%)

4.3

Key countries

US, Canada, Germany, UK, France, Italy, China, Brazil, India, and Japan

Competitive landscape

Leading Companies, Market Positioning of Companies, Competitive Strategies, and Industry Risks

Request Free Sample

What are the Key Data Covered in this Mixed Martial Arts Equipment Market Research and Growth Report?

  • CAGR of the Mixed Martial Arts Equipment industry during the forecast period
  • Detailed information on factors that will drive the growth and forecasting between 2025 and 2029
  • Precise estimation of the size of the market and its contribution of the industry in focus to the parent market
  • Accurate predictions about upcoming growth and trends and changes in consumer behaviour
  • Growth of the market across North America, Europe, APAC, South America, and Middle East and Africa
  • Thorough analysis of the market's competitive landscape and detailed information about companies
  • Comprehensive analysis of factors that will challenge the mixed martial arts equipment market growth of industry companies

We can help! Our analysts can customize this mixed martial arts equipment market research report to meet your requirements.

Get in touch

1 Executive Summary

  • 1.1 Market overview
    • Executive Summary - Chart on Market Overview
    • Executive Summary - Data Table on Market Overview
    • Executive Summary - Chart on Global Market Characteristics
    • Executive Summary - Chart on Market by Geography
    • Executive Summary - Chart on Market Segmentation by Product
    • Executive Summary - Chart on Market Segmentation by Distribution Channel
    • Executive Summary - Chart on Market Segmentation by End-user
    • Executive Summary - Chart on Incremental Growth
    • Executive Summary - Data Table on Incremental Growth
    • Executive Summary - Chart on Company Market Positioning

2 Technavio Analysis

  • 2.1 Analysis of price sensitivity, lifecycle, customer purchase basket, adoption rates, and purchase criteria
    • Analysis of price sensitivity, lifecycle, customer purchase basket, adoption rates, and purchase criteria
  • 2.2 Criticality of inputs and Factors of differentiation
    • Overview on criticality of inputs and factors of differentiation
  • 2.3 Factors of disruption
    • Overview on factors of disruption
  • 2.4 Impact of drivers and challenges
    • Impact of drivers and challenges in 2024 and 2029

3 Market Landscape

  • 3.1 Market ecosystem
    • Parent Market
    • Data Table on - Parent Market
  • 3.2 Market characteristics
    • Market characteristics analysis
  • 3.3 Value chain analysis
    • Value chain analysis

4 Market Sizing

  • 4.1 Market definition
    • Offerings of companies included in the market definition
  • 4.2 Market segment analysis
    • Market segments
  • 4.3 Market size 2024
    • 4.4 Market outlook: Forecast for 2024-2029
      • Chart on Global - Market size and forecast 2024-2029 ($ million)
      • Data Table on Global - Market size and forecast 2024-2029 ($ million)
      • Chart on Global Market: Year-over-year growth 2024-2029 (%)
      • Data Table on Global Market: Year-over-year growth 2024-2029 (%)

    5 Historic Market Size

    • 5.1 Global Mixed Martial Arts Equipment Market 2019 - 2023
      • Historic Market Size - Data Table on Global Mixed Martial Arts Equipment Market 2019 - 2023 ($ million)
    • 5.2 Product segment analysis 2019 - 2023
      • Historic Market Size - Product Segment 2019 - 2023 ($ million)
    • 5.3 Distribution Channel segment analysis 2019 - 2023
      • Historic Market Size - Distribution Channel Segment 2019 - 2023 ($ million)
    • 5.4 End-user segment analysis 2019 - 2023
      • Historic Market Size - End-user Segment 2019 - 2023 ($ million)
    • 5.5 Geography segment analysis 2019 - 2023
      • Historic Market Size - Geography Segment 2019 - 2023 ($ million)
    • 5.6 Country segment analysis 2019 - 2023
      • Historic Market Size - Country Segment 2019 - 2023 ($ million)

    6 Qualitative Analysis

    • 6.1 The AI impact on global mixed martial arts equipment market

      7 Five Forces Analysis

      • 7.1 Five forces summary
        • Five forces analysis - Comparison between 2024 and 2029
      • 7.2 Bargaining power of buyers
        • Bargaining power of buyers - Impact of key factors 2024 and 2029
      • 7.3 Bargaining power of suppliers
        • Bargaining power of suppliers - Impact of key factors in 2024 and 2029
      • 7.4 Threat of new entrants
        • Threat of new entrants - Impact of key factors in 2024 and 2029
      • 7.5 Threat of substitutes
        • Threat of substitutes - Impact of key factors in 2024 and 2029
      • 7.6 Threat of rivalry
        • Threat of rivalry - Impact of key factors in 2024 and 2029
      • 7.7 Market condition
        • Chart on Market condition - Five forces 2024 and 2029

      8 Market Segmentation by Product

      • 8.1 Market segments
        • Chart on Product - Market share 2024-2029 (%)
        • Data Table on Product - Market share 2024-2029 (%)
      • 8.2 Comparison by Product
        • Chart on Comparison by Product
        • Data Table on Comparison by Product
      • 8.3 MMA gloves - Market size and forecast 2024-2029
        • Chart on MMA gloves - Market size and forecast 2024-2029 ($ million)
        • Data Table on MMA gloves - Market size and forecast 2024-2029 ($ million)
        • Chart on MMA gloves - Year-over-year growth 2024-2029 (%)
        • Data Table on MMA gloves - Year-over-year growth 2024-2029 (%)
      • 8.4 Protective gear - Market size and forecast 2024-2029
        • Chart on Protective gear - Market size and forecast 2024-2029 ($ million)
        • Data Table on Protective gear - Market size and forecast 2024-2029 ($ million)
        • Chart on Protective gear - Year-over-year growth 2024-2029 (%)
        • Data Table on Protective gear - Year-over-year growth 2024-2029 (%)
      • 8.5 Training equipment - Market size and forecast 2024-2029
        • Chart on Training equipment - Market size and forecast 2024-2029 ($ million)
        • Data Table on Training equipment - Market size and forecast 2024-2029 ($ million)
        • Chart on Training equipment - Year-over-year growth 2024-2029 (%)
        • Data Table on Training equipment - Year-over-year growth 2024-2029 (%)
      • 8.6 Market opportunity by Product
        • Market opportunity by Product ($ million)
        • Data Table on Market opportunity by Product ($ million)

      9 Market Segmentation by Distribution Channel

      • 9.1 Market segments
        • Chart on Distribution Channel - Market share 2024-2029 (%)
        • Data Table on Distribution Channel - Market share 2024-2029 (%)
      • 9.2 Comparison by Distribution Channel
        • Chart on Comparison by Distribution Channel
        • Data Table on Comparison by Distribution Channel
      • 9.3 Offline - Market size and forecast 2024-2029
        • Chart on Offline - Market size and forecast 2024-2029 ($ million)
        • Data Table on Offline - Market size and forecast 2024-2029 ($ million)
        • Chart on Offline - Year-over-year growth 2024-2029 (%)
        • Data Table on Offline - Year-over-year growth 2024-2029 (%)
      • 9.4 Online - Market size and forecast 2024-2029
        • Chart on Online - Market size and forecast 2024-2029 ($ million)
        • Data Table on Online - Market size and forecast 2024-2029 ($ million)
        • Chart on Online - Year-over-year growth 2024-2029 (%)
        • Data Table on Online - Year-over-year growth 2024-2029 (%)
      • 9.5 Market opportunity by Distribution Channel
        • Market opportunity by Distribution Channel ($ million)
        • Data Table on Market opportunity by Distribution Channel ($ million)

      10 Market Segmentation by End-user

      • 10.1 Market segments
        • Chart on End-user - Market share 2024-2029 (%)
        • Data Table on End-user - Market share 2024-2029 (%)
      • 10.2 Comparison by End-user
        • Chart on Comparison by End-user
        • Data Table on Comparison by End-user
      • 10.3 Individual - Market size and forecast 2024-2029
        • Chart on Individual - Market size and forecast 2024-2029 ($ million)
        • Data Table on Individual - Market size and forecast 2024-2029 ($ million)
        • Chart on Individual - Year-over-year growth 2024-2029 (%)
        • Data Table on Individual - Year-over-year growth 2024-2029 (%)
      • 10.4 Organization - Market size and forecast 2024-2029
        • Chart on Organization - Market size and forecast 2024-2029 ($ million)
        • Data Table on Organization - Market size and forecast 2024-2029 ($ million)
        • Chart on Organization - Year-over-year growth 2024-2029 (%)
        • Data Table on Organization - Year-over-year growth 2024-2029 (%)
      • 10.5 Market opportunity by End-user
        • Market opportunity by End-user ($ million)
        • Data Table on Market opportunity by End-user ($ million)

      11 Customer Landscape

      • 11.1 Customer landscape overview
        • Analysis of price sensitivity, lifecycle, customer purchase basket, adoption rates, and purchase criteria

      12 Geographic Landscape

      • 12.1 Geographic segmentation
        • Chart on Market share by geography 2024-2029 (%)
        • Data Table on Market share by geography 2024-2029 (%)
      • 12.2 Geographic comparison
        • Chart on Geographic comparison
        • Data Table on Geographic comparison
      • 12.3 North America - Market size and forecast 2024-2029
        • Chart on North America - Market size and forecast 2024-2029 ($ million)
        • Data Table on North America - Market size and forecast 2024-2029 ($ million)
        • Chart on North America - Year-over-year growth 2024-2029 (%)
        • Data Table on North America - Year-over-year growth 2024-2029 (%)
      • 12.4 Europe - Market size and forecast 2024-2029
        • Chart on Europe - Market size and forecast 2024-2029 ($ million)
        • Data Table on Europe - Market size and forecast 2024-2029 ($ million)
        • Chart on Europe - Year-over-year growth 2024-2029 (%)
        • Data Table on Europe - Year-over-year growth 2024-2029 (%)
      • 12.5 APAC - Market size and forecast 2024-2029
        • Chart on APAC - Market size and forecast 2024-2029 ($ million)
        • Data Table on APAC - Market size and forecast 2024-2029 ($ million)
        • Chart on APAC - Year-over-year growth 2024-2029 (%)
        • Data Table on APAC - Year-over-year growth 2024-2029 (%)
      • 12.6 South America - Market size and forecast 2024-2029
        • Chart on South America - Market size and forecast 2024-2029 ($ million)
        • Data Table on South America - Market size and forecast 2024-2029 ($ million)
        • Chart on South America - Year-over-year growth 2024-2029 (%)
        • Data Table on South America - Year-over-year growth 2024-2029 (%)
      • 12.7 Middle East and Africa - Market size and forecast 2024-2029
        • Chart on Middle East and Africa - Market size and forecast 2024-2029 ($ million)
        • Data Table on Middle East and Africa - Market size and forecast 2024-2029 ($ million)
        • Chart on Middle East and Africa - Year-over-year growth 2024-2029 (%)
        • Data Table on Middle East and Africa - Year-over-year growth 2024-2029 (%)
      • 12.8 US - Market size and forecast 2024-2029
        • Chart on US - Market size and forecast 2024-2029 ($ million)
        • Data Table on US - Market size and forecast 2024-2029 ($ million)
        • Chart on US - Year-over-year growth 2024-2029 (%)
        • Data Table on US - Year-over-year growth 2024-2029 (%)
      • 12.9 Canada - Market size and forecast 2024-2029
        • Chart on Canada - Market size and forecast 2024-2029 ($ million)
        • Data Table on Canada - Market size and forecast 2024-2029 ($ million)
        • Chart on Canada - Year-over-year growth 2024-2029 (%)
        • Data Table on Canada - Year-over-year growth 2024-2029 (%)
      • 12.10 Germany - Market size and forecast 2024-2029
        • Chart on Germany - Market size and forecast 2024-2029 ($ million)
        • Data Table on Germany - Market size and forecast 2024-2029 ($ million)
        • Chart on Germany - Year-over-year growth 2024-2029 (%)
        • Data Table on Germany - Year-over-year growth 2024-2029 (%)
      • 12.11 UK - Market size and forecast 2024-2029
        • Chart on UK - Market size and forecast 2024-2029 ($ million)
        • Data Table on UK - Market size and forecast 2024-2029 ($ million)
        • Chart on UK - Year-over-year growth 2024-2029 (%)
        • Data Table on UK - Year-over-year growth 2024-2029 (%)
      • 12.12 China - Market size and forecast 2024-2029
        • Chart on China - Market size and forecast 2024-2029 ($ million)
        • Data Table on China - Market size and forecast 2024-2029 ($ million)
        • Chart on China - Year-over-year growth 2024-2029 (%)
        • Data Table on China - Year-over-year growth 2024-2029 (%)
      • 12.13 France - Market size and forecast 2024-2029
        • Chart on France - Market size and forecast 2024-2029 ($ million)
        • Data Table on France - Market size and forecast 2024-2029 ($ million)
        • Chart on France - Year-over-year growth 2024-2029 (%)
        • Data Table on France - Year-over-year growth 2024-2029 (%)
      • 12.14 Italy - Market size and forecast 2024-2029
        • Chart on Italy - Market size and forecast 2024-2029 ($ million)
        • Data Table on Italy - Market size and forecast 2024-2029 ($ million)
        • Chart on Italy - Year-over-year growth 2024-2029 (%)
        • Data Table on Italy - Year-over-year growth 2024-2029 (%)
      • 12.15 Brazil - Market size and forecast 2024-2029
        • Chart on Brazil - Market size and forecast 2024-2029 ($ million)
        • Data Table on Brazil - Market size and forecast 2024-2029 ($ million)
        • Chart on Brazil - Year-over-year growth 2024-2029 (%)
        • Data Table on Brazil - Year-over-year growth 2024-2029 (%)
      • 12.16 Japan - Market size and forecast 2024-2029
        • Chart on Japan - Market size and forecast 2024-2029 ($ million)
        • Data Table on Japan - Market size and forecast 2024-2029 ($ million)
        • Chart on Japan - Year-over-year growth 2024-2029 (%)
        • Data Table on Japan - Year-over-year growth 2024-2029 (%)
      • 12.17 India - Market size and forecast 2024-2029
        • Chart on India - Market size and forecast 2024-2029 ($ million)
        • Data Table on India - Market size and forecast 2024-2029 ($ million)
        • Chart on India - Year-over-year growth 2024-2029 (%)
        • Data Table on India - Year-over-year growth 2024-2029 (%)
      • 12.18 Market opportunity by geography
        • Market opportunity by geography ($ million)
        • Data Tables on Market opportunity by geography ($ million)

      13 Drivers, Challenges, and Opportunity/Restraints

      • 13.1 Market drivers
        • 13.2 Market challenges
          • 13.3 Impact of drivers and challenges
            • Impact of drivers and challenges in 2024 and 2029
          • 13.4 Market opportunities/restraints

            14 Competitive Landscape

            • 14.1 Overview
              • 14.2 Competitive Landscape
                • Overview on criticality of inputs and factors of differentiation
              • 14.3 Landscape disruption
                • Overview on factors of disruption
              • 14.4 Industry risks
                • Impact of key risks on business

              15 Competitive Analysis

              • 15.1 Companies profiled
                • Companies covered
              • 15.2 Company ranking index
                • Company ranking index
              • 15.3 Market positioning of companies
                • Matrix on companies position and classification
              • 15.4 Adidas AG
                • Adidas AG - Overview
                • Adidas AG - Business segments
                • Adidas AG - Key news
                • Adidas AG - Key offerings
                • Adidas AG - Segment focus
                • SWOT
              • 15.5 Blitz Corp. Ltd.
                • Blitz Corp. Ltd. - Overview
                • Blitz Corp. Ltd. - Product / Service
                • Blitz Corp. Ltd. - Key offerings
                • SWOT
              • 15.6 Century LLC
                • Century LLC - Overview
                • Century LLC - Product / Service
                • Century LLC - Key offerings
                • SWOT
              • 15.7 Combat Brands LLC
                • Combat Brands LLC - Overview
                • Combat Brands LLC - Product / Service
                • Combat Brands LLC - Key offerings
                • SWOT
              • 15.8 FAIRTEX EQUIPMENT CO. LTD.
                • FAIRTEX EQUIPMENT CO. LTD. - Overview
                • FAIRTEX EQUIPMENT CO. LTD. - Product / Service
                • FAIRTEX EQUIPMENT CO. LTD. - Key offerings
                • SWOT
              • 15.9 Hayabusa Fightwear Inc.
                • Hayabusa Fightwear Inc. - Overview
                • Hayabusa Fightwear Inc. - Product / Service
                • Hayabusa Fightwear Inc. - Key offerings
                • SWOT
              • 15.10 King Martial Arts Supplies
                • King Martial Arts Supplies - Overview
                • King Martial Arts Supplies - Product / Service
                • King Martial Arts Supplies - Key offerings
                • SWOT
              • 15.11 KWON Inc.
                • KWON Inc. - Overview
                • KWON Inc. - Product / Service
                • KWON Inc. - Key offerings
                • SWOT
              • 15.12 MRX Products Inc.
                • MRX Products Inc. - Overview
                • MRX Products Inc. - Product / Service
                • MRX Products Inc. - Key offerings
                • SWOT
              • 15.13 Outslayer Fight Gear
                • Outslayer Fight Gear - Overview
                • Outslayer Fight Gear - Product / Service
                • Outslayer Fight Gear - Key offerings
                • SWOT
              • 15.14 Proforce Inc.
                • Proforce Inc. - Overview
                • Proforce Inc. - Product / Service
                • Proforce Inc. - Key offerings
                • SWOT
              • 15.15 RDX Inc.
                • RDX Inc. - Overview
                • RDX Inc. - Product / Service
                • RDX Inc. - Key offerings
                • SWOT
              • 15.16 Revgear Sports Co.
                • Revgear Sports Co. - Overview
                • Revgear Sports Co. - Product / Service
                • Revgear Sports Co. - Key offerings
                • SWOT
              • 15.17 TITLE Boxing
                • TITLE Boxing - Overview
                • TITLE Boxing - Product / Service
                • TITLE Boxing - Key offerings
                • SWOT
              • 15.18 Twins Special LLC
                • Twins Special LLC - Overview
                • Twins Special LLC - Product / Service
                • Twins Special LLC - Key offerings
                • SWOT

              16 Appendix

              • 16.1 Scope of the report
                • 16.2 Inclusions and exclusions checklist
                  • Inclusions checklist
                  • Exclusions checklist
                • 16.3 Currency conversion rates for US$
                  • Currency conversion rates for US$
                • 16.4 Research methodology
                  • Research methodology
                • 16.5 Data procurement
                  • Information sources
                • 16.6 Data validation
                  • Data validation
                • 16.7 Validation techniques employed for market sizing
                  • Validation techniques employed for market sizing
                • 16.8 Data synthesis
                  • Data synthesis
                • 16.9 360 degree market analysis
                  • 360 degree market analysis
                • 16.10 List of abbreviations
                  • List of abbreviations

                Research Methodology

                Technavio presents a detailed picture of the market by way of study, synthesis, and summation of data from multiple sources. The analysts have presented the various facets of the market with a particular focus on identifying the key industry influencers. The data thus presented is comprehensive, reliable, and the result of extensive research, both primary and secondary.

                INFORMATION SOURCES

                Primary sources

                • Manufacturers and suppliers
                • Channel partners
                • Industry experts
                • Strategic decision makers

                Secondary sources

                • Industry journals and periodicals
                • Government data
                • Financial reports of key industry players
                • Historical data
                • Press releases

                DATA ANALYSIS

                Data Synthesis

                • Collation of data
                • Estimation of key figures
                • Analysis of derived insights

                Data Validation

                • Triangulation with data models
                • Reference against proprietary databases
                • Corroboration with industry experts

                REPORT WRITING

                Qualitative

                • Market drivers
                • Market challenges
                • Market trends
                • Five forces analysis

                Quantitative

                • Market size and forecast
                • Market segmentation
                • Geographical insights
                • Competitive landscape

                Interested in this report?

                Get your sample now to see our research methodology and insights!

                Download Now

                Frequently Asked Questions

                Mixed Martial Arts Equipment market growth will increase by $ 277.6 mn during 2025-2029.

                The Mixed Martial Arts Equipment market is expected to grow at a CAGR of 4.8% during 2025-2029.

                Mixed Martial Arts Equipment market is segmented by Product( MMA gloves, Protective gear, Training equipment) Distribution Channel( Offline, Online) End-user( Individual, Organization, APAC, South America, MEA)

                Adidas AG, Blitz Corp. Ltd., Century LLC, Combat Brands LLC, FAIRTEX EQUIPMENT CO. LTD., Hayabusa Fightwear Inc., King Martial Arts Supplies, KWON Inc., MRX Products Inc., Outslayer Fight Gear, Proforce Inc., RDX Inc., Revgear Sports Co., SportsDirect.com Retail Ltd., Tiger Claw, TITLE Boxing, Twins Special LLC, Venum, Zebra Athletics are a few of the key vendors in the Mixed Martial Arts Equipment market.

                North America will register the highest growth rate of 40% among the other regions. Therefore, the Mixed Martial Arts Equipment market in North America is expected to garner significant business opportunities for the vendors during the forecast period.

                US, Canada, Germany, UK, France, Italy, China, Brazil, India, Japan

                • Growing popularity of women MMAAt present is the driving factor this market.
                • many women are participating in various sports is the driving factor this market.
                • such as MMA is the driving factor this market.
                • professionally as well as for recreational purposes. Several tournaments is the driving factor this market.
                • such as the UFC Women Featherweight Championship is the driving factor this market.
                • are conducted by various organizations to encourage the participation of women in sports. The female participation rate in MMA is increasing every year. The number of MMA championships for women is the driving factor this market.
                • such as the UFC Women Bantamweight Championship is the driving factor this market.
                • the UFC Women Flyweight Championship is the driving factor this market.
                • the UFC Women Featherweight Championship is the driving factor this market.
                • and the UFC Women Strawweight Championship is the driving factor this market.
                • is also increasing.MMA has been an exclusive sport for men. However is the driving factor this market.
                • the number of women participants has increased significantly in recent years. In 2023 is the driving factor this market.
                • there are more than 200 active women fighters in UFC. Women MMA is popular in various developed and developing countries. In UFC women championships is the driving factor this market.
                • women from several countries is the driving factor this market.
                • such as Russia is the driving factor this market.
                • the US is the driving factor this market.
                • Brazil is the driving factor this market.
                • Australia is the driving factor this market.
                • Mexico is the driving factor this market.
                • Poland is the driving factor this market.
                • Japan is the driving factor this market.
                • Canada is the driving factor this market.
                • Scotland is the driving factor this market.
                • the UK is the driving factor this market.
                • South Korea is the driving factor this market.
                • the Netherlands is the driving factor this market.
                • Sweden is the driving factor this market.
                • and China is the driving factor this market.
                • participate. The success of popular female MMA fighters encourages new women participants to adopt such combat sports.The participation of women in MMA championships and training sessions is increasing is the driving factor this market.
                • attributable to the popularity of MMA as a combat sport compared to other sports. A significant increase in payment and popularity is promoting the participation of women in MMA. With the increasing number of women joining MMA is the driving factor this market.
                • many sports organizers have started expanding the weight classes for women MMA. For instance is the driving factor this market.
                • the UFC has started four weight categories for women championships. The addition of new weight categories is likely to increase the participation of women in professional tournaments. Hence is the driving factor this market.
                • the growing participation of women in MMA is likely to increase the demand for MMA equipment which in turn will boost the growth of the global mixed martial arts equipment market during the forecast period. is the driving factor this market.

                The Mixed Martial Arts Equipment market vendors should focus on grabbing business opportunities from the MMA gloves segment as it accounted for the largest market share in the base year.