Rope Market Analysis, Size, and Forecast 2026-2030: APAC (China, India, and Japan), North America (US, Canada, and Mexico), Europe (Germany, UK, and France), Middle East and Africa (Saudi Arabia, UAE, and South Africa), South America (Brazil and Argentina), and Rest of World (ROW)

Rope Market Analysis, Size, and Forecast 2026-2030:
APAC (China, India, and Japan), North America (US, Canada, and Mexico), Europe (Germany, UK, and France), Middle East and Africa (Saudi Arabia, UAE, and South Africa), South America (Brazil and Argentina), and Rest of World (ROW)

Published: Mar 2026 285 Pages SKU: IRTNTR75750

Market Overview at a Glance

$4.80 B
Market Opportunity
5.6%
CAGR 2025 - 2030
48.3%
APAC Growth
$10.53 B
Steel wire segment 2024

Rope Market Size 2026-2030

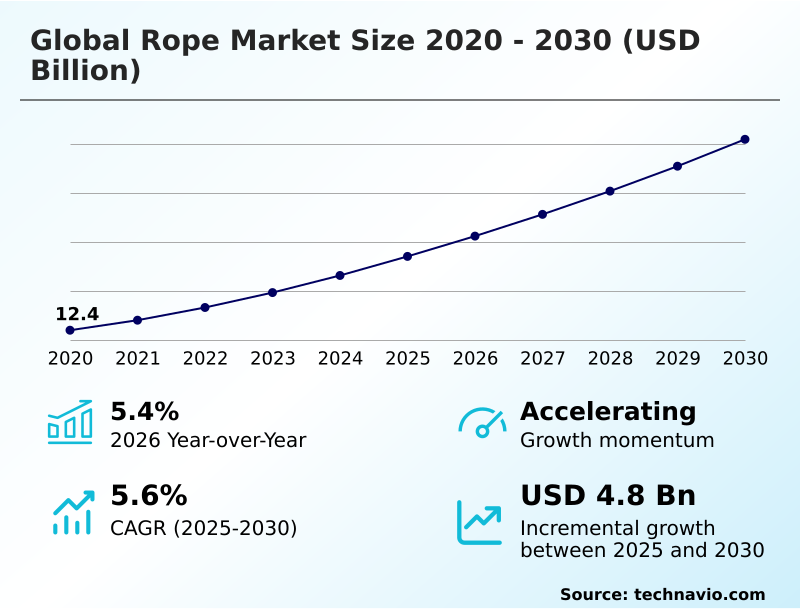
The rope market size is valued to increase by USD 4.80 billion, at a CAGR of 5.6% from 2025 to 2030. Accelerated expansion of renewable energy sector and offshore wind mooring systems will drive the rope market.

Major Market Trends & Insights

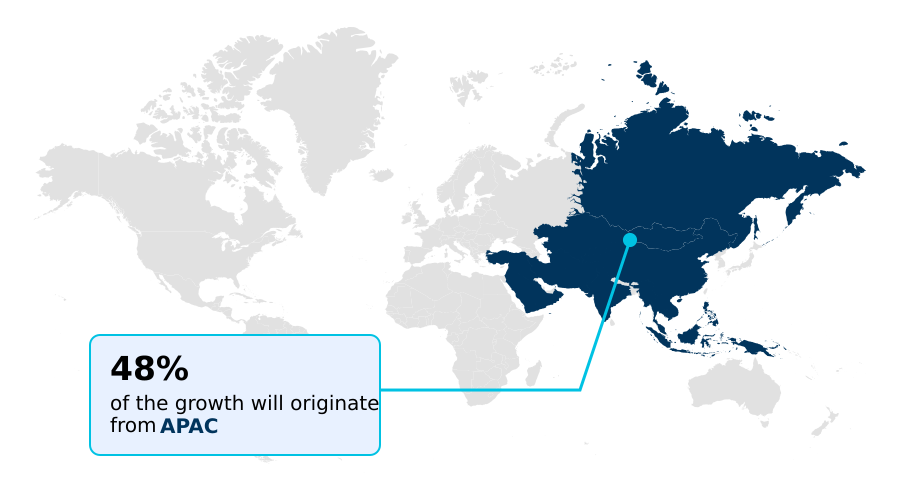
  • APAC dominated the market and accounted for a 48.3% growth during the forecast period.
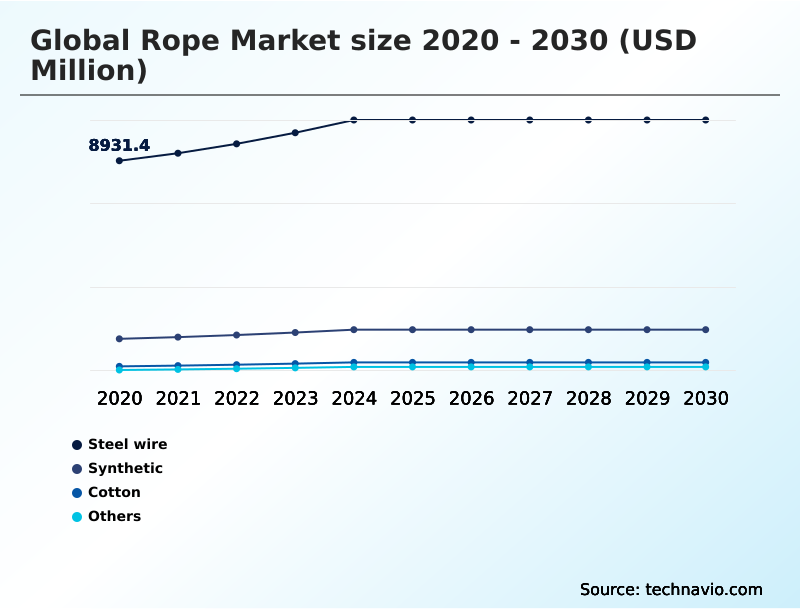
  • By Product - Steel wire segment was valued at USD 10.53 billion in 2024
  • By End-user - Industrial segment accounted for the largest market revenue share in 2024

Market Size & Forecast

  • Market Opportunities: USD 7.82 billion
  • Market Future Opportunities: USD 4.80 billion
  • CAGR from 2025 to 2030 : 5.6%

Market Summary

  • The rope market is undergoing a significant transformation, driven by the shift from traditional materials to advanced engineered fibers. This evolution is propelled by industrial demands for higher performance, safety, and operational efficiency across sectors such as maritime, construction, and renewable energy.
  • Synthetic ropes, including those made from high-performance polymers, offer a superior strength-to-weight ratio, enhanced durability, and resistance to environmental factors, making them critical for modern applications. The expansion of offshore wind farms, for instance, creates a specialized need for mooring lines that can withstand extreme oceanic conditions.
  • A project manager for a deep-sea energy platform must weigh the upfront cost of advanced synthetic fiber ropes against the long-term benefits of reduced maintenance, improved safety compliance, and longer lifecycle, which ultimately lowers the total cost of ownership. Concurrently, the industry grapples with challenges like raw material price volatility, which affects production costs and financial planning.
  • The integration of digital technologies, such as embedded sensors for real-time monitoring of rope integrity, represents a key innovation, enabling predictive maintenance and preventing catastrophic failures in high-stakes environments. This convergence of material science and digital innovation defines the future trajectory of the rope market.

What will be the Size of the Rope Market during the forecast period?

Get Key Insights on Market Forecast (PDF) Request Free Sample

How is the Rope Market Segmented?

The rope industry research report provides comprehensive data (region-wise segment analysis), with forecasts and estimates in "USD million" for the period 2026-2030, as well as historical data from 2020-2024 for the following segments.

  • Product
    • Steel wire
    • Synthetic
    • Cotton
    • Others
  • End-user
    • Industrial
    • Commercial
    • Residential
  • Distribution channel
    • Offline
    • Online
  • Geography
    • APAC
      • China
      • India
      • Japan
    • North America
      • US
      • Canada
      • Mexico
    • Europe
      • Germany
      • UK
      • France
    • Middle East and Africa
      • Saudi Arabia
      • UAE
      • South Africa
    • South America
      • Brazil
      • Argentina
    • Rest of World (ROW)

By Product Insights

The steel wire segment is estimated to witness significant growth during the forecast period.

The steel wire rope segment is fundamental to industries where extreme load-bearing capacity is non-negotiable. Comprising galvanized steel wire or stainless steel wound around a core, these products deliver superior abrasion resistance and structural integrity.

Key applications for a steel wire rope include industrial hoisting equipment, crane rope systems, and elevator hoist ropes in high-rise construction and port crane cables for maritime logistics.

Innovations focus on advanced polymer encapsulation and specialized coatings to enhance corrosion resistance, extending operational lifecycles in harsh environments. In mining excavation ropes, these products are indispensable for their durability.

The demand is driven by global infrastructure development and stringent safety standards that mandate rigorous rope performance testing, with advanced steel wire rope designs offering up to a 20% improvement in fatigue resistance under cyclical loading, ensuring reliability in critical construction lifting gear.

Request Free Sample

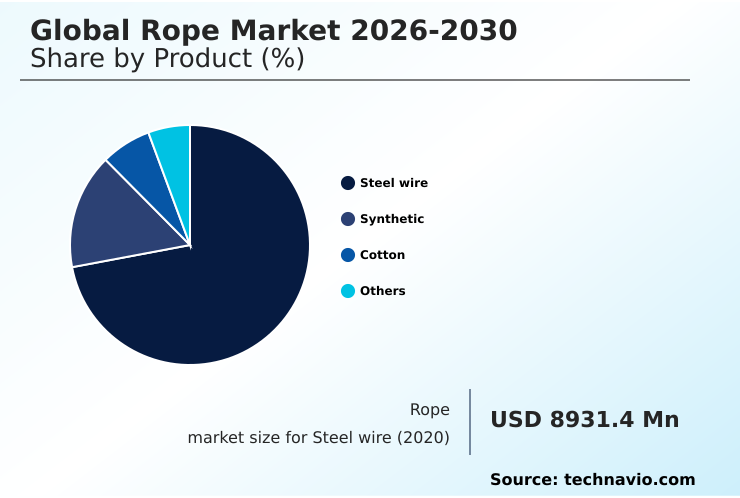
The Steel wire segment was valued at USD 10.53 billion in 2024 and showed a gradual increase during the forecast period.

Request Free Sample

Regional Analysis

APAC is estimated to contribute 48.3% to the growth of the global market during the forecast period.Technavio’s analysts have elaborately explained the regional trends and drivers that shape the market during the forecast period.

See How Rope Market Demand is Rising in APAC Request Free Sample

The geographic landscape of the rope market is characterized by varied regional growth dynamics, with APAC leading at a projected 6.1% growth rate, fueled by rapid industrialization and major infrastructure projects in China and India.

This region shows strong demand for synthetic fiber rope in maritime mooring solutions and rope for commercial fishing.

North America and Europe, with steady growth rates of 5.1% and 5.8% respectively, are driven by technological adoption and the retrofitting of existing infrastructure.

These markets are pioneering the use of high-modulus polyethylene in deep-water mooring systems and aramid fiber ropes for specialized applications. Demand for heavy-lift slings, industrial safety lines, and polypropylene ropes remains strong.

Emerging applications in aquaculture cage systems, towing and salvage ropes, and arboriculture rigging lines also contribute to market expansion globally, reflecting a diverse and evolving demand structure.

Market Dynamics

Our researchers analyzed the data with 2025 as the base year, along with the key drivers, trends, and challenges. A holistic analysis of drivers will help companies refine their marketing strategies to gain a competitive advantage.

  • Strategic decision-making in the global rope market 2026-2030 is increasingly complex, shaped by a confluence of technological, economic, and application-specific factors. The discussion comparing high-performance synthetic vs steel wire ropes is central, particularly for the global rope market 2026-2026 for offshore applications, where weight and corrosion are critical.
  • Advancements in smart rope sensor technology are revolutionizing maintenance, with industrial operators reporting that predictive asset management reduces equipment downtime by up to 40% compared to conventional inspection schedules. This technology is vital for the global rope market 2026-2030 for industrial use and the global rope market 2026-2030 for mining operations.
  • The global rope market 2026-2030 for renewable energy is a significant driver, with rope demand in deep-water energy projects escalating. Simultaneously, the impact of raw material costs on rope prices remains a persistent challenge across the global rope market 2026-2030 in construction sector and the global rope market 2026-2030 for maritime industry.
  • Companies are exploring sustainable and bio-based rope innovations and re-evaluating the lifecycle assessment of industrial rope products to mitigate the environmental impact of synthetic rope production.
  • Adherence to safety standards for industrial lifting ropes and best practices for rope maintenance and inspection are paramount, influencing both rope solutions for modern infrastructure projects and the global rope market 2026-2030 for specialty textiles.
  • The nuances between comparing braided and twisted rope performance and the overall technological advancements in rope manufacturing will continue to shape procurement strategies for synthetic rope use in commercial shipping.

What are the key market drivers leading to the rise in the adoption of Rope Industry?

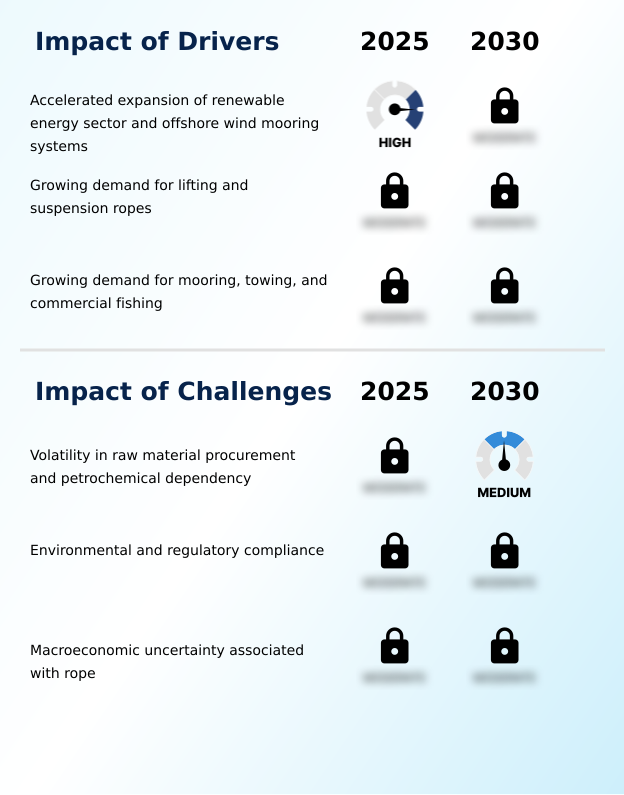
  • The accelerated expansion of the renewable energy sector, especially for offshore wind mooring systems, serves as a key market driver.

  • Market growth is significantly propelled by the specialized demands of the renewable energy and maritime sectors. The expansion of offshore wind necessitates advanced offshore tether solutions and subsea lifting applications with exceptional fatigue resistance and uv degradation resistance.
  • Advanced synthetic ropes used in these environments show a 30% longer service life compared to traditional alternatives. Innovations in high-performance fiber manufacturing and rope splicing techniques are critical for meeting these requirements.
  • In ports, effective rope lifecycle management is crucial, with new synthetic rope retirement criteria driving upgrades. The adoption of materials that support fiber rope circularity and the creation of bio-based plastic ropes are also gaining traction.
  • Furthermore, adherence to stringent rope inspection protocols can increase operational uptime by 15% by preventing premature failures in essential equipment such as port crane cables and elevator hoist ropes.

What are the market trends shaping the Rope Industry?

  • A primary market trend is the growing demand from the expanding construction and infrastructure sector worldwide, which creates sustained requirements for high-performance lifting and safety equipment.

  • Key trends in the rope market are driven by innovation in materials and manufacturing. The development of polyester ropes and nylon ropes with enhanced tensile strength and an optimized strength-to-weight ratio is expanding their use in demanding applications like alpine climbing ropes and industrial hoisting equipment.
  • For offshore wind mooring, new braided rope construction techniques are improving durability, with some advanced ropes demonstrating a 20% increase in abrasion resistance. In the construction lifting gear and mining excavation ropes segments, there is a growing focus on a product's entire lifecycle.
  • The adoption of sustainable practices, including the use of natural fiber ropes and bio-based materials, can reduce a product's carbon footprint by up to 30%. This shift aligns with evolving regulatory landscapes and corporate sustainability mandates across oil and gas drilling lines.

What challenges does the Rope Industry face during its growth?

  • Volatility in raw material procurement and a dependency on petrochemical feedstocks present a significant challenge to industry growth and price stability.

  • The primary challenge confronting the rope market is the significant raw material procurement volatility, particularly related to petrochemical polymer pricing. These fluctuations, which can shift by as much as 40% within a single fiscal quarter, create profound instability in production costs and hinder long-term financial planning, impacting everything from electromechanical cables to basic fibers.
  • This necessitates a focus on building greater rope supply chain resilience. Firms with diversified sourcing strategies report up to 25% fewer production delays. Ensuring structural integrity monitoring and adherence to regulatory compliance for lifting are also complex challenges, demanding rigorous rope performance testing and the adoption of technologies like embedded sensor monitoring.
  • Furthermore, manufacturers must navigate evolving workplace safety regulations while managing costs associated with recycled steel materials and specialized components like sacrificial zinc anodes.

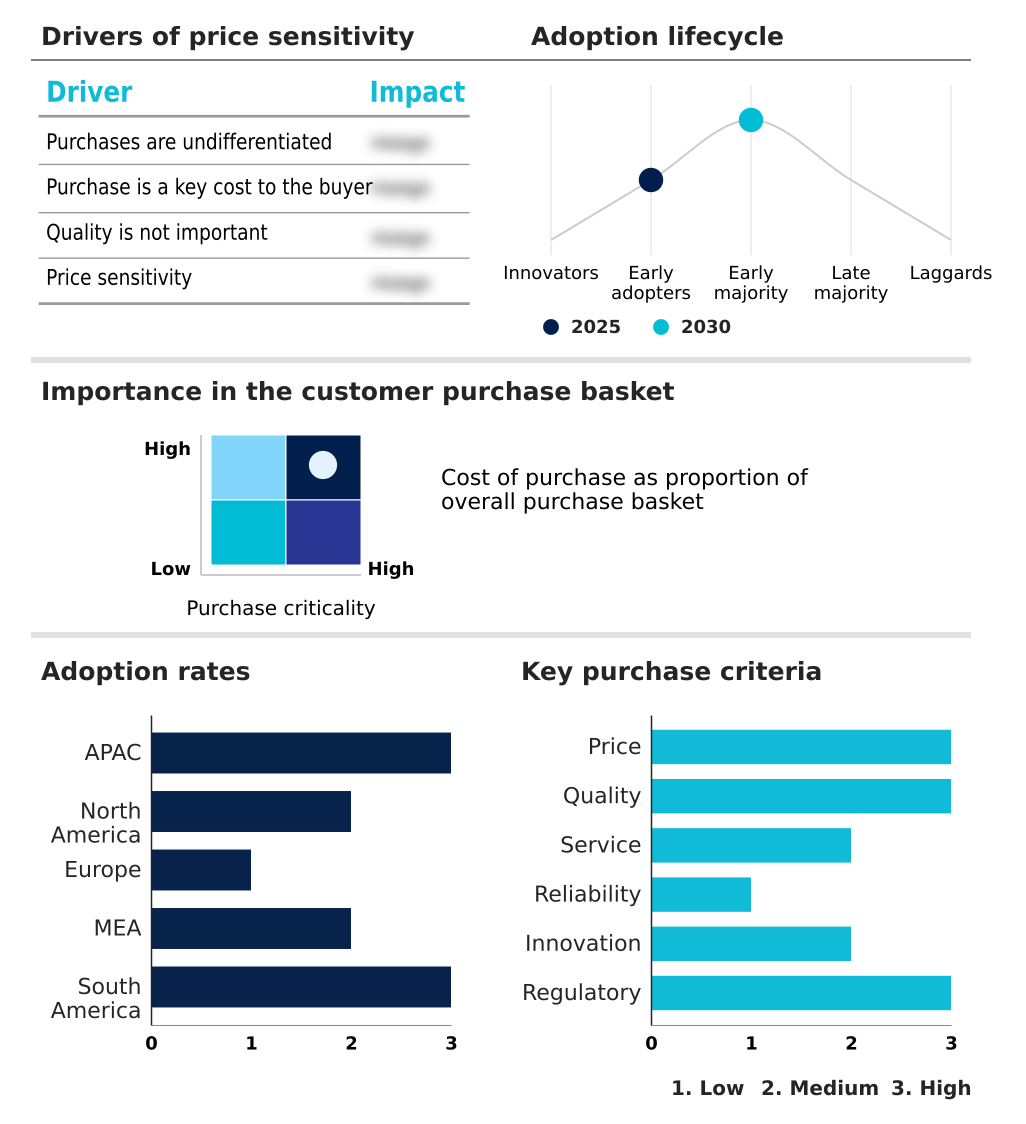
Exclusive Technavio Analysis on Customer Landscape

The rope market forecasting report includes the adoption lifecycle of the market, covering from the innovator’s stage to the laggard’s stage. It focuses on adoption rates in different regions based on penetration. Furthermore, the rope market report also includes key purchase criteria and drivers of price sensitivity to help companies evaluate and develop their market growth analysis strategies.

Customer Landscape of Rope Industry

Competitive Landscape

Companies are implementing various strategies, such as strategic alliances, rope market forecast, partnerships, mergers and acquisitions, geographical expansion, and product/service launches, to enhance their presence in the industry.

Cortland Ltd. - Market offerings include specialized synthetic and steel wire ropes, high-performance cables, and integrated systems engineered for demanding industrial, marine, and construction applications.

The industry research and growth report includes detailed analyses of the competitive landscape of the market and information about key companies, including:

  • Cortland Ltd.
  • CSR Braids
  • Donaghys Ltd.
  • English Braids Ltd.
  • Erin Rope Corp.
  • Gottifredi Maffioli Srl
  • Great Trango Holdings Inc.
  • Hampidjan Group
  • Katradis Marine Ropes Ind SA
  • Langman Ropes
  • Marlow Ropes Ltd.
  • Novatec Braids Ltd.
  • NV Bekaert SA
  • Samson Rope Technologies Inc.
  • Southern Ropes
  • Teufelberger Holding AG
  • Usha Martin Ltd.
  • Van Beelen Group BV
  • WireCo WorldGroup

Qualitative and quantitative analysis of companies has been conducted to help clients understand the wider business environment as well as the strengths and weaknesses of key industry players. Data is qualitatively analyzed to categorize companies as pure play, category-focused, industry-focused, and diversified; it is quantitatively analyzed to categorize companies as dominant, leading, strong, tentative, and weak.

Recent Development and News in Rope market

  • In February 2025, NV Bekaert SA agreed to sell its Steel Wire Solutions businesses in Costa Rica, Ecuador, and Venezuela to Grupo AG for approximately $73 million as part of a strategic portfolio transformation.
  • In November 2025, Samson Rope Technologies Inc. launched its CALIBRE line, a new high-performance rope solution specifically engineered to meet the increasing load demands of modern crane operations in the superyacht industry.
  • In February 2025, Hampidjan Group acquired a majority stake in India-based manufacturer Kohinoor Ropes to expand its production capacity and optimize its value chain for the fishing and aquaculture sectors.
  • In February 2026, Teufelberger Holding AG announced plans to exhibit its latest crane rope portfolio at CONEXPO-CON/AGG 2026, featuring advanced lifting solutions designed to improve lifecycle performance and address rising load demands.

Dive into Technavio’s robust research methodology, blending expert interviews, extensive data synthesis, and validated models for unparalleled Rope Market insights. See full methodology.

Market Scope
Page number 285
Base year 2025
Historic period 2020-2024
Forecast period 2026-2030
Growth momentum & CAGR Accelerate at a CAGR of 5.6%
Market growth 2026-2030 USD 4799.1 million
Market structure Fragmented
YoY growth 2025-2026(%) 5.4%
Key countries China, India, Japan, South Korea, Indonesia, Australia, US, Canada, Mexico, Germany, UK, France, Italy, Spain, Norway, Saudi Arabia, UAE, South Africa, Turkey, Egypt, Brazil, Argentina and Chile
Competitive landscape Leading Companies, Market Positioning of Companies, Competitive Strategies, and Industry Risks

Request Free Sample

Research Analyst Overview

  • The rope market is defined by continuous material science innovation and a pivot toward application-specific, high-performance solutions. The evolution from standard natural fiber ropes to advanced synthetic fiber rope, including high-modulus polyethylene and aramid fiber ropes, establishes a new performance benchmark.
  • This transition influences boardroom decisions regarding capital investment in long-life assets, where the superior strength-to-weight ratio and fatigue resistance of modern fibers are critical. Technologies such as polymer encapsulation are integral, extending the operational life of a steel wire rope by over 25% in corrosive environments by improving corrosion resistance.
  • The development of high-tenacity yarns, polypropylene ropes, and polyester ropes underpins this progress. Innovations in braided rope construction and twisted rope structure optimize tensile strength and load-bearing capacity for specialized equipment like crane rope systems and heavy-lift slings.
  • Furthermore, the integration of smart fiber technology with embedded sensor monitoring enables real-time structural integrity monitoring, a crucial factor for industrial safety lines and subsea lifting applications. This shift toward intelligent and durable materials like electromechanical cables and solutions with sacrificial zinc anodes is reshaping industry standards.

What are the Key Data Covered in this Rope Market Research and Growth Report?

  • What is the expected growth of the Rope Market between 2026 and 2030?

    • USD 4.80 billion, at a CAGR of 5.6%

  • What segmentation does the market report cover?

    • The report is segmented by Product (Steel wire, Synthetic, Cotton, and Others), End-user (Industrial, Commercial, and Residential), Distribution Channel (Offline, and Online) and Geography (APAC, North America, Europe, Middle East and Africa, South America)

  • Which regions are analyzed in the report?

    • APAC, North America, Europe, Middle East and Africa and South America

  • What are the key growth drivers and market challenges?

    • Accelerated expansion of renewable energy sector and offshore wind mooring systems, Volatility in raw material procurement and petrochemical dependency

  • Who are the major players in the Rope Market?

    • Cortland Ltd., CSR Braids, Donaghys Ltd., English Braids Ltd., Erin Rope Corp., Gottifredi Maffioli Srl, Great Trango Holdings Inc., Hampidjan Group, Katradis Marine Ropes Ind SA, Langman Ropes, Marlow Ropes Ltd., Novatec Braids Ltd., NV Bekaert SA, Samson Rope Technologies Inc., Southern Ropes, Teufelberger Holding AG, Usha Martin Ltd., Van Beelen Group BV and WireCo WorldGroup

Market Research Insights

  • The rope market's dynamics are shaped by a focus on application-specific engineering and lifecycle value. For instance, advanced polymer development for superyacht running rigging enhances performance, while improved rope lifecycle management for maritime mooring solutions is critical for port authorities. Innovations in rope performance testing support new synthetic rope retirement criteria, which can improve operational safety compliance by over 30%.
  • In industrial settings, the right construction lifting gear and industrial hoisting equipment are vital. Adherence to updated rope inspection protocols, enabled by smart technologies, reduces manual checks by up to 40%. Meanwhile, raw material procurement volatility and fluctuating petrochemical polymer pricing create significant planning challenges, making rope supply chain resilience a priority.
  • Firms are also focused on sustainable rope manufacturing and rope failure analysis to meet regulatory compliance for lifting and stringent workplace safety regulations across all applications.

We can help! Our analysts can customize this rope market research report to meet your requirements.

Get in touch

1. Executive Summary

1.1 Market overview

Executive Summary - Chart on Market Overview
Executive Summary - Data Table on Market Overview
Executive Summary - Chart on Global Market Characteristics
Executive Summary - Chart on Market by Geography
Executive Summary - Chart on Market Segmentation by Product
Executive Summary - Chart on Market Segmentation by End-user
Executive Summary - Chart on Market Segmentation by Distribution Channel
Executive Summary - Chart on Incremental Growth
Executive Summary - Data Table on Incremental Growth
Executive Summary - Chart on Company Market Positioning

2. Technavio Analysis

2.1 Analysis of price sensitivity, lifecycle, customer purchase basket, adoption rates, and purchase criteria

2.2 Criticality of inputs and Factors of differentiation

Chart on Overview on criticality of inputs and factors of differentiation

2.3 Factors of disruption

Chart on Overview on factors of disruption

2.4 Impact of drivers and challenges

Chart on Impact of drivers and challenges in 2025 and 2030

3. Market Landscape

3.1 Market ecosystem

Chart on Parent Market
Data Table on - Parent Market

3.2 Market characteristics

Chart on Market characteristics analysis

3.3 Value chain analysis

Chart on Value chain analysis

4. Market Sizing

4.1 Market definition

Data Table on Offerings of companies included in the market definition

4.2 Market segment analysis

Market segments

4.3 Market size 2025

4.4 Market outlook: Forecast for 2025-2030

Chart on Global - Market size and forecast 2025-2030 ($ million)
Data Table on Global - Market size and forecast 2025-2030 ($ million)
Chart on Global Market: Year-over-year growth 2025-2030 (%)
Data Table on Global Market: Year-over-year growth 2025-2030 (%)

5. Historic Market Size

5.1 Global Rope Market 2020 - 2024

Historic Market Size - Data Table on Global Rope Market 2020 - 2024 ($ million)

5.2 Product segment analysis 2020 - 2024

Historic Market Size - Product Segment 2020 - 2024 ($ million)

5.3 End-user segment analysis 2020 - 2024

Historic Market Size - End-user Segment 2020 - 2024 ($ million)

5.4 Distribution Channel segment analysis 2020 - 2024

Historic Market Size - Distribution Channel Segment 2020 - 2024 ($ million)

5.5 Geography segment analysis 2020 - 2024

Historic Market Size - Geography Segment 2020 - 2024 ($ million)

5.6 Country segment analysis 2020 - 2024

Historic Market Size - Country Segment 2020 - 2024 ($ million)

6. Qualitative Analysis

6.1 Impact of AI in Global Rope Market

6.2 Impact of Geopolitical Conflict for Global Rope Market

7. Five Forces Analysis

7.1 Five forces summary

Five forces analysis - Comparison between 2025 and 2030

7.2 Bargaining power of buyers

Bargaining power of buyers - Impact of key factors 2025 and 2030

7.3 Bargaining power of suppliers

Bargaining power of suppliers - Impact of key factors in 2025 and 2030

7.4 Threat of new entrants

Threat of new entrants - Impact of key factors in 2025 and 2030

7.5 Threat of substitutes

Threat of substitutes - Impact of key factors in 2025 and 2030

7.6 Threat of rivalry

Threat of rivalry - Impact of key factors in 2025 and 2030

7.7 Market condition

Chart on Market condition - Five forces 2025 and 2030

8. Market Segmentation by Product

8.1 Market segments

Chart on Product - Market share 2025-2030 (%)
Data Table on Product - Market share 2025-2030 (%)

8.2 Comparison by Product

Chart on Comparison by Product
Data Table on Comparison by Product

8.3 Steel wire - Market size and forecast 2025-2030

Chart on Steel wire - Market size and forecast 2025-2030 ($ million)
Data Table on Steel wire - Market size and forecast 2025-2030 ($ million)
Chart on Steel wire - Year-over-year growth 2025-2030 (%)
Data Table on Steel wire - Year-over-year growth 2025-2030 (%)

8.4 Synthetic - Market size and forecast 2025-2030

Chart on Synthetic - Market size and forecast 2025-2030 ($ million)
Data Table on Synthetic - Market size and forecast 2025-2030 ($ million)
Chart on Synthetic - Year-over-year growth 2025-2030 (%)
Data Table on Synthetic - Year-over-year growth 2025-2030 (%)

8.5 Cotton - Market size and forecast 2025-2030

Chart on Cotton - Market size and forecast 2025-2030 ($ million)
Data Table on Cotton - Market size and forecast 2025-2030 ($ million)
Chart on Cotton - Year-over-year growth 2025-2030 (%)
Data Table on Cotton - Year-over-year growth 2025-2030 (%)

8.6 Others - Market size and forecast 2025-2030

Chart on Others - Market size and forecast 2025-2030 ($ million)
Data Table on Others - Market size and forecast 2025-2030 ($ million)
Chart on Others - Year-over-year growth 2025-2030 (%)
Data Table on Others - Year-over-year growth 2025-2030 (%)

8.7 Market opportunity by Product

Market opportunity by Product ($ million)
Data Table on Market opportunity by Product ($ million)

9. Market Segmentation by End-user

9.1 Market segments

Chart on End-user - Market share 2025-2030 (%)
Data Table on End-user - Market share 2025-2030 (%)

9.2 Comparison by End-user

Chart on Comparison by End-user
Data Table on Comparison by End-user

9.3 Industrial - Market size and forecast 2025-2030

Chart on Industrial - Market size and forecast 2025-2030 ($ million)
Data Table on Industrial - Market size and forecast 2025-2030 ($ million)
Chart on Industrial - Year-over-year growth 2025-2030 (%)
Data Table on Industrial - Year-over-year growth 2025-2030 (%)

9.4 Commercial - Market size and forecast 2025-2030

Chart on Commercial - Market size and forecast 2025-2030 ($ million)
Data Table on Commercial - Market size and forecast 2025-2030 ($ million)
Chart on Commercial - Year-over-year growth 2025-2030 (%)
Data Table on Commercial - Year-over-year growth 2025-2030 (%)

9.5 Residential - Market size and forecast 2025-2030

Chart on Residential - Market size and forecast 2025-2030 ($ million)
Data Table on Residential - Market size and forecast 2025-2030 ($ million)
Chart on Residential - Year-over-year growth 2025-2030 (%)
Data Table on Residential - Year-over-year growth 2025-2030 (%)

9.6 Market opportunity by End-user

Market opportunity by End-user ($ million)
Data Table on Market opportunity by End-user ($ million)

10. Market Segmentation by Distribution Channel

10.1 Market segments

Chart on Distribution Channel - Market share 2025-2030 (%)
Data Table on Distribution Channel - Market share 2025-2030 (%)

10.2 Comparison by Distribution Channel

Chart on Comparison by Distribution Channel
Data Table on Comparison by Distribution Channel

10.3 Offline - Market size and forecast 2025-2030

Chart on Offline - Market size and forecast 2025-2030 ($ million)
Data Table on Offline - Market size and forecast 2025-2030 ($ million)
Chart on Offline - Year-over-year growth 2025-2030 (%)
Data Table on Offline - Year-over-year growth 2025-2030 (%)

10.4 Online - Market size and forecast 2025-2030

Chart on Online - Market size and forecast 2025-2030 ($ million)
Data Table on Online - Market size and forecast 2025-2030 ($ million)
Chart on Online - Year-over-year growth 2025-2030 (%)
Data Table on Online - Year-over-year growth 2025-2030 (%)

10.5 Market opportunity by Distribution Channel

Market opportunity by Distribution Channel ($ million)
Data Table on Market opportunity by Distribution Channel ($ million)

11. Customer Landscape

11.1 Customer landscape overview

Analysis of price sensitivity, lifecycle, customer purchase basket, adoption rates, and purchase criteria

12. Geographic Landscape

12.1 Geographic segmentation

Chart on Market share by geography 2025-2030 (%)
Data Table on Market share by geography 2025-2030 (%)

12.2 Geographic comparison

Chart on Geographic comparison
Data Table on Geographic comparison

12.3 APAC - Market size and forecast 2025-2030

Chart on APAC - Market size and forecast 2025-2030 ($ million)
Data Table on APAC - Market size and forecast 2025-2030 ($ million)
Chart on APAC - Year-over-year growth 2025-2030 (%)
Data Table on APAC - Year-over-year growth 2025-2030 (%)
Chart on Regional Comparison - APAC
Data Table on Regional Comparison - APAC

12.3.1 China - Market size and forecast 2025-2030

Chart on China - Market size and forecast 2025-2030 ($ million)
Data Table on China - Market size and forecast 2025-2030 ($ million)
Chart on China - Year-over-year growth 2025-2030 (%)
Data Table on China - Year-over-year growth 2025-2030 (%)

12.3.2 India - Market size and forecast 2025-2030

Chart on India - Market size and forecast 2025-2030 ($ million)
Data Table on India - Market size and forecast 2025-2030 ($ million)
Chart on India - Year-over-year growth 2025-2030 (%)
Data Table on India - Year-over-year growth 2025-2030 (%)

12.3.3 Japan - Market size and forecast 2025-2030

Chart on Japan - Market size and forecast 2025-2030 ($ million)
Data Table on Japan - Market size and forecast 2025-2030 ($ million)
Chart on Japan - Year-over-year growth 2025-2030 (%)
Data Table on Japan - Year-over-year growth 2025-2030 (%)

12.3.4 South Korea - Market size and forecast 2025-2030

Chart on South Korea - Market size and forecast 2025-2030 ($ million)
Data Table on South Korea - Market size and forecast 2025-2030 ($ million)
Chart on South Korea - Year-over-year growth 2025-2030 (%)
Data Table on South Korea - Year-over-year growth 2025-2030 (%)

12.3.5 Indonesia - Market size and forecast 2025-2030

Chart on Indonesia - Market size and forecast 2025-2030 ($ million)
Data Table on Indonesia - Market size and forecast 2025-2030 ($ million)
Chart on Indonesia - Year-over-year growth 2025-2030 (%)
Data Table on Indonesia - Year-over-year growth 2025-2030 (%)

12.3.6 Australia - Market size and forecast 2025-2030

Chart on Australia - Market size and forecast 2025-2030 ($ million)
Data Table on Australia - Market size and forecast 2025-2030 ($ million)
Chart on Australia - Year-over-year growth 2025-2030 (%)
Data Table on Australia - Year-over-year growth 2025-2030 (%)

12.4 North America - Market size and forecast 2025-2030

Chart on North America - Market size and forecast 2025-2030 ($ million)
Data Table on North America - Market size and forecast 2025-2030 ($ million)
Chart on North America - Year-over-year growth 2025-2030 (%)
Data Table on North America - Year-over-year growth 2025-2030 (%)
Chart on Regional Comparison - North America
Data Table on Regional Comparison - North America

12.4.1 US - Market size and forecast 2025-2030

Chart on US - Market size and forecast 2025-2030 ($ million)
Data Table on US - Market size and forecast 2025-2030 ($ million)
Chart on US - Year-over-year growth 2025-2030 (%)
Data Table on US - Year-over-year growth 2025-2030 (%)

12.4.2 Canada - Market size and forecast 2025-2030

Chart on Canada - Market size and forecast 2025-2030 ($ million)
Data Table on Canada - Market size and forecast 2025-2030 ($ million)
Chart on Canada - Year-over-year growth 2025-2030 (%)
Data Table on Canada - Year-over-year growth 2025-2030 (%)

12.4.3 Mexico - Market size and forecast 2025-2030

Chart on Mexico - Market size and forecast 2025-2030 ($ million)
Data Table on Mexico - Market size and forecast 2025-2030 ($ million)
Chart on Mexico - Year-over-year growth 2025-2030 (%)
Data Table on Mexico - Year-over-year growth 2025-2030 (%)

12.5 Europe - Market size and forecast 2025-2030

Chart on Europe - Market size and forecast 2025-2030 ($ million)
Data Table on Europe - Market size and forecast 2025-2030 ($ million)
Chart on Europe - Year-over-year growth 2025-2030 (%)
Data Table on Europe - Year-over-year growth 2025-2030 (%)
Chart on Regional Comparison - Europe
Data Table on Regional Comparison - Europe

12.5.1 Germany - Market size and forecast 2025-2030

Chart on Germany - Market size and forecast 2025-2030 ($ million)
Data Table on Germany - Market size and forecast 2025-2030 ($ million)
Chart on Germany - Year-over-year growth 2025-2030 (%)
Data Table on Germany - Year-over-year growth 2025-2030 (%)

12.5.2 UK - Market size and forecast 2025-2030

Chart on UK - Market size and forecast 2025-2030 ($ million)
Data Table on UK - Market size and forecast 2025-2030 ($ million)
Chart on UK - Year-over-year growth 2025-2030 (%)
Data Table on UK - Year-over-year growth 2025-2030 (%)

12.5.3 France - Market size and forecast 2025-2030

Chart on France - Market size and forecast 2025-2030 ($ million)
Data Table on France - Market size and forecast 2025-2030 ($ million)
Chart on France - Year-over-year growth 2025-2030 (%)
Data Table on France - Year-over-year growth 2025-2030 (%)

12.5.4 Italy - Market size and forecast 2025-2030

Chart on Italy - Market size and forecast 2025-2030 ($ million)
Data Table on Italy - Market size and forecast 2025-2030 ($ million)
Chart on Italy - Year-over-year growth 2025-2030 (%)
Data Table on Italy - Year-over-year growth 2025-2030 (%)

12.5.5 Spain - Market size and forecast 2025-2030

Chart on Spain - Market size and forecast 2025-2030 ($ million)
Data Table on Spain - Market size and forecast 2025-2030 ($ million)
Chart on Spain - Year-over-year growth 2025-2030 (%)
Data Table on Spain - Year-over-year growth 2025-2030 (%)

12.5.6 Norway - Market size and forecast 2025-2030

Chart on Norway - Market size and forecast 2025-2030 ($ million)
Data Table on Norway - Market size and forecast 2025-2030 ($ million)
Chart on Norway - Year-over-year growth 2025-2030 (%)
Data Table on Norway - Year-over-year growth 2025-2030 (%)

12.6 Middle East and Africa - Market size and forecast 2025-2030

Chart on Middle East and Africa - Market size and forecast 2025-2030 ($ million)
Data Table on Middle East and Africa - Market size and forecast 2025-2030 ($ million)
Chart on Middle East and Africa - Year-over-year growth 2025-2030 (%)
Data Table on Middle East and Africa - Year-over-year growth 2025-2030 (%)
Chart on Regional Comparison - Middle East and Africa
Data Table on Regional Comparison - Middle East and Africa

12.6.1 Saudi Arabia - Market size and forecast 2025-2030

Chart on Saudi Arabia - Market size and forecast 2025-2030 ($ million)
Data Table on Saudi Arabia - Market size and forecast 2025-2030 ($ million)
Chart on Saudi Arabia - Year-over-year growth 2025-2030 (%)
Data Table on Saudi Arabia - Year-over-year growth 2025-2030 (%)

12.6.2 UAE - Market size and forecast 2025-2030

Chart on UAE - Market size and forecast 2025-2030 ($ million)
Data Table on UAE - Market size and forecast 2025-2030 ($ million)
Chart on UAE - Year-over-year growth 2025-2030 (%)
Data Table on UAE - Year-over-year growth 2025-2030 (%)

12.6.3 South Africa - Market size and forecast 2025-2030

Chart on South Africa - Market size and forecast 2025-2030 ($ million)
Data Table on South Africa - Market size and forecast 2025-2030 ($ million)
Chart on South Africa - Year-over-year growth 2025-2030 (%)
Data Table on South Africa - Year-over-year growth 2025-2030 (%)

12.6.4 Turkey - Market size and forecast 2025-2030

Chart on Turkey - Market size and forecast 2025-2030 ($ million)
Data Table on Turkey - Market size and forecast 2025-2030 ($ million)
Chart on Turkey - Year-over-year growth 2025-2030 (%)
Data Table on Turkey - Year-over-year growth 2025-2030 (%)

12.6.5 Egypt - Market size and forecast 2025-2030

Chart on Egypt - Market size and forecast 2025-2030 ($ million)
Data Table on Egypt - Market size and forecast 2025-2030 ($ million)
Chart on Egypt - Year-over-year growth 2025-2030 (%)
Data Table on Egypt - Year-over-year growth 2025-2030 (%)

12.7 South America - Market size and forecast 2025-2030

Chart on South America - Market size and forecast 2025-2030 ($ million)
Data Table on South America - Market size and forecast 2025-2030 ($ million)
Chart on South America - Year-over-year growth 2025-2030 (%)
Data Table on South America - Year-over-year growth 2025-2030 (%)
Chart on Regional Comparison - South America
Data Table on Regional Comparison - South America

12.7.1 Brazil - Market size and forecast 2025-2030

Chart on Brazil - Market size and forecast 2025-2030 ($ million)
Data Table on Brazil - Market size and forecast 2025-2030 ($ million)
Chart on Brazil - Year-over-year growth 2025-2030 (%)
Data Table on Brazil - Year-over-year growth 2025-2030 (%)

12.7.2 Argentina - Market size and forecast 2025-2030

Chart on Argentina - Market size and forecast 2025-2030 ($ million)
Data Table on Argentina - Market size and forecast 2025-2030 ($ million)
Chart on Argentina - Year-over-year growth 2025-2030 (%)
Data Table on Argentina - Year-over-year growth 2025-2030 (%)

12.7.3 Chile - Market size and forecast 2025-2030

Chart on Chile - Market size and forecast 2025-2030 ($ million)
Data Table on Chile - Market size and forecast 2025-2030 ($ million)
Chart on Chile - Year-over-year growth 2025-2030 (%)
Data Table on Chile - Year-over-year growth 2025-2030 (%)

12.8 Market opportunity by geography

Market opportunity by geography ($ million)
Data Tables on Market opportunity by geography ($ million)

13. Drivers, Challenges, and Opportunity

13.1 Market drivers

Accelerated expansion of renewable energy sector and offshore wind mooring systems
Growing demand for lifting and suspension ropes
Growing demand for mooring, towing, and commercial fishing

13.2 Market challenges

Volatility in raw material procurement and petrochemical dependency
Environmental and regulatory compliance
Macroeconomic uncertainty associated with rope

13.3 Impact of drivers and challenges

Impact of drivers and challenges in 2025 and 2030

13.4 Market opportunities

Growing demand from expanding construction and infrastructure sector
Growing focus on usage of recycled materials for steel ropes and producing bio-based plastic ropes
Technological advancements in manufacturing

14. Competitive Landscape

14.1 Overview

14.2

Overview on criticality of inputs and factors of differentiation

14.3 Landscape disruption

Overview on factors of disruption

14.4 Industry risks

Impact of key risks on business

15. Competitive Analysis

15.1 Companies profiled

Companies covered

15.2 Company ranking index

15.3 Market positioning of companies

Matrix on companies position and classification

15.4 Cortland Ltd.

Cortland Ltd. - Overview
Cortland Ltd. - Product / Service
Cortland Ltd. - Key offerings
SWOT

15.5 CSR Braids

CSR Braids - Overview
CSR Braids - Product / Service
CSR Braids - Key offerings
SWOT

15.6 Donaghys Ltd.

Donaghys Ltd. - Overview
Donaghys Ltd. - Product / Service
Donaghys Ltd. - Key offerings
SWOT

15.7 English Braids Ltd.

English Braids Ltd. - Overview
English Braids Ltd. - Product / Service
English Braids Ltd. - Key offerings
SWOT

15.8 Gottifredi Maffioli Srl

Gottifredi Maffioli Srl - Overview
Gottifredi Maffioli Srl - Product / Service
Gottifredi Maffioli Srl - Key offerings
SWOT

15.9 Hampidjan Group

Hampidjan Group - Overview
Hampidjan Group - Business segments
Hampidjan Group - Key offerings
Hampidjan Group - Segment focus
SWOT

15.10 Katradis Marine Ropes Ind SA

Katradis Marine Ropes Ind SA - Overview
Katradis Marine Ropes Ind SA - Product / Service
Katradis Marine Ropes Ind SA - Key offerings
SWOT

15.11 Langman Ropes

Langman Ropes - Overview
Langman Ropes - Product / Service
Langman Ropes - Key offerings
SWOT

15.12 Marlow Ropes Ltd.

Marlow Ropes Ltd. - Overview
Marlow Ropes Ltd. - Product / Service
Marlow Ropes Ltd. - Key offerings
SWOT

15.13 Novatec Braids Ltd.

Novatec Braids Ltd. - Overview
Novatec Braids Ltd. - Product / Service
Novatec Braids Ltd. - Key offerings
SWOT

15.14 NV Bekaert SA

NV Bekaert SA - Overview
NV Bekaert SA - Business segments
NV Bekaert SA - Key news
NV Bekaert SA - Key offerings
NV Bekaert SA - Segment focus
SWOT

15.15 Samson Rope Technologies Inc.

Samson Rope Technologies Inc. - Overview
Samson Rope Technologies Inc. - Product / Service
Samson Rope Technologies Inc. - Key offerings
SWOT

15.16 Southern Ropes

Southern Ropes - Overview
Southern Ropes - Product / Service
Southern Ropes - Key offerings
SWOT

15.17 Teufelberger Holding AG

Teufelberger Holding AG - Overview
Teufelberger Holding AG - Product / Service
Teufelberger Holding AG - Key offerings
SWOT

15.18 WireCo WorldGroup

WireCo WorldGroup - Overview
WireCo WorldGroup - Product / Service
WireCo WorldGroup - Key offerings
SWOT

16. Appendix

16.1 Scope of the report

Market definition
Objectives
Notes and caveats

16.2 Inclusions and exclusions checklist

Inclusions checklist
Exclusions checklist

16.3 Currency conversion rates for US$

16.4 Research methodology

16.5 Data procurement

Information sources

16.6 Data validation

16.7 Validation techniques employed for market sizing

16.8 Data synthesis

16.9 360 degree market analysis

16.10 List of abbreviations

Research Methodology

Technavio presents a detailed picture of the market by way of study, synthesis, and summation of data from multiple sources. The analysts have presented the various facets of the market with a particular focus on identifying the key industry influencers. The data thus presented is comprehensive, reliable, and the result of extensive research, both primary and secondary.

INFORMATION SOURCES

Primary sources

  • Manufacturers and suppliers
  • Channel partners
  • Industry experts
  • Strategic decision makers

Secondary sources

  • Industry journals and periodicals
  • Government data
  • Financial reports of key industry players
  • Historical data
  • Press releases

DATA ANALYSIS

Data Synthesis

  • Collation of data
  • Estimation of key figures
  • Analysis of derived insights

Data Validation

  • Triangulation with data models
  • Reference against proprietary databases
  • Corroboration with industry experts

REPORT WRITING

Qualitative

  • Market drivers
  • Market challenges
  • Market trends
  • Five forces analysis

Quantitative

  • Market size and forecast
  • Market segmentation
  • Geographical insights
  • Competitive landscape

Interested in this report?

Get your sample now to see our research methodology and insights!

Download Now

Frequently Asked Questions

Rope market growth will increase by USD 4799.1 million during 2026-2030.

The Rope market is expected to grow at a CAGR of 5.6% during 2026-2030.

Rope market is segmented by Product (Steel wire, Synthetic, Cotton, Others) End-user (Industrial, Commercial, Residential) Distribution channel (Offline, Online)

Cortland Ltd., CSR Braids, Donaghys Ltd., English Braids Ltd., Erin Rope Corp., Gottifredi Maffioli Srl, Great Trango Holdings Inc., Hampidjan Group, Katradis Marine Ropes Ind SA, Langman Ropes, Marlow Ropes Ltd., Novatec Braids Ltd., NV Bekaert SA, Samson Rope Technologies Inc., Southern Ropes, Teufelberger Holding AG, Usha Martin Ltd., Van Beelen Group BV, WireCo WorldGroup are a few of the key vendors in the Rope market.

APAC will register the highest growth rate of 48.3% among the other regions. Therefore, the Rope market in APAC is expected to garner significant business opportunities for the vendors during the forecast period.

China, India, Japan, South Korea, Indonesia, Australia, US, Canada, Mexico, Germany, UK, France, Italy, Spain, Norway, Saudi Arabia, UAE, South Africa, Turkey, Egypt, Brazil, Argentina, Chile

  • Accelerated expansion of renewable energy sector and offshore wind mooring systems is the driving factor this market.

The Rope market vendors should focus on grabbing business opportunities from the Product segment as it accounted for the largest market share in the base year.
RIA - Research AI Assistant
Ask RIA