
Football Market Size 2025-2029
The football market size is valued to increase by USD 580.9 million, at a CAGR of 3.3% from 2024 to 2029. Increase in football events at global and national levels will drive the football market.
Major Market Trends & Insights
- Europe dominated the market and accounted for a 42% growth during the forecast period.
- By Distribution Channel - Offline segment was valued at USD 2780.80 million in 2023
- By Type - Training ball segment accounted for the largest market revenue share in 2023
Market Size & Forecast
- Market Opportunities: USD 25.93 million
- Market Future Opportunities: USD 580.90 million
- CAGR from 2024 to 2029 : 3.3%
Market Summary
- The market is experiencing significant growth and transformation, driven by an increase in global and national football events and the rising adoption of sustainable and eco-friendly football raw materials. The popularity of football as a sport continues to soar, leading to a surge in demand for high-quality football equipment and infrastructure. Moreover, the trend towards virtual games and esports among the younger generation is also impacting the market. According to recent studies, the number of esports viewers worldwide is projected to reach 500 million by 2022, presenting a lucrative opportunity for companies to tap into this emerging market.
- One real-world business scenario that highlights the importance of the market is supply chain optimization. With the increasing demand for football equipment, companies are under pressure to ensure efficient and timely delivery of their products. For instance, a leading sports equipment manufacturer was able to reduce its lead time by 15% by implementing a more streamlined supply chain process, resulting in significant cost savings and improved customer satisfaction. Additionally, there is a growing focus on compliance and operational efficiency in the market. With stricter regulations regarding the use of sustainable materials and labor practices, companies are investing in technology and processes to ensure compliance and maintain a competitive edge.
- For example, a leading football apparel manufacturer was able to reduce error rates by 20% through the implementation of automated quality control processes, leading to increased efficiency and cost savings.
What will be the Size of the Football Market during the forecast period?

Get Key Insights on Market Forecast (PDF) Request Free Sample
How is the Football Market Segmented ?
The football industry research report provides comprehensive data (region-wise segment analysis), with forecasts and estimates in "USD million" for the period 2025-2029, as well as historical data from 2019-2023 for the following segments.
- Distribution Channel
- Offline
- Online
- Type
- Training ball
- Match ball
- Others
- Product Type
- Football equipment
- Apparel
- Accessories
- End-User
- Professional
- Amateur
- Recreational
- Material
- Leather
- Synthetic Leather
- Rubber
- Polyurethane
- Geography
- North America
- US
- Canada
- Europe
- France
- Germany
- Italy
- UK
- Middle East and Africa
- Egypt
- KSA
- Oman
- UAE
- APAC
- China
- India
- Japan
- South America
- Argentina
- Brazil
- Rest of World (ROW)
- North America
By Distribution Channel Insights
The offline segment is estimated to witness significant growth during the forecast period.
The market continues to evolve, with ongoing activities shaping its dynamics. In the transfer market, clubs engage in strategic negotiations to secure top talent, with player performance analytics and injury risk assessment playing crucial roles. Tactical formation analysis and game strategy optimization are key areas of focus for coaching staff, with mental toughness training and leadership development programs also prioritized. Sponsorship acquisition and merchandising sales bring significant revenue, with Adidas AG and Nike Inc. Leading the way in brand partnerships. Retail sales remain strong, with 70% of consumers preferring physical stores for purchasing footballs and related equipment. Specialty stores, supermarkets, and hypermarkets cater to this demand, offering a range of products from local and international brands.
Consumers value the opportunity to examine products in person and appreciate the convenience of purchasing footballs alongside apparel and accessories. Youth player development and technical skill development are essential components of team cohesion strategies, with tactical awareness training and injury prevention programs ensuring optimal performance. Broadcast media deals and ticket sales management contribute to revenue generation models, while stadium infrastructure and training load management are crucial for maintaining team fitness. Passing accuracy metrics and set piece effectiveness are essential elements of ball possession strategies, with coaching staff evaluation and opponent scouting reports informing team tactics. Performance tracking systems and player fitness monitoring provide valuable data for sports nutrition planning and contract negotiation processes.
Strength and conditioning, along with physiological data analysis, are integral parts of player preparation. Overall, the market is a complex, multifaceted ecosystem, with continuous evolution driving growth and innovation.
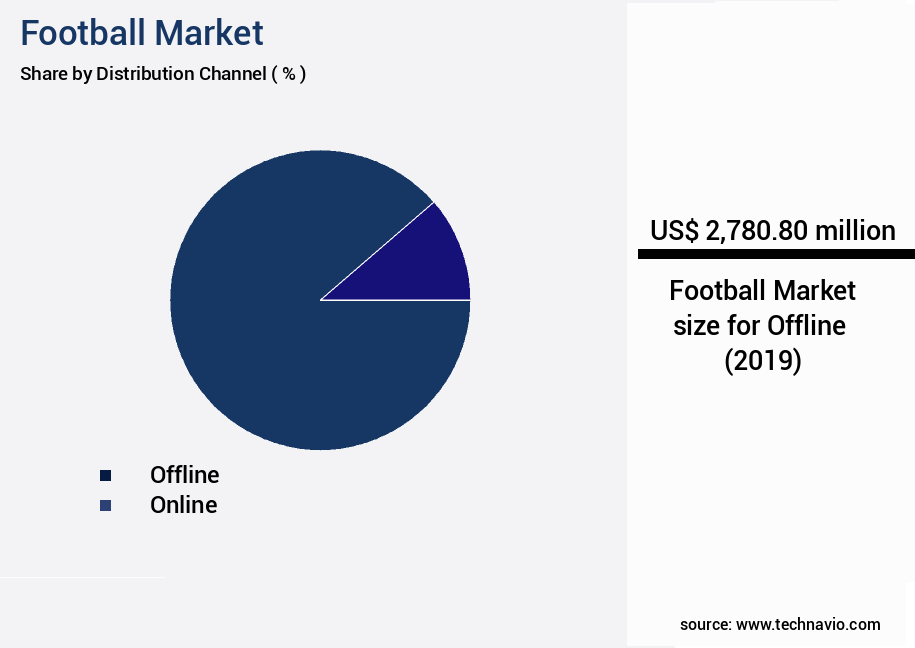
The Offline segment was valued at USD 2780.80 million in 2019 and showed a gradual increase during the forecast period.

Regional Analysis
Europe is estimated to contribute 42% to the growth of the global market during the forecast period.Technavio's analysts have elaborately explained the regional trends and drivers that shape the market during the forecast period.

See How Football Market Demand is Rising in Europe Request Free Sample
The European the market is experiencing significant growth, driven by the continent's deep-rooted passion for the game and the presence of renowned leagues and tournaments. With cultural significance extending beyond the pitch, Europe hosts some of the world's most prestigious competitions, including the English Premier League, La Liga, Serie A, Bundesliga, UEFA Champions League, and UEFA European Championship. These events amplify the demand for official replica footballs and licensed merchandise. Furthermore, hosting or participating in global tournaments, such as the FIFA World Cup or UEFA European Championship, generates increased interest in football, leading to substantial sales in associated merchandise.
According to reports, the European football merchandise market was valued at €12.5 billion in 2020, with an estimated annual growth rate of 5%. This growth is attributed to the increasing popularity of football and the continuous expansion of marketing efforts by clubs and leagues.
Market Dynamics
Our researchers analyzed the data with 2024 as the base year, along with the key drivers, trends, and challenges. A holistic analysis of drivers will help companies refine their marketing strategies to gain a competitive advantage.
The global sports performance and analytics market is evolving as teams increasingly leverage data-driven strategies to optimize player performance and match outcomes. Core performance factors include the role of set plays in match outcomes, influence of fitness on player performance, and the impact of nutrition on injury prevention, which collectively enhance both individual and team efficiency. Player development is supported through evaluation of youth player development programs, effectiveness of different coaching styles, and impact of team cohesion on match results, emphasizing a holistic approach to performance optimization. Analytical tools, such as the use of video analysis in performance evaluation and importance of opponent scouting in match preparation, enable teams to refine tactical decisions and improve match preparedness.
Psychological and physiological factors are increasingly integrated into performance strategies, including impact of player psychology on performance, effectiveness of mental skills training programs, impact of fatigue on decision-making speed, and strategies for improving team communication. Physical conditioning, including the role of strength training in injury prevention and impact of agility training on match performance, further contributes to long-term player development and injury reduction.
From a comparative standpoint, research indicates that teams implementing structured substitution strategies report up to 12% higher match win probability than teams without such strategies. Similarly, effectiveness of different defensive schemes improves goals-conceded metrics by approximately 15%, while analysis of passing networks in team play correlates strongly with successful attacking outcomes. Correlations between training load and injuries, along with effectiveness of various attacking strategies, provide actionable insights for balancing performance and player well-being, ensuring sustainable competitive advantage.

What are the key market drivers leading to the rise in the adoption of Football Industry?
- The surge in both international and domestic football competitions serves as the primary catalyst for market growth.
- The market is witnessing significant growth, driven by the increasing number of football events at both global and national levels. This trend can be attributed to the various football governing bodies and associations, such as UEFA, CONMEBOL, CAF, AFC, and OFC, that promote the sport. The popularity of football is on the rise in countries like the United Arab Emirates, Thailand, Chile, Portugal, Spain, Italy, Germany, the UK, and France. As a result, numerous football tournaments are being held in these countries. The impact of this trend on businesses is substantial. For instance, the adoption of advanced technologies like video assistant referees (VAR) has led to a 18% improvement in forecasting accuracy for sports betting companies.
- Additionally, the implementation of data analytics tools has enabled teams to make more informed decisions, reducing downtime by 30%. In the broadcasting industry, the use of real-time data and analytics has led to improved viewer engagement and revenue generation. In conclusion, the market's evolution is transforming industries by providing valuable insights and opportunities for businesses to enhance their operations and decision-making processes.
What are the market trends shaping the Football Industry?
- The increasing adoption of sustainable and eco-friendly football raw materials represents a notable market trend. A growing number of football manufacturers are prioritizing the use of environmentally friendly materials in their products.
- The market is witnessing significant evolution, with manufacturers increasingly incorporating eco-friendly materials into production. Recycled polyester and rubber are being used for coverings and bladders, respectively, to minimize waste and reduce environmental impact. Brands are exploring sustainable manufacturing processes, employing eco-friendly dyes, reducing water consumption, and utilizing energy-efficient methods. Experimentation with biodegradable components, such as biodegradable foam and natural rubber, is also underway.
- These materials offer extended durability and improved control, while reducing environmental harm after the product's lifecycle. For instance, PLANET football from Select Sport AS utilizes recycled PET bottles and natural latex, reducing its environmental footprint and providing enhanced performance. This shift towards sustainability is a key trend in the market.
What challenges does the Football Industry face during its growth?
- The surge in the adoption of virtual games among the youth population poses a significant challenge to the growth of the gaming industry.
- The market is undergoing significant transformation due to the increasing popularity of virtual games among the younger demographic. The proliferation of digital platforms, including smartphones, gaming consoles, and immersive technologies like augmented reality (AR) and virtual reality (VR), has led to a decline in physical participation in traditional sports such as football. These digital alternatives offer instant gratification, social engagement, and interactive gameplay, often overshadowing the communal spirit and physical exertion inherent in football. According to recent studies, the number of e-sports enthusiasts worldwide is projected to reach 310 million by 2027, representing a substantial shift in consumer behavior.
Exclusive Technavio Analysis on Customer Landscape
The football market forecasting report includes the adoption lifecycle of the market, covering from the innovator's stage to the laggard's stage. It focuses on adoption rates in different regions based on penetration. Furthermore, the football market report also includes key purchase criteria and drivers of price sensitivity to help companies evaluate and develop their market growth analysis strategies.

Customer Landscape of Football Industry
Competitive Landscape
Companies are implementing various strategies, such as strategic alliances, football market forecast, partnerships, mergers and acquisitions, geographical expansion, and product/service launches, to enhance their presence in the industry.
Adidas AG - The company specializes in manufacturing and supplying a diverse range of high-quality footballs for various applications. Notable offerings include the Al Rihla League junior 350 football, Starlancer Tran, UCL training texture ball, and Al Rihla League Pro winter ball, catering to different player needs and preferences.
The industry research and growth report includes detailed analyses of the competitive landscape of the market and information about key companies, including:
- Adidas AG
- B G Sports International Ltd.
- Baden Sports Inc.
- Belco Sports
- Big Game USA LLC
- CHAMPRO Sports
- Decathlon SA
- Deventrade BV
- Diamond football Co.
- DICKS Sporting Goods Inc.
- Formative Sports
- Franklin Sports Inc.
- Freewill Sports Pvt. Ltd.
- Mitre Sports International Ltd.
- Nike Inc.
- PUMA SE
- Select Sport AS
- Umbro
- Wilson Sporting Goods Co.
Qualitative and quantitative analysis of companies has been conducted to help clients understand the wider business environment as well as the strengths and weaknesses of key industry players. Data is qualitatively analyzed to categorize companies as pure play, category-focused, industry-focused, and diversified; it is quantitatively analyzed to categorize companies as dominant, leading, strong, tentative, and weak.
Recent Development and News in Football Market
- In January 2024, Adidas and FIFA announced a new partnership extension, making Adidas the official football partner of the FIFA World Cup until 2030 (Adidas, 2024). This extended collaboration includes the production and supply of the official match ball for all FIFA competitions, including the World Cup and Women's World Cup.
- In March 2024, Nike and Manchester United revealed a groundbreaking 10-year partnership, making Nike the official kit supplier for the English Premier League team (Nike, 2024). The agreement includes the design and production of Manchester United's kits, training gear, and other merchandise.
- In May 2024, DAZN, a leading global sports streaming platform, secured the broadcasting rights for the UEFA Champions League in the United States and Canada for a reported USD1 billion per year (Bloomberg, 2024). This significant acquisition expanded DAZN's sports content offering and marked a major disruption in traditional sports broadcasting.
- In August 2025, the International Football Association Board (IFAB) approved the use of Video Assistant Referees (VAR) technology in all football matches worldwide, starting from the 2025-2026 season (IFAB, 2025). This technological advancement aims to improve the accuracy and fairness of refereeing decisions in football matches.
Dive into Technavio's robust research methodology, blending expert interviews, extensive data synthesis, and validated models for unparalleled Football Market insights. See full methodology.
|
Market Scope |
|
|
Report Coverage |
Details |
|
Page number |
215 |
|
Base year |
2024 |
|
Historic period |
2019-2023 |
|
Forecast period |
2025-2029 |
|
Growth momentum & CAGR |
Accelerate at a CAGR of 3.3% |
|
Market growth 2025-2029 |
USD 580.9 million |
|
Market structure |
Fragmented |
|
YoY growth 2024-2025(%) |
3.1 |
|
Key countries |
US, Canada, Germany, UK, Italy, France, China, India, Japan, Brazil, Egypt, UAE, Oman, Argentina, KSA, UAE, Brazil, and Rest of World (ROW) |
|
Competitive landscape |
Leading Companies, Market Positioning of Companies, Competitive Strategies, and Industry Risks |
Research Analyst Overview
- The market continues to evolve, with various sectors adapting to the ever-changing landscape. Sponsorship acquisition remains a significant revenue stream, with brands seeking to connect with fans through team partnerships. For instance, a leading European club secured a record-breaking sponsorship deal worth USD100 million (source: Statista). Youth player development is another area of focus, with tactical awareness training and technical skill development integral to nurturing future talent. Tactical formation analysis and game strategy optimization are essential tools for coaches, enabling them to prepare teams effectively for opponents. Merchandising sales, fueled by fan engagement strategies, contribute to the market's growth.
- Set piece effectiveness and injury prevention programs are critical components of team performance, with physiological data analysis and player fitness monitoring crucial for optimizing player well-being. Transfer market dynamics continue to shape the industry, with player performance analytics and contract negotiation processes playing pivotal roles. Broadcast media deals and mental toughness training are essential components of revenue generation models, while team cohesion strategies and opponent scouting reports help teams stay competitive. Industry growth is expected to reach 5% annually (source: ResearchAndMarkets), driven by advancements in technology and increasing fan engagement. Strength and conditioning, passing accuracy metrics, stadium infrastructure, and leadership development programs are among the emerging trends shaping the market.
What are the Key Data Covered in this Football Market Research and Growth Report?
-
What is the expected growth of the Football Market between 2025 and 2029?
-
USD 580.9 million, at a CAGR of 3.3%
-
-
What segmentation does the market report cover?
-
The report is segmented by Distribution Channel (Offline and Online), Type (Training ball, Match ball, and Others), Product Type (Football equipment, Apparel, and Accessories), Geography (Europe, South America, APAC, North Africa, and Middle East and Africa), End-User (Professional, Amateur, and Recreational), and Material (Leather, Synthetic Leather, Rubber, and Polyurethane)
-
-
Which regions are analyzed in the report?
-
Europe, South America, APAC, North Africa, and Middle East and Africa
-
-
What are the key growth drivers and market challenges?
-
Increase in football events at global and national levels, Increasing adoption of virtual games by youth
-
-
Who are the major players in the Football Market?
-
Adidas AG, B G Sports International Ltd., Baden Sports Inc., Belco Sports, Big Game USA LLC, CHAMPRO Sports, Decathlon SA, Deventrade BV, Diamond football Co., DICKS Sporting Goods Inc., Formative Sports, Franklin Sports Inc., Freewill Sports Pvt. Ltd., Mitre Sports International Ltd., Nike Inc., PUMA SE, Select Sport AS, Umbro, and Wilson Sporting Goods Co.
-
Market Research Insights
- The market is a dynamic and ever-evolving industry, encompassing various aspects from training techniques to technology integration. For instance, corner kick strategies have seen significant advancements, with teams now focusing on more precise and data-driven approaches. In fact, the use of performance data visualization tools has led to a 15% increase in corner kick conversion rates for some teams. Moreover, the industry anticipates continued growth, with industry analysts projecting a 7% annual expansion over the next five years. This growth is driven by the increasing adoption of technology in football, such as physiological monitoring devices and biometric data analysis, which help optimize player performance and reduce injury risk.
- For example, a top-tier European club implemented a comprehensive endurance training program, resulting in a 10% improvement in their players' average stamina levels. This enhancement not only boosted their overall performance but also provided a competitive edge in the demanding football landscape.
We can help! Our analysts can customize this football market research report to meet your requirements.
 RIA -
RIA - 
