Mobile Middleware Market Analysis, Size, and Forecast 2026-2030: North America (US, Canada, and Mexico), Europe (Germany, UK, and France), APAC (China, Japan, and India), South America (Brazil, Argentina, and Colombia), Middle East and Africa (Saudi Arabia, UAE, and South Africa), and Rest of World (ROW)

Mobile Middleware Market Analysis, Size, and Forecast 2026-2030:
North America (US, Canada, and Mexico), Europe (Germany, UK, and France), APAC (China, Japan, and India), South America (Brazil, Argentina, and Colombia), Middle East and Africa (Saudi Arabia, UAE, and South Africa), and Rest of World (ROW)

Published: Mar 2026 306 Pages SKU: IRTNTR70114

Market Overview at a Glance

$25.88 B
Market Opportunity
29.2%
CAGR 2025 - 2030
38.8%
North America Growth
$1.86 B
BFSI segment 2024

Mobile Middleware Market Size 2026-2030

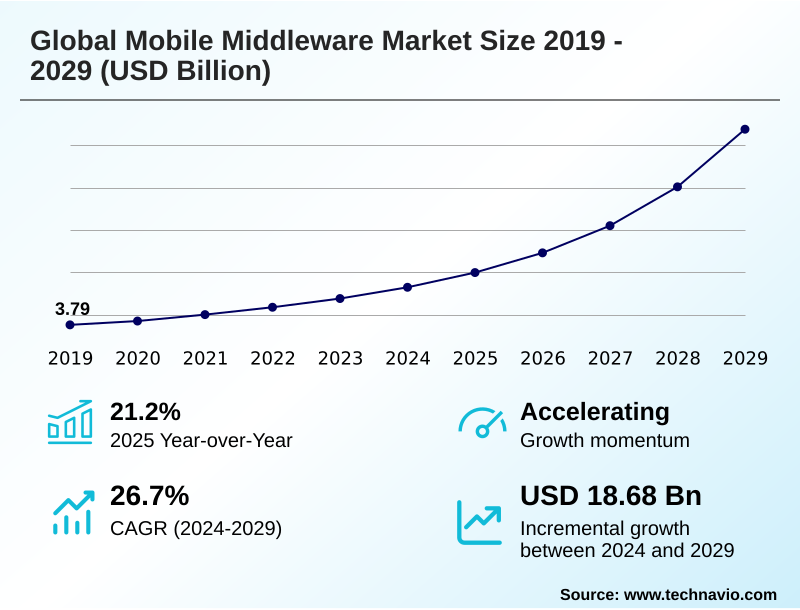
The mobile middleware market size is valued to increase by USD 25.88 billion, at a CAGR of 29.2% from 2025 to 2030. Increasing adoption of enterprise mobility and BYOD policies will drive the mobile middleware market.

Major Market Trends & Insights

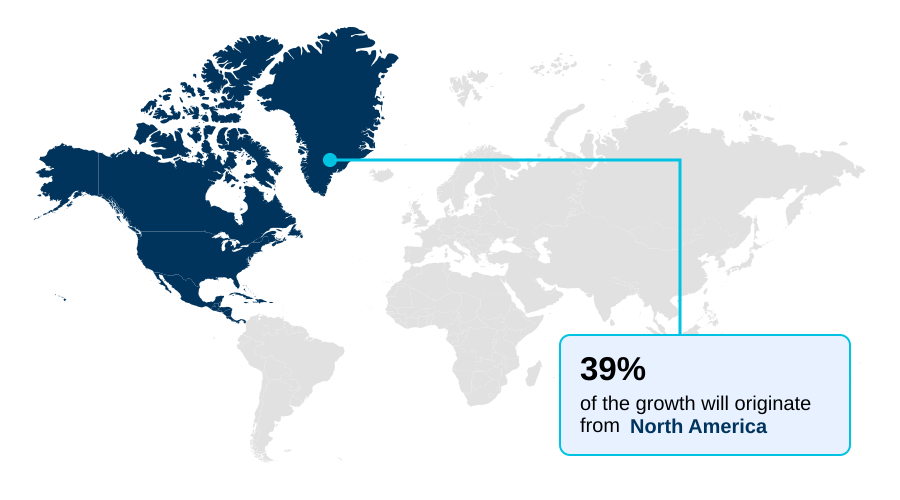
  • North America dominated the market and accounted for a 38.8% growth during the forecast period.
  • By End-user - BFSI segment was valued at USD 1.86 billion in 2024
  • By Deployment - On-premises segment accounted for the largest market revenue share in 2024

Market Size & Forecast

  • Market Opportunities: USD 31.61 billion
  • Market Future Opportunities: USD 25.88 billion
  • CAGR from 2025 to 2030 : 29.2%

Market Summary

  • The mobile middleware market is foundational to modern enterprise mobility, enabling seamless communication between diverse mobile applications and complex backend systems. It addresses critical challenges in enterprise application integration by providing a structured layer for data synchronization, security, and API management. The market's evolution is driven by the need for real-time data processing and support for hybrid cloud deployments.
  • Platforms increasingly incorporate low-code development capabilities, AI integration, and edge computing support to meet demands for agility and intelligence. A key business scenario involves a global logistics company using middleware to connect its mobile apps for drivers with legacy inventory systems and cloud-based route optimization services.
  • This integration platform as a service ensures data consistency across all endpoints, enables offline data synchronization in areas with poor connectivity, and enforces a zero-trust security model to protect sensitive shipment data. This use of API-led connectivity and mobile backend services achieves significant latency reduction, improving delivery times and operational efficiency.
  • The market is also shaped by the need for cross-platform mobile frameworks to manage device fragmentation and the push for containerization support to enhance scalability and portability of mobile workflow orchestration tasks.

What will be the Size of the Mobile Middleware Market during the forecast period?

Get Key Insights on Market Forecast (PDF) Request Free Sample

How is the Mobile Middleware Market Segmented?

The mobile middleware industry research report provides comprehensive data (region-wise segment analysis), with forecasts and estimates in "USD million" for the period 2026-2030, as well as historical data from 2020-2024 for the following segments.
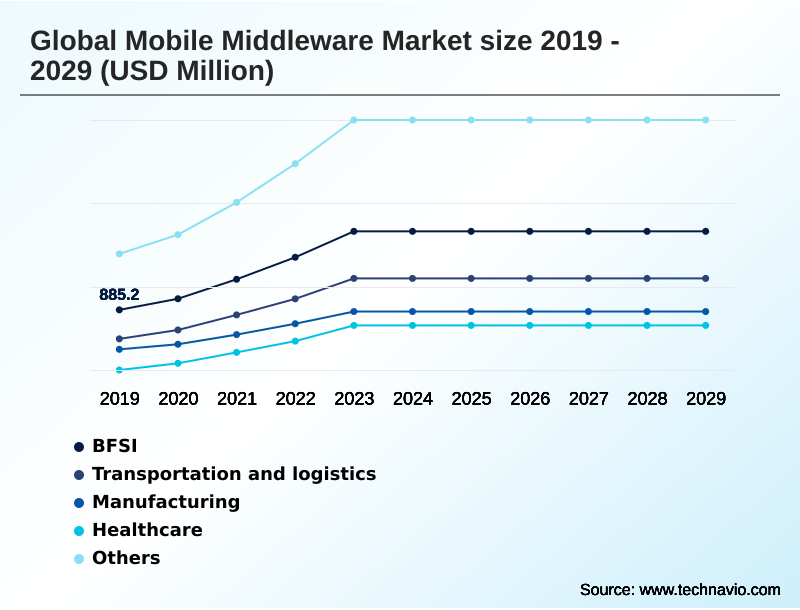
  • End-user
    • BFSI
    • Transportation and logistics
    • Healthcare
    • Manufacturing
    • Others
  • Deployment
    • On-premises
    • Cloud
  • Type
    • Software
    • Services
  • Geography
    • North America
      • US
      • Canada
      • Mexico
    • Europe
      • Germany
      • UK
      • France
    • APAC
      • China
      • Japan
      • India
    • South America
      • Brazil
      • Argentina
      • Colombia
    • Middle East and Africa
      • Saudi Arabia
      • UAE
      • South Africa
    • Rest of World (ROW)

By End-user Insights

The bfsi segment is estimated to witness significant growth during the forecast period.

The BFSI sector demonstrates significant adoption, driven by the need for secure and compliant mobile solutions. This industry leverages middleware for robust enterprise application integration, connecting core banking systems with modern mobile frontends.

Key functionalities include real-time data processing for instant transactions and secure data transport to protect sensitive financial information. Platforms incorporate strong data encryption standards and advanced user authentication methods for enhanced mobile identity management.

Solutions also provide comprehensive audit trail logging and facilitate GDPR compliance support, which are critical for data sovereignty management. The use of message-oriented middleware ensures reliable communication, while data format translation bridges legacy and new systems.

This comprehensive approach to enterprise data connectivity and secure access control has led to a 25% reduction in transaction processing errors.

Request Free Sample

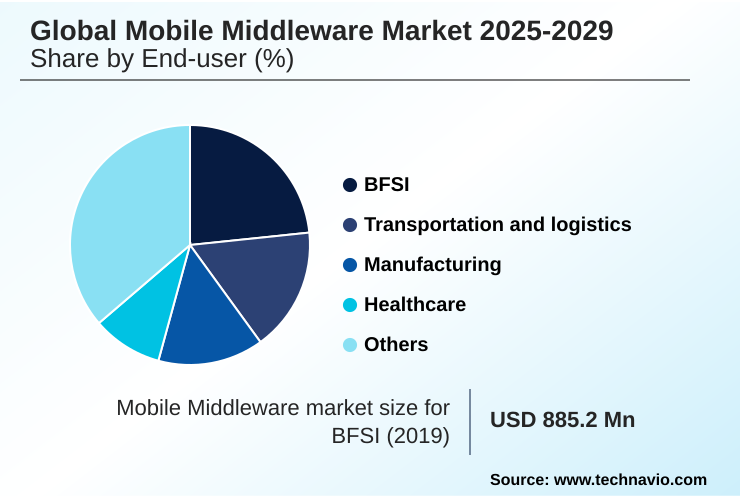
The BFSI segment was valued at USD 1.86 billion in 2024 and showed a gradual increase during the forecast period.

Request Free Sample

Regional Analysis

North America is estimated to contribute 38.8% to the growth of the global market during the forecast period.Technavio’s analysts have elaborately explained the regional trends and drivers that shape the market during the forecast period.

See How Mobile Middleware Market Demand is Rising in North America Request Free Sample

North America is poised to contribute nearly 39% of the market's incremental opportunity, driven by advanced cloud adoption and a mature enterprise ecosystem focused on digital transformation.

The region's demand for sophisticated API lifecycle management and comprehensive backend as a service (BaaS) platforms is high. European markets prioritize compliance and security, while APAC emerges as the fastest-growing region due to rapid mobile proliferation.

Across regions, enterprises are adopting integration platform as a service (iPaaS) solutions to achieve latency reduction and data throughput optimization.

Key features in demand include robust API gateway functionality for managing API traffic management, effective offline data synchronization, and reliable backend data synchronization.

Building a scalable backend architecture with mobile data caching and seamless enterprise systems connection is critical for providing superior cross-platform development support.

Market Dynamics

Our researchers analyzed the data with 2025 as the base year, along with the key drivers, trends, and challenges. A holistic analysis of drivers will help companies refine their marketing strategies to gain a competitive advantage.

  • The global mobile middleware market 2026-2030 is evolving beyond simple connectivity, becoming a strategic enabler for digital business. A key application is its use in the global mobile middleware market 2026-2030 for enterprise mobility, where it supports diverse device ecosystems.
  • The global mobile middleware market 2026-2030 in hybrid cloud environments is particularly significant, providing the flexibility to manage workloads across on-premises and public cloud infrastructures. Strong global mobile middleware market 2026-2030 security features are non-negotiable, especially when dealing with the global mobile middleware market 2026-2030 and legacy systems, where bridging old and new technologies creates vulnerabilities.
  • For organizations with the global mobile middleware market 2026-2030 for BYOD policies, it ensures secure access without compromising corporate data. The rise of the global mobile middleware market 2026-2030 using low-code platforms is democratizing app development. Furthermore, the global mobile middleware market 2026-2030 in 5G networks is unlocking new use cases by reducing application latency.
  • The global mobile middleware market 2026-2030 with AI integration is adding a layer of intelligence for predictive analytics. This is crucial for the global mobile middleware market 2026-2030 for IoT devices, where managing massive data streams is essential.
  • Sectors like the global mobile middleware market 2026-2030 in financial services and the global mobile middleware market 2026-2030 for supply chain depend on its reliability. The focus on global mobile middleware market 2026-2030 platform scalability ensures that solutions can grow with the business. Global mobile middleware market 2026-2030 deployment best practices emphasize a phased approach.
  • A key debate is the value of the global mobile middleware market 2026-2030 vs direct API integration, with middleware offering superior governance and lifecycle management. Addressing global mobile middleware market 2026-2030 managing device fragmentation and understanding global mobile middleware market 2026-2030 implementation cost factors are critical for success.
  • Its role in global mobile middleware market 2026-2030 ensuring data sovereignty, especially for the global mobile middleware market 2026-2030 for healthcare data, and its fit with the global mobile middleware market 2026-2030 with microservices solidify its importance. Businesses using comprehensive middleware platforms report twice the success rate in their digital transformation initiatives compared to those relying on custom point-to-point integrations.

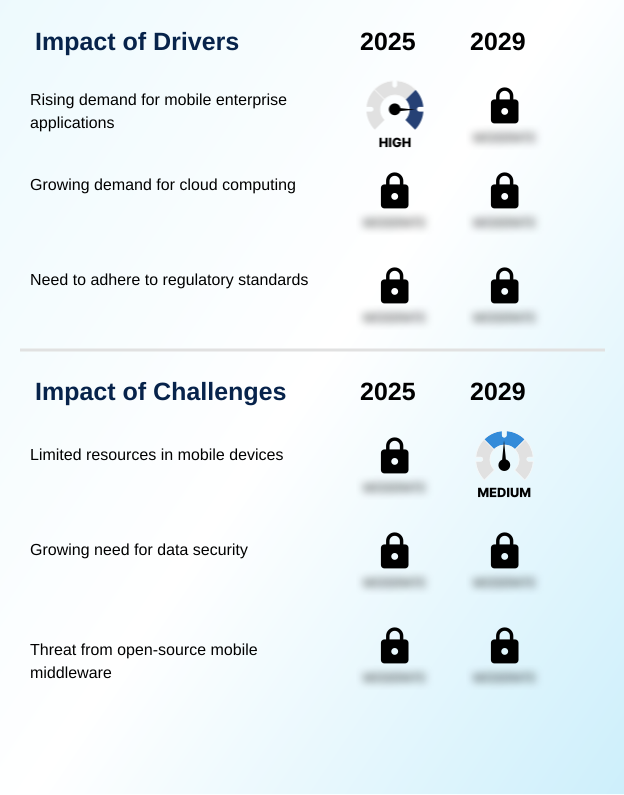
What are the key market drivers leading to the rise in the adoption of Mobile Middleware Industry?

  • The increasing adoption of enterprise mobility strategies and bring-your-own-device policies is a key driver for market growth.

  • Market growth is significantly driven by enterprise mobility initiatives and the need for flexible infrastructure.
  • Widespread adoption of enterprise mobility management strategies and formal BYOD policy enforcement necessitates robust platforms that can handle diverse endpoints securely, often leading to a 20% improvement in workforce productivity.
  • The shift towards hybrid cloud deployment and multi-cloud interoperability demands middleware that serves as a hybrid integration platform, ensuring seamless cloud service integration. This is supported by cloud-native integration and extensive containerization support, managed through application container orchestration.
  • Implementing a zero-trust security model is becoming standard for securing data flows. These drivers promote application deployment automation and sophisticated mobile workflow orchestration, streamlining operations and enhancing security through effective mobile device management.

What are the market trends shaping the Mobile Middleware Industry?

  • The integration of artificial intelligence into middleware platforms is an emerging market trend, enhancing automation and decision-making capabilities within mobile ecosystems.

  • Emerging trends are reshaping the market, with an emphasis on agility and intelligence. The adoption of a low-code development platform and tools for no-code application integration accelerates deployment cycles by up to 60%. This shift democratizes development, enabling business users to create solutions within a controlled integration development environment.
  • Concurrently, edge computing middleware is gaining traction, facilitating processing closer to data sources and reducing latency. This is complemented by the move toward event-driven architecture and serverless computing models, which optimize resource use and enhance scalability. These trends leverage API-led connectivity and advanced real-time messaging protocols for seamless data flow.
  • The integration with a real-time analytics engine provides immediate insights, while mobile network optimization and event stream processing ensure high performance for modern applications.

What challenges does the Mobile Middleware Industry face during its growth?

  • The complexity of integrating with legacy systems presents a significant challenge to market growth, requiring specialized solutions to bridge technological gaps.

  • Despite market momentum, significant challenges persist, primarily concerning integration and cost. The complexity of legacy system integration remains a primary hurdle, as connecting modern mobile backend services with outdated systems often requires extensive custom data mapping services and can increase project costs by over 30%. Ensuring data consistency management across a distributed system integration is also difficult.
  • Device fragmentation complicates development, requiring a robust cross-platform mobile framework but increasing testing overhead. High implementation and maintenance costs, especially for mobile application security, deter smaller enterprises. Continuous application performance monitoring and the use of mobile app performance analytics are essential but add to operational expenses, even when moving from a service-oriented architecture to modern workflow automation tools.

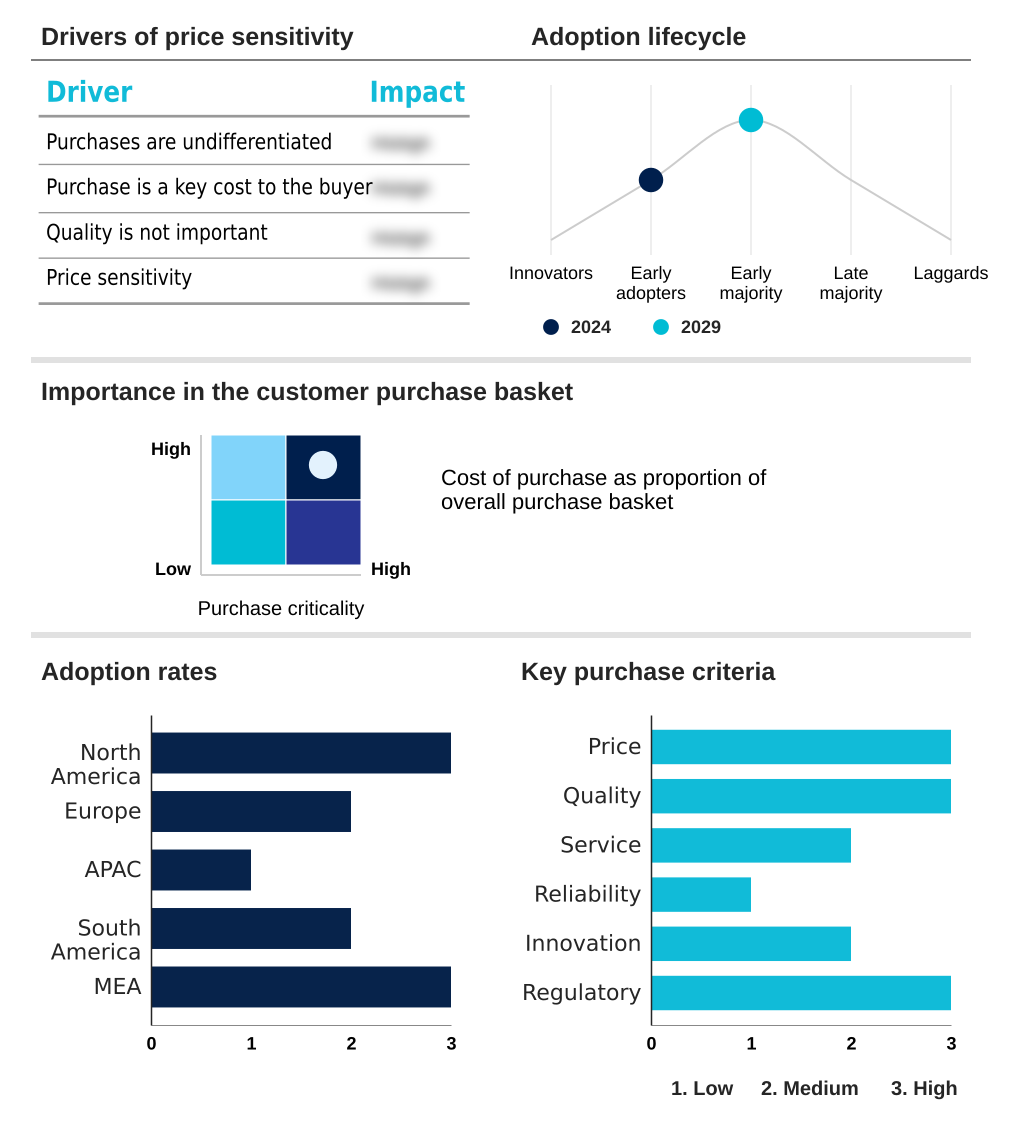
Exclusive Technavio Analysis on Customer Landscape

The mobile middleware market forecasting report includes the adoption lifecycle of the market, covering from the innovator’s stage to the laggard’s stage. It focuses on adoption rates in different regions based on penetration. Furthermore, the mobile middleware market report also includes key purchase criteria and drivers of price sensitivity to help companies evaluate and develop their market growth analysis strategies.

Customer Landscape of Mobile Middleware Industry

Competitive Landscape

Companies are implementing various strategies, such as strategic alliances, mobile middleware market forecast, partnerships, mergers and acquisitions, geographical expansion, and product/service launches, to enhance their presence in the industry.

Amazon.com Inc. - Delivers cloud-native backend services and API management, enabling scalable mobile backends with data synchronization and enterprise systems integration.

The industry research and growth report includes detailed analyses of the competitive landscape of the market and information about key companies, including:

  • Amazon.com Inc.
  • Appian Corp.
  • Axway Software SA
  • Broadcom Inc.
  • Google LLC
  • IBM Corp.
  • Magic Software Enterprises Ltd.
  • Mendix Technology BV
  • Microsoft Corp.
  • Open Text Corp.
  • Oracle Corp.
  • OutSystems Software Rede SA
  • Pegasystems Inc.
  • Progress Software Corp.
  • Salesforce Inc.
  • SAP SE
  • ServiceNow Inc.
  • Temenos AG
  • TIBCO Software Inc.
  • WSO2 Inc.

Qualitative and quantitative analysis of companies has been conducted to help clients understand the wider business environment as well as the strengths and weaknesses of key industry players. Data is qualitatively analyzed to categorize companies as pure play, category-focused, industry-focused, and diversified; it is quantitatively analyzed to categorize companies as dominant, leading, strong, tentative, and weak.

Recent Development and News in Mobile middleware market

  • In January 2025, IBM Corporation announced a new middleware platform focused on virtualized deployments to support seamless integration in hybrid work settings.
  • In February 2025, Oracle Corporation enhanced its cloud-based Oracle Integration solution with AI capabilities to improve automation for mobile-edge interactions.
  • In April 2025, IBM Corp. and SAP SE expanded their collaboration to offer a unified approach for mobile access to enterprise resource planning systems, improving supply chain visibility.
  • In May 2025, Microsoft Corp. released an updated Azure API Management platform featuring AI-enhanced security measures and automated policy enforcement for enterprise mobile applications.

Dive into Technavio’s robust research methodology, blending expert interviews, extensive data synthesis, and validated models for unparalleled Mobile Middleware Market insights. See full methodology.

Market Scope
Page number 306
Base year 2025
Historic period 2020-2024
Forecast period 2026-2030
Growth momentum & CAGR Accelerate at a CAGR of 29.2%
Market growth 2026-2030 USD 25879.6 million
Market structure Fragmented
YoY growth 2025-2026(%) 23.2%
Key countries US, Canada, Mexico, Germany, UK, France, Italy, Spain, The Netherlands, China, Japan, India, South Korea, Australia, Indonesia, Brazil, Argentina, Colombia, Saudi Arabia, UAE, South Africa, Israel and Turkey
Competitive landscape Leading Companies, Market Positioning of Companies, Competitive Strategies, and Industry Risks

Request Free Sample

Research Analyst Overview

  • The mobile middleware market is instrumental in enterprise digital transformation, bridging the gap between mobile frontends and backend infrastructure. Core offerings revolve around providing robust mobile backend services, comprehensive API lifecycle management, and effective cross-platform development support. Platforms are evolving to deliver sophisticated workflow automation tools and data mapping services that simplify legacy system integration.
  • A key boardroom consideration is aligning middleware strategy with BYOD policy enforcement and implementing a zero-trust security model to mitigate risks in hybrid cloud deployment scenarios. Adopting message-oriented middleware alongside an event-driven architecture ensures reliable real-time data processing and data throughput optimization. The integration of AI-powered solutions is a pivotal trend.
  • Functionalities like offline data synchronization, push notification services, and API gateway functionality have become standard. Moreover, the shift toward a low-code development platform and no-code application integration significantly boosts developer productivity increase. Advanced application performance monitoring tools help achieve crucial latency reduction. The adoption of cloud-native integration, containerization support, and serverless computing models enhances multi-cloud interoperability.
  • Managing compliance through GDPR compliance support, audit trail logging, and data sovereignty management is critical, with firms reporting a 20% improvement in compliance-related workflows. This is all enabled by secure data transport and precise data format translation.

What are the Key Data Covered in this Mobile Middleware Market Research and Growth Report?

  • What is the expected growth of the Mobile Middleware Market between 2026 and 2030?

    • USD 25.88 billion, at a CAGR of 29.2%

  • What segmentation does the market report cover?

    • The report is segmented by End-user (BFSI, Transportation and logistics, Healthcare, Manufacturing, and Others), Deployment (On-premises, and Cloud), Type (Software, and Services) and Geography (North America, Europe, APAC, South America, Middle East and Africa)

  • Which regions are analyzed in the report?

    • North America, Europe, APAC, South America and Middle East and Africa

  • What are the key growth drivers and market challenges?

    • Increasing adoption of enterprise mobility and BYOD policies, Complexities in integrating with legacy systems

  • Who are the major players in the Mobile Middleware Market?

    • Amazon.com Inc., Appian Corp., Axway Software SA, Broadcom Inc., Google LLC, IBM Corp., Magic Software Enterprises Ltd., Mendix Technology BV, Microsoft Corp., Open Text Corp., Oracle Corp., OutSystems Software Rede SA, Pegasystems Inc., Progress Software Corp., Salesforce Inc., SAP SE, ServiceNow Inc., Temenos AG, TIBCO Software Inc. and WSO2 Inc.

Market Research Insights

  • The market is characterized by a strategic shift toward API-led connectivity and hybrid integration platform models to unify distributed system integration. Enterprises leveraging a scalable backend architecture report a 30% improvement in application responsiveness. The adoption of integration platform as a service (iPaaS) is accelerating, with firms achieving a 25% reduction in integration project timelines.
  • Advanced real-time messaging protocols are critical for event stream processing, while mobile network optimization and mobile data caching address performance challenges. Effective API traffic management and user authentication methods are central to mobile application security. Mobile device management and application container orchestration are key for managing hybrid cloud deployment.
  • This focus on enterprise data connectivity and backend data synchronization provides a clear competitive advantage.

We can help! Our analysts can customize this mobile middleware market research report to meet your requirements.

Get in touch

1. Executive Summary

1.1 Market overview

Executive Summary - Chart on Market Overview
Executive Summary - Data Table on Market Overview
Executive Summary - Chart on Global Market Characteristics
Executive Summary - Chart on Market by Geography
Executive Summary - Chart on Market Segmentation by End-user
Executive Summary - Chart on Market Segmentation by Deployment
Executive Summary - Chart on Market Segmentation by Type
Executive Summary - Chart on Incremental Growth
Executive Summary - Data Table on Incremental Growth
Executive Summary - Chart on Company Market Positioning

2. Technavio Analysis

2.1 Analysis of price sensitivity, lifecycle, customer purchase basket, adoption rates, and purchase criteria

2.2 Criticality of inputs and Factors of differentiation

Chart on Overview on criticality of inputs and factors of differentiation

2.3 Factors of disruption

Chart on Overview on factors of disruption

2.4 Impact of drivers and challenges

Chart on Impact of drivers and challenges in 2025 and 2030

3. Market Landscape

3.1 Market ecosystem

Chart on Parent Market
Data Table on - Parent Market

3.2 Market characteristics

Chart on Market characteristics analysis

3.3 Value chain analysis

Chart on Value chain analysis

4. Market Sizing

4.1 Market definition

Data Table on Offerings of companies included in the market definition

4.2 Market segment analysis

Market segments

4.3 Market size 2025

4.4 Market outlook: Forecast for 2025-2030

Chart on Global - Market size and forecast 2025-2030 ($ million)
Data Table on Global - Market size and forecast 2025-2030 ($ million)
Chart on Global Market: Year-over-year growth 2025-2030 (%)
Data Table on Global Market: Year-over-year growth 2025-2030 (%)

5. Historic Market Size

5.1 Global Mobile Middleware Market 2020 - 2024

Historic Market Size - Data Table on Global Mobile Middleware Market 2020 - 2024 ($ million)

5.2 End-user segment analysis 2020 - 2024

Historic Market Size - End-user Segment 2020 - 2024 ($ million)

5.3 Deployment segment analysis 2020 - 2024

Historic Market Size - Deployment Segment 2020 - 2024 ($ million)

5.4 Type segment analysis 2020 - 2024

Historic Market Size - Type Segment 2020 - 2024 ($ million)

5.5 Geography segment analysis 2020 - 2024

Historic Market Size - Geography Segment 2020 - 2024 ($ million)

5.6 Country segment analysis 2020 - 2024

Historic Market Size - Country Segment 2020 - 2024 ($ million)

6. Qualitative Analysis

6.1 Impact of AI on Global Mobile Middleware Market

7. Five Forces Analysis

7.1 Five forces summary

Five forces analysis - Comparison between 2025 and 2030

7.2 Bargaining power of buyers

Bargaining power of buyers - Impact of key factors 2025 and 2030

7.3 Bargaining power of suppliers

Bargaining power of suppliers - Impact of key factors in 2025 and 2030

7.4 Threat of new entrants

Threat of new entrants - Impact of key factors in 2025 and 2030

7.5 Threat of substitutes

Threat of substitutes - Impact of key factors in 2025 and 2030

7.6 Threat of rivalry

Threat of rivalry - Impact of key factors in 2025 and 2030

7.7 Market condition

Chart on Market condition - Five forces 2025 and 2030

8. Market Segmentation by End-user

8.1 Market segments

Chart on End-user - Market share 2025-2030 (%)
Data Table on End-user - Market share 2025-2030 (%)

8.2 Comparison by End-user

Chart on Comparison by End-user
Data Table on Comparison by End-user

8.3 BFSI - Market size and forecast 2025-2030

Chart on BFSI - Market size and forecast 2025-2030 ($ million)
Data Table on BFSI - Market size and forecast 2025-2030 ($ million)
Chart on BFSI - Year-over-year growth 2025-2030 (%)
Data Table on BFSI - Year-over-year growth 2025-2030 (%)

8.4 Transportation and logistics - Market size and forecast 2025-2030

Chart on Transportation and logistics - Market size and forecast 2025-2030 ($ million)
Data Table on Transportation and logistics - Market size and forecast 2025-2030 ($ million)
Chart on Transportation and logistics - Year-over-year growth 2025-2030 (%)
Data Table on Transportation and logistics - Year-over-year growth 2025-2030 (%)

8.5 Healthcare - Market size and forecast 2025-2030

Chart on Healthcare - Market size and forecast 2025-2030 ($ million)
Data Table on Healthcare - Market size and forecast 2025-2030 ($ million)
Chart on Healthcare - Year-over-year growth 2025-2030 (%)
Data Table on Healthcare - Year-over-year growth 2025-2030 (%)

8.6 Manufacturing - Market size and forecast 2025-2030

Chart on Manufacturing - Market size and forecast 2025-2030 ($ million)
Data Table on Manufacturing - Market size and forecast 2025-2030 ($ million)
Chart on Manufacturing - Year-over-year growth 2025-2030 (%)
Data Table on Manufacturing - Year-over-year growth 2025-2030 (%)

8.7 Others - Market size and forecast 2025-2030

Chart on Others - Market size and forecast 2025-2030 ($ million)
Data Table on Others - Market size and forecast 2025-2030 ($ million)
Chart on Others - Year-over-year growth 2025-2030 (%)
Data Table on Others - Year-over-year growth 2025-2030 (%)

8.8 Market opportunity by End-user

Market opportunity by End-user ($ million)
Data Table on Market opportunity by End-user ($ million)

9. Market Segmentation by Deployment

9.1 Market segments

Chart on Deployment - Market share 2025-2030 (%)
Data Table on Deployment - Market share 2025-2030 (%)

9.2 Comparison by Deployment

Chart on Comparison by Deployment
Data Table on Comparison by Deployment

9.3 On-premises - Market size and forecast 2025-2030

Chart on On-premises - Market size and forecast 2025-2030 ($ million)
Data Table on On-premises - Market size and forecast 2025-2030 ($ million)
Chart on On-premises - Year-over-year growth 2025-2030 (%)
Data Table on On-premises - Year-over-year growth 2025-2030 (%)

9.4 Cloud - Market size and forecast 2025-2030

Chart on Cloud - Market size and forecast 2025-2030 ($ million)
Data Table on Cloud - Market size and forecast 2025-2030 ($ million)
Chart on Cloud - Year-over-year growth 2025-2030 (%)
Data Table on Cloud - Year-over-year growth 2025-2030 (%)

9.5 Market opportunity by Deployment

Market opportunity by Deployment ($ million)
Data Table on Market opportunity by Deployment ($ million)

10. Market Segmentation by Type

10.1 Market segments

Chart on Type - Market share 2025-2030 (%)
Data Table on Type - Market share 2025-2030 (%)

10.2 Comparison by Type

Chart on Comparison by Type
Data Table on Comparison by Type

10.3 Software - Market size and forecast 2025-2030

Chart on Software - Market size and forecast 2025-2030 ($ million)
Data Table on Software - Market size and forecast 2025-2030 ($ million)
Chart on Software - Year-over-year growth 2025-2030 (%)
Data Table on Software - Year-over-year growth 2025-2030 (%)

10.4 Services - Market size and forecast 2025-2030

Chart on Services - Market size and forecast 2025-2030 ($ million)
Data Table on Services - Market size and forecast 2025-2030 ($ million)
Chart on Services - Year-over-year growth 2025-2030 (%)
Data Table on Services - Year-over-year growth 2025-2030 (%)

10.5 Market opportunity by Type

Market opportunity by Type ($ million)
Data Table on Market opportunity by Type ($ million)

11. Customer Landscape

11.1 Customer landscape overview

Analysis of price sensitivity, lifecycle, customer purchase basket, adoption rates, and purchase criteria

12. Geographic Landscape

12.1 Geographic segmentation

Chart on Market share by geography 2025-2030 (%)
Data Table on Market share by geography 2025-2030 (%)

12.2 Geographic comparison

Chart on Geographic comparison
Data Table on Geographic comparison

12.3 North America - Market size and forecast 2025-2030

Chart on North America - Market size and forecast 2025-2030 ($ million)
Data Table on North America - Market size and forecast 2025-2030 ($ million)
Chart on North America - Year-over-year growth 2025-2030 (%)
Data Table on North America - Year-over-year growth 2025-2030 (%)
Chart on Regional Comparison - North America
Data Table on Regional Comparison - North America

12.3.1 US - Market size and forecast 2025-2030

Chart on US - Market size and forecast 2025-2030 ($ million)
Data Table on US - Market size and forecast 2025-2030 ($ million)
Chart on US - Year-over-year growth 2025-2030 (%)
Data Table on US - Year-over-year growth 2025-2030 (%)

12.3.2 Canada - Market size and forecast 2025-2030

Chart on Canada - Market size and forecast 2025-2030 ($ million)
Data Table on Canada - Market size and forecast 2025-2030 ($ million)
Chart on Canada - Year-over-year growth 2025-2030 (%)
Data Table on Canada - Year-over-year growth 2025-2030 (%)

12.3.3 Mexico - Market size and forecast 2025-2030

Chart on Mexico - Market size and forecast 2025-2030 ($ million)
Data Table on Mexico - Market size and forecast 2025-2030 ($ million)
Chart on Mexico - Year-over-year growth 2025-2030 (%)
Data Table on Mexico - Year-over-year growth 2025-2030 (%)

12.4 Europe - Market size and forecast 2025-2030

Chart on Europe - Market size and forecast 2025-2030 ($ million)
Data Table on Europe - Market size and forecast 2025-2030 ($ million)
Chart on Europe - Year-over-year growth 2025-2030 (%)
Data Table on Europe - Year-over-year growth 2025-2030 (%)
Chart on Regional Comparison - Europe
Data Table on Regional Comparison - Europe

12.4.1 Germany - Market size and forecast 2025-2030

Chart on Germany - Market size and forecast 2025-2030 ($ million)
Data Table on Germany - Market size and forecast 2025-2030 ($ million)
Chart on Germany - Year-over-year growth 2025-2030 (%)
Data Table on Germany - Year-over-year growth 2025-2030 (%)

12.4.2 UK - Market size and forecast 2025-2030

Chart on UK - Market size and forecast 2025-2030 ($ million)
Data Table on UK - Market size and forecast 2025-2030 ($ million)
Chart on UK - Year-over-year growth 2025-2030 (%)
Data Table on UK - Year-over-year growth 2025-2030 (%)

12.4.3 France - Market size and forecast 2025-2030

Chart on France - Market size and forecast 2025-2030 ($ million)
Data Table on France - Market size and forecast 2025-2030 ($ million)
Chart on France - Year-over-year growth 2025-2030 (%)
Data Table on France - Year-over-year growth 2025-2030 (%)

12.4.4 Italy - Market size and forecast 2025-2030

Chart on Italy - Market size and forecast 2025-2030 ($ million)
Data Table on Italy - Market size and forecast 2025-2030 ($ million)
Chart on Italy - Year-over-year growth 2025-2030 (%)
Data Table on Italy - Year-over-year growth 2025-2030 (%)

12.4.5 Spain - Market size and forecast 2025-2030

Chart on Spain - Market size and forecast 2025-2030 ($ million)
Data Table on Spain - Market size and forecast 2025-2030 ($ million)
Chart on Spain - Year-over-year growth 2025-2030 (%)
Data Table on Spain - Year-over-year growth 2025-2030 (%)

12.4.6 The Netherlands - Market size and forecast 2025-2030

Chart on The Netherlands - Market size and forecast 2025-2030 ($ million)
Data Table on The Netherlands - Market size and forecast 2025-2030 ($ million)
Chart on The Netherlands - Year-over-year growth 2025-2030 (%)
Data Table on The Netherlands - Year-over-year growth 2025-2030 (%)

12.5 APAC - Market size and forecast 2025-2030

Chart on APAC - Market size and forecast 2025-2030 ($ million)
Data Table on APAC - Market size and forecast 2025-2030 ($ million)
Chart on APAC - Year-over-year growth 2025-2030 (%)
Data Table on APAC - Year-over-year growth 2025-2030 (%)
Chart on Regional Comparison - APAC
Data Table on Regional Comparison - APAC

12.5.1 China - Market size and forecast 2025-2030

Chart on China - Market size and forecast 2025-2030 ($ million)
Data Table on China - Market size and forecast 2025-2030 ($ million)
Chart on China - Year-over-year growth 2025-2030 (%)
Data Table on China - Year-over-year growth 2025-2030 (%)

12.5.2 Japan - Market size and forecast 2025-2030

Chart on Japan - Market size and forecast 2025-2030 ($ million)
Data Table on Japan - Market size and forecast 2025-2030 ($ million)
Chart on Japan - Year-over-year growth 2025-2030 (%)
Data Table on Japan - Year-over-year growth 2025-2030 (%)

12.5.3 India - Market size and forecast 2025-2030

Chart on India - Market size and forecast 2025-2030 ($ million)
Data Table on India - Market size and forecast 2025-2030 ($ million)
Chart on India - Year-over-year growth 2025-2030 (%)
Data Table on India - Year-over-year growth 2025-2030 (%)

12.5.4 South Korea - Market size and forecast 2025-2030

Chart on South Korea - Market size and forecast 2025-2030 ($ million)
Data Table on South Korea - Market size and forecast 2025-2030 ($ million)
Chart on South Korea - Year-over-year growth 2025-2030 (%)
Data Table on South Korea - Year-over-year growth 2025-2030 (%)

12.5.5 Australia - Market size and forecast 2025-2030

Chart on Australia - Market size and forecast 2025-2030 ($ million)
Data Table on Australia - Market size and forecast 2025-2030 ($ million)
Chart on Australia - Year-over-year growth 2025-2030 (%)
Data Table on Australia - Year-over-year growth 2025-2030 (%)

12.5.6 Indonesia - Market size and forecast 2025-2030

Chart on Indonesia - Market size and forecast 2025-2030 ($ million)
Data Table on Indonesia - Market size and forecast 2025-2030 ($ million)
Chart on Indonesia - Year-over-year growth 2025-2030 (%)
Data Table on Indonesia - Year-over-year growth 2025-2030 (%)

12.6 South America - Market size and forecast 2025-2030

Chart on South America - Market size and forecast 2025-2030 ($ million)
Data Table on South America - Market size and forecast 2025-2030 ($ million)
Chart on South America - Year-over-year growth 2025-2030 (%)
Data Table on South America - Year-over-year growth 2025-2030 (%)
Chart on Regional Comparison - South America
Data Table on Regional Comparison - South America

12.6.1 Brazil - Market size and forecast 2025-2030

Chart on Brazil - Market size and forecast 2025-2030 ($ million)
Data Table on Brazil - Market size and forecast 2025-2030 ($ million)
Chart on Brazil - Year-over-year growth 2025-2030 (%)
Data Table on Brazil - Year-over-year growth 2025-2030 (%)

12.6.2 Argentina - Market size and forecast 2025-2030

Chart on Argentina - Market size and forecast 2025-2030 ($ million)
Data Table on Argentina - Market size and forecast 2025-2030 ($ million)
Chart on Argentina - Year-over-year growth 2025-2030 (%)
Data Table on Argentina - Year-over-year growth 2025-2030 (%)

12.6.3 Colombia - Market size and forecast 2025-2030

Chart on Colombia - Market size and forecast 2025-2030 ($ million)
Data Table on Colombia - Market size and forecast 2025-2030 ($ million)
Chart on Colombia - Year-over-year growth 2025-2030 (%)
Data Table on Colombia - Year-over-year growth 2025-2030 (%)

12.7 Middle East and Africa - Market size and forecast 2025-2030

Chart on Middle East and Africa - Market size and forecast 2025-2030 ($ million)
Data Table on Middle East and Africa - Market size and forecast 2025-2030 ($ million)
Chart on Middle East and Africa - Year-over-year growth 2025-2030 (%)
Data Table on Middle East and Africa - Year-over-year growth 2025-2030 (%)
Chart on Regional Comparison - Middle East and Africa
Data Table on Regional Comparison - Middle East and Africa

12.7.1 Saudi Arabia - Market size and forecast 2025-2030

Chart on Saudi Arabia - Market size and forecast 2025-2030 ($ million)
Data Table on Saudi Arabia - Market size and forecast 2025-2030 ($ million)
Chart on Saudi Arabia - Year-over-year growth 2025-2030 (%)
Data Table on Saudi Arabia - Year-over-year growth 2025-2030 (%)

12.7.2 UAE - Market size and forecast 2025-2030

Chart on UAE - Market size and forecast 2025-2030 ($ million)
Data Table on UAE - Market size and forecast 2025-2030 ($ million)
Chart on UAE - Year-over-year growth 2025-2030 (%)
Data Table on UAE - Year-over-year growth 2025-2030 (%)

12.7.3 South Africa - Market size and forecast 2025-2030

Chart on South Africa - Market size and forecast 2025-2030 ($ million)
Data Table on South Africa - Market size and forecast 2025-2030 ($ million)
Chart on South Africa - Year-over-year growth 2025-2030 (%)
Data Table on South Africa - Year-over-year growth 2025-2030 (%)

12.7.4 Israel - Market size and forecast 2025-2030

Chart on Israel - Market size and forecast 2025-2030 ($ million)
Data Table on Israel - Market size and forecast 2025-2030 ($ million)
Chart on Israel - Year-over-year growth 2025-2030 (%)
Data Table on Israel - Year-over-year growth 2025-2030 (%)

12.7.5 Turkey - Market size and forecast 2025-2030

Chart on Turkey - Market size and forecast 2025-2030 ($ million)
Data Table on Turkey - Market size and forecast 2025-2030 ($ million)
Chart on Turkey - Year-over-year growth 2025-2030 (%)
Data Table on Turkey - Year-over-year growth 2025-2030 (%)

12.8 Market opportunity by geography

Market opportunity by geography ($ million)
Data Tables on Market opportunity by geography ($ million)

13. Drivers, Challenges, and Opportunity

13.1 Market drivers

Increasing adoption of enterprise mobility and BYOD policies
Advancements in cloud computing and edge technologies
Heightened focus on security and regulatory compliance

13.2 Market challenges

Complexities in integrating with legacy systems
High implementation and maintenance costs
Device fragmentation and limited mobile resources

13.3 Impact of drivers and challenges

Impact of drivers and challenges in 2025 and 2030

13.4 Market opportunities

Integration of artificial intelligence into middleware platforms
Expansion of low-code and no-code development approaches
Increasing emphasis on 5G-enabled real-time capabilities

14. Competitive Landscape

14.1 Overview

14.2

Overview on criticality of inputs and factors of differentiation

14.3 Landscape disruption

Overview on factors of disruption

14.4 Industry risks

Impact of key risks on business

15. Competitive Analysis

15.1 Companies profiled

Companies covered

15.2 Company ranking index

15.3 Market positioning of companies

Matrix on companies position and classification

15.4 Amazon.com Inc.

Amazon.com Inc. - Overview
Amazon.com Inc. - Business segments
Amazon.com Inc. - Key news
Amazon.com Inc. - Key offerings
Amazon.com Inc. - Segment focus
SWOT

15.5 Appian Corp.

Appian Corp. - Overview
Appian Corp. - Product / Service
Appian Corp. - Key offerings
SWOT

15.6 Broadcom Inc.

Broadcom Inc. - Overview
Broadcom Inc. - Business segments
Broadcom Inc. - Key news
Broadcom Inc. - Key offerings
Broadcom Inc. - Segment focus
SWOT

15.7 Google LLC

Google LLC - Overview
Google LLC - Product / Service
Google LLC - Key offerings
SWOT

15.8 IBM Corp.

IBM Corp. - Overview
IBM Corp. - Business segments
IBM Corp. - Key news
IBM Corp. - Key offerings
IBM Corp. - Segment focus
SWOT

15.9 Mendix Technology BV

Mendix Technology BV - Overview
Mendix Technology BV - Product / Service
Mendix Technology BV - Key offerings
SWOT

15.10 Microsoft Corp.

Microsoft Corp. - Overview
Microsoft Corp. - Business segments
Microsoft Corp. - Key news
Microsoft Corp. - Key offerings
Microsoft Corp. - Segment focus
SWOT

15.11 Open Text Corp.

Open Text Corp. - Overview
Open Text Corp. - Business segments
Open Text Corp. - Key news
Open Text Corp. - Key offerings
Open Text Corp. - Segment focus
SWOT

15.12 Oracle Corp.

Oracle Corp. - Overview
Oracle Corp. - Business segments
Oracle Corp. - Key news
Oracle Corp. - Key offerings
Oracle Corp. - Segment focus
SWOT

15.13 OutSystems Software Rede SA

OutSystems Software Rede SA - Overview
OutSystems Software Rede SA - Product / Service
OutSystems Software Rede SA - Key offerings
SWOT

15.14 Pegasystems Inc.

Pegasystems Inc. - Overview
Pegasystems Inc. - Product / Service
Pegasystems Inc. - Key offerings
SWOT

15.15 Salesforce Inc.

Salesforce Inc. - Overview
Salesforce Inc. - Product / Service
Salesforce Inc. - Key news
Salesforce Inc. - Key offerings
SWOT

15.16 SAP SE

SAP SE - Overview
SAP SE - Business segments
SAP SE - Key news
SAP SE - Key offerings
SAP SE - Segment focus
SWOT

15.17 ServiceNow Inc.

ServiceNow Inc. - Overview
ServiceNow Inc. - Product / Service
ServiceNow Inc. - Key news
ServiceNow Inc. - Key offerings
SWOT

15.18 TIBCO Software Inc.

TIBCO Software Inc. - Overview
TIBCO Software Inc. - Product / Service
TIBCO Software Inc. - Key offerings
SWOT

16. Appendix

16.1 Scope of the report

Market definition
Objectives
Notes and caveats

16.2 Inclusions and exclusions checklist

Inclusions checklist
Exclusions checklist

16.3 Currency conversion rates for US$

16.4 Research methodology

16.5 Data procurement

Information sources

16.6 Data validation

16.7 Validation techniques employed for market sizing

16.8 Data synthesis

16.9 360 degree market analysis

16.10 List of abbreviations

Research Methodology

Technavio presents a detailed picture of the market by way of study, synthesis, and summation of data from multiple sources. The analysts have presented the various facets of the market with a particular focus on identifying the key industry influencers. The data thus presented is comprehensive, reliable, and the result of extensive research, both primary and secondary.

INFORMATION SOURCES

Primary sources

  • Manufacturers and suppliers
  • Channel partners
  • Industry experts
  • Strategic decision makers

Secondary sources

  • Industry journals and periodicals
  • Government data
  • Financial reports of key industry players
  • Historical data
  • Press releases

DATA ANALYSIS

Data Synthesis

  • Collation of data
  • Estimation of key figures
  • Analysis of derived insights

Data Validation

  • Triangulation with data models
  • Reference against proprietary databases
  • Corroboration with industry experts

REPORT WRITING

Qualitative

  • Market drivers
  • Market challenges
  • Market trends
  • Five forces analysis

Quantitative

  • Market size and forecast
  • Market segmentation
  • Geographical insights
  • Competitive landscape

Interested in this report?

Get your sample now to see our research methodology and insights!

Download Now

Frequently Asked Questions

Mobile Middleware market growth will increase by USD 25879.6 million during 2026-2030.

The Mobile Middleware market is expected to grow at a CAGR of 29.2% during 2026-2030.

Mobile Middleware market is segmented by End-user (BFSI, Transportation and logistics, Healthcare, Manufacturing, Others) Deployment (On-premises, Cloud) Type (Software, Services)

Amazon.com Inc., Appian Corp., Axway Software SA, Broadcom Inc., Google LLC, IBM Corp., Magic Software Enterprises Ltd., Mendix Technology BV, Microsoft Corp., Open Text Corp., Oracle Corp., OutSystems Software Rede SA, Pegasystems Inc., Progress Software Corp., Salesforce Inc., SAP SE, ServiceNow Inc., Temenos AG, TIBCO Software Inc., WSO2 Inc. are a few of the key vendors in the Mobile Middleware market.

North America will register the highest growth rate of 38.8% among the other regions. Therefore, the Mobile Middleware market in North America is expected to garner significant business opportunities for the vendors during the forecast period.

US, Canada, Mexico, Germany, UK, France, Italy, Spain, The Netherlands, China, Japan, India, South Korea, Australia, Indonesia, Brazil, Argentina, Colombia, Saudi Arabia, UAE, South Africa, Israel, Turkey

  • Increasing adoption of enterprise mobility and BYOD policies is the driving factor this market.

The Mobile Middleware market vendors should focus on grabbing business opportunities from the End-user segment as it accounted for the largest market share in the base year.
RIA - Research AI Assistant
Ask RIA