Mobile Phone Accessories Market Analysis APAC, North America, Europe, South America, Middle East and Africa - US, Canada, China, India, Brazil - Size and Forecast 2024-2028

Mobile Phone Accessories Market Analysis APAC, North America, Europe, South America, Middle East and Africa - US, Canada, China, India, Brazil - Size and Forecast 2024-2028

Published: Feb 2024 178 Pages SKU: IRTNTR43603

Market Overview at a Glance

$34.21 B
Market Opportunity
5.18%
CAGR
4.28
YoY growth 2023-2024(%)

Mobile Phone Accessories Market Size 2024-2028 

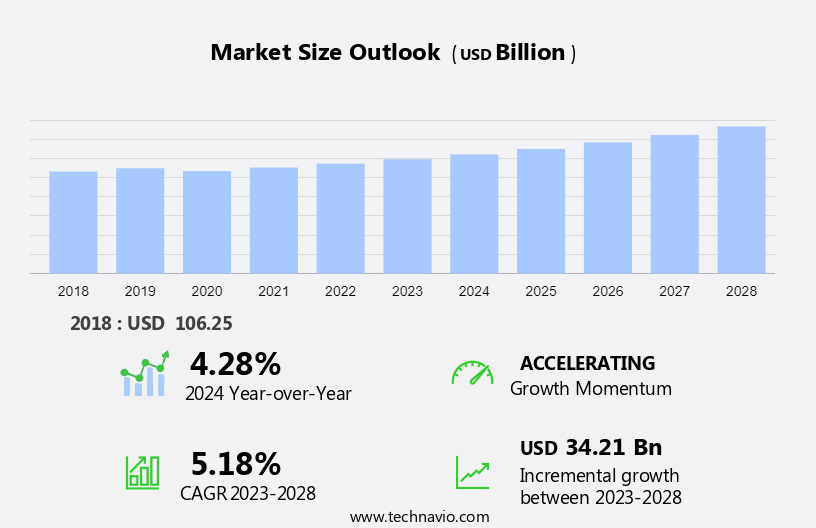
The mobile phone accessories market size is forecast to increase by USD 34.21 billion at a CAGR of 5.18% between 2023 and 2028.

  • The market is experiencing significant growth, driven by several key trends and factors. One major trend is the integration of advanced functionalities in smartphones, leading to an increased demand for complementary accessories such as wireless charging pads, protective cases, and high-quality headphones. Another trend is the increasing focus on improving telecommunication network infrastructure, which necessitates the use of advanced accessories like signal boosters and antenna extenders.
  • The expanding market for counterfeit mobile accessories creates both opportunities and challenges for legitimate businesses. While it reflects strong consumer demand for affordable accessories, it also threatens industry reputation and quality standards.

What will the Mobile Phone Accessories Market Size During the Forecast Period?

Mobile Phone Accessories Market Size

 Request Free Sample

  • The market encompasses a wide range of products, including smartphones, wireless devices, wireless headsets, speakers, power banks, headphones, earphones, smartwatches, and tablets. This market is significantly impacted by supply chain disruptions, which can affect the availability of batteries, chargers, mobile covers, pouches, leather cases, OTG (On-The-Go) smartphones, Bluetooth keyboards, and wireless headphones. The increasing penetration of the internet and the growing popularity of portable devices have fueled the demand for mobile phone accessories.
  • Connectivity and wireless accessories, such as Bluetooth headphones and speakers, have gained popularity due to their convenience and compatibility with various devices. The market is diverse, with both multi-brand and single-brand stores catering to consumers' preferences. The market has also contributed to the demand for high-capacity batteries and storage capacity in mobile phone accessories. Picture quality and music playback are other important factors driving the growth of the market.

How is this market segmented and which is the largest segment?

The market research report provides comprehensive data (region-wise segment analysis), with forecasts and estimates in "USD billion" for the period 2024-2028, as well as historical data from 2018-2022 for the following segments.

  • Distribution Channel
    • Offline
    • Online
  • Product
    • Protective cases
    • Screen protectors
    • Headphones and earphones
    • Wired chargers
    • Power bank and others
  • Geography
    • APAC
      • China
      • India
    • North America
      • Canada
      • US
    • Europe
    • South America
      • Brazil
    • Middle East and Africa

By Distribution Channel Insights

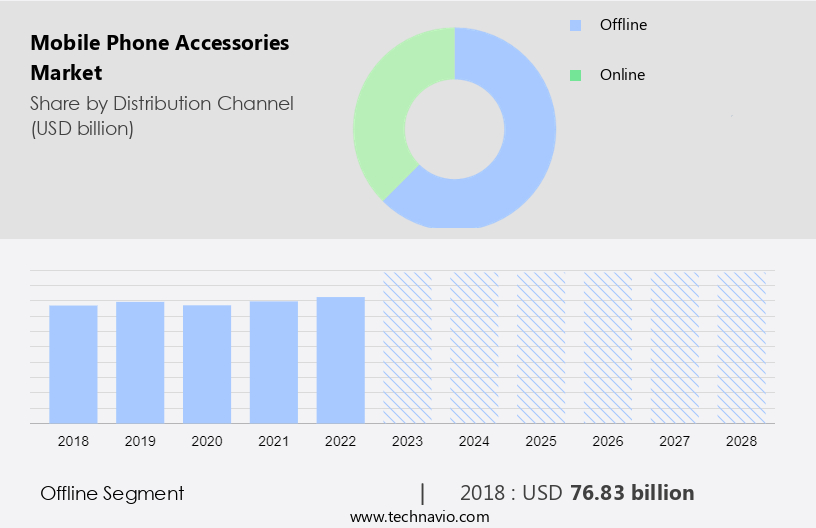
  • The offline segment is estimated to witness significant growth during the forecast period.

The market has experienced significant growth in 2020, with offline distribution channels leading the way. These channels encompass the sale of accessories through retail outlets, including retail stores, hypermarkets, and supermarkets. While retail stores remain the dominant segment, the increasing popularity of these larger retail establishments is anticipated to fuel market expansion during the forecast period. Department stores, in particular, are preferred destinations for premium mobile phone accessories due to their extensive product offerings. Smartphones and wireless devices, such as wireless headsets and speakers, dominate the mobile accessories landscape. However, supply chain disruptions have presented challenges in recent times.

Power banks, headphones, and earphones continue to be popular choices among consumers. The rise of the female consumer group and the headphone segment, in particular, have been noteworthy trends. New product launches, such as the Pixel 7 and Pixel 7 Pro, have driven demand for mobile phone accessories, particularly those related to connectivity, wireless accessories, and portable devices like tablets. Battery life, music quality, picture quality, and storage capacity are key considerations for consumers. The mobile gaming boom has led to the emergence of accessories like Bluetooth joysticks, mobile triggers, and smartphone cooling fans. Online retailing platforms have gained traction due to increasing internet penetration and usage.

Mobile Phone Accessories Market Size

Get a glance at the market report of share of various segments Request Free Sample

The offline segment was valued at USD 76.83 billion in 2018 and showed a gradual increase during the forecast period.

Regional Analysis

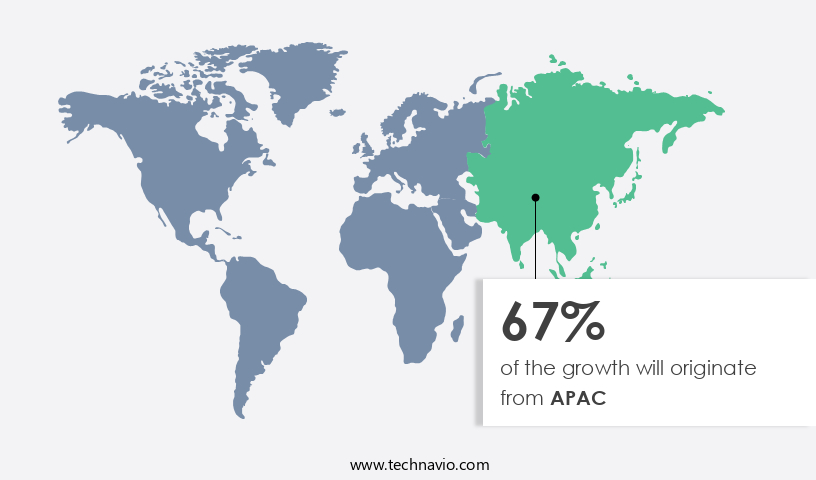
  • APAC is estimated to contribute 67% to the growth of the global market during the forecast period.

Technavio's analysts have elaborately explained the regional trends and drivers that shape the market during the forecast period.

Mobile Phone Accessories Market Share by Geography

For more insights on the market share of various regions, Request Free Sample

The market in APAC is experiencing substantial growth due to several factors. The increasing urban population and rising disposable income have led to a significant increase in demand for tablets, feature phones, and smartphones. This trend is particularly prominent in countries like India, Indonesia, Vietnam, China, Sri Lanka, and Pakistan. The availability of high-end smartphones at competitive prices, coupled with the advancement of technology, has further fueled this demand. Technological advancements, such as 5G, blockchain, cloud services, artificial intelligence, and smart wearable devices, are driving the growth of the consumer electronics industry in APAC. Fashion-conscious consumers in the region are also showing a keen interest in protective cases and other accessories for their devices.

The market for mobile phone accessories is characterized by the presence of both organized stores and independent stores, as well as single-brand stores. The e-commerce industry is playing a significant role in the growth of the market, providing consumers with easy access to a wide range of accessories. However, the lack of standardization in the market poses a challenge, with issues such as piracy and the use of substandard materials being common concerns.

Market Dynamics

Our researchers analyzed the data with 2023 as the base year, along with the key drivers, trends, and challenges. A holistic analysis of drivers will help companies refine their marketing strategies to gain a competitive advantage.

What are the key market drivers leading to the rise in the adoption of the Mobile Phone Accessories Market?

Integration of advanced functionalities in smartphones is the key driver of the market.

  • The market has experienced significant growth in tandem with the increasing popularity of smartphones and wireless devices. With advancements in technology, consumers now seek complementary gadgets to enhance their user experience. For instance, wireless headsets and speakers have gained traction, offering connectivity and portability. However, supply chain disruptions and increasing demand for accessories like protective cases, headphones, and earphones, have posed challenges for manufacturers. Moreover, the emergence of smartwatches, power banks, and other wearable devices, fueled by internet penetration and artificial intelligence, has expanded the market scope. The headphone segment, in particular, has witnessed a boom due to the mobile gaming boom and the preference for low-latency headphones.
  • The launch of flagship devices like the Pixel 7 and Pixel 7 Pro has further fueled demand for accessories, with consumers seeking improved picture quality, storage capacity, and connectivity. The market for wireless accessories, including Bluetooth joysticks, mobile triggers, and smartphone cooling fans, has also gained momentum, catering to the needs of mobile gamers. The rise of online retailing platforms and the convenience of internet usage have facilitated the purchase of accessories, enabling consumers to access music, text messages, and other multimedia content seamlessly. Advancements in technology, such as noise-cancellation technology, Bluetooth/NFC speakers, and selfie sticks, have added value to the market.

What are the market trends shaping the Mobile Phone Accessories Market?

Increasing focus on improving telecommunication network infrastructure is the upcoming trend in the market.

  • The market is experiencing significant growth, driven by advancements in wireless technology and the increasing use of smartphones and other wireless devices for multimedia consumption. Smartphone manufacturers continue to innovate, releasing new models such as the Pixel 7 and Pixel 7 Pro, which support high-speed connectivity and advanced features. This trend is fueling demand for wireless accessories like headphones and speakers, as well as power banks and protective cases. Internet penetration and the mobile gaming boom are also contributing to the market's expansion. Consumers are increasingly relying on their mobile devices for gaming, music, and picture and video viewing, leading to a rise in demand for low-latency headphones, Bluetooth joysticks, and mobile triggers.
  • Additionally, the rise of artificial intelligence and smart gadgets, such as smartwatches and selfie sticks, is driving growth in the market for wireless accessories. However, supply chain disruptions and the ongoing rollout of 5G technology pose challenges for the market. Manufacturers must adapt to meet the demands of consumers for high-speed connectivity and advanced features, while also addressing concerns around battery life, music quality, and storage capacity. Online retailing platforms are playing a crucial role in meeting this demand, offering a wide range of wireless accessories for consumers to choose from. Noise-cancellation technology and Bluetooth/NFC speakers are also popular choices for consumers, particularly in the headphone segment.

Female consumers represent a significant consumer group, with a growing preference for wireless headphones and earphones. Overall, the market is poised for continued growth, driven by advancements in wireless technology and the increasing use of mobile devices for multimedia consumption.

What challenges does Mobile Phone Accessories Market face during the growth?

The growing market for counterfeit mobile accessories is a key challenge affecting the market growth.

  • The global market for mobile phone accessories experiences impeded growth due to the escalating trend of counterfeit accessories among users. A diverse assortment of accessories, encompassing protective cases, screen protectors, power banks, batteries, Bluetooth speakers, and more, are increasingly being peddled in the counterfeit market. This phenomenon is particularly prevalent in emerging economies in Asia Pacific, such as Indonesia, Malaysia, India, and Taiwan, where the preference for affordable products and the ubiquitous availability of counterfeit goods fuel demand. Approximately 18% of the global mobile handsets sold are counterfeits. Smartphones and wireless devices, including wireless headsets and speakers, are the primary drivers of this market.
  • Supply chain disruptions due to counterfeit accessories can adversely impact connectivity and performance. Headphones and earphones, a significant segment, are in high demand, with the latest models like Pixel 7 and Pixel 7 Pro gaining popularity. Power banks, essential for portable devices like tablets and smartphones, are also sought after. Internet penetration and the rise of artificial intelligence have expanded the market's scope. Protective cases cater to the female consumer group, while the headphone segment offers low-latency headphones, Bluetooth joysticks, and mobile triggers for enhanced mobile gaming experiences. Smartphone cooling fans and selfie sticks are other popular accessories. The advent of 5G technology and the proliferation of smart gadgets and smart wearables have further broadened the market.

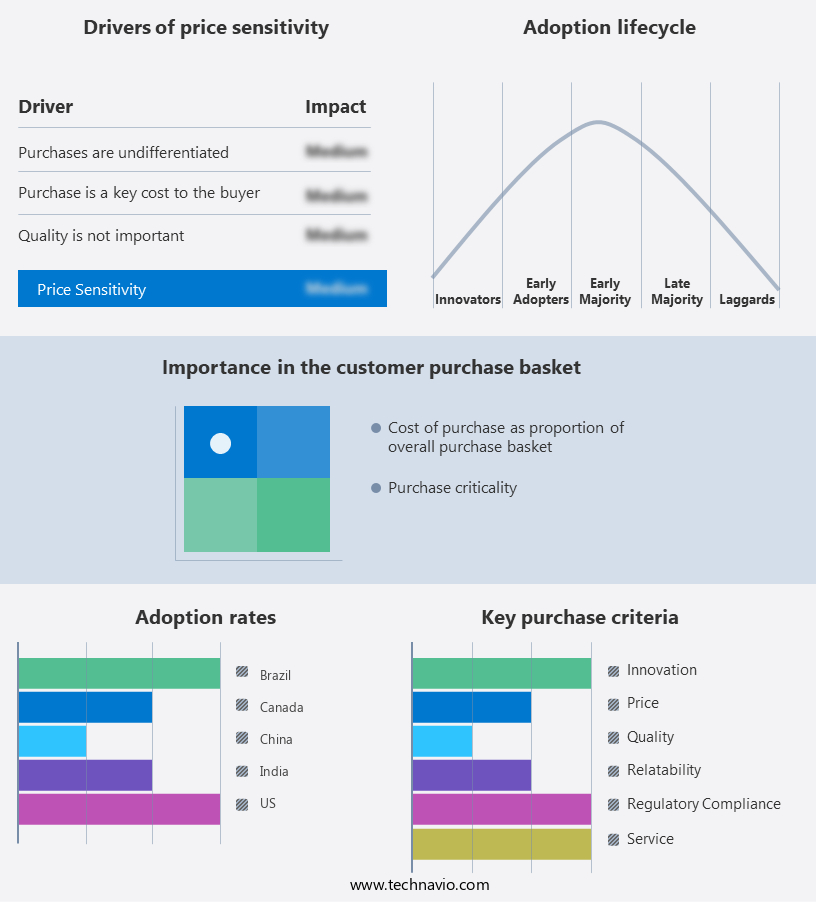
Exclusive Customer Landscape

The market forecasting report includes the adoption lifecycle of the market, covering from the innovator's stage to the laggard's stage. It focuses on adoption rates in different regions based on penetration. Furthermore, the market report also includes key purchase criteria and drivers of price sensitivity to help companies evaluate and develop their market growth analysis strategies.

Mobile Phone Accessories Market Share by Geography

 Customer Landscape

Key Companies & Market Insights

Companies are implementing various strategies, such as strategic alliances, market forecast, partnerships, mergers and acquisitions, geographical expansion, and product/service launches, to enhance their presence in the market. The market research and growth report includes detailed analyses of the competitive landscape of the market and information about key companies, including:

  • Anker Technology UK Ltd.
  • Apple Inc.
  • AUKEY Online
  • Bose Corp.
  • Callmate India Pvt. Ltd.
  • Case Mate Inc.
  • Hon Hai Precision Industry Co. Ltd.
  • HP Inc.
  • Intex Technologies India Ltd.
  • JVCKENWOOD Corp.
  • Koninklijke Philips N.V.
  • LG Electronics Inc.
  • Logitech International SA
  • Panasonic Holdings Corp.
  • Samsung Electronics Co. Ltd.
  • Sennheiser Electronic GmbH and Co. KG
  • Skullcandy Inc.
  • Sony Group Corp.
  • Vinci Brands LLC
  • Xiaomi Communications Co. Ltd.

Qualitative and quantitative analysis of companies has been conducted to help clients understand the wider business environment as well as the strengths and weaknesses of key market players. Data is qualitatively analyzed to categorize companies as pure play, category-focused, industry-focused, and diversified; it is quantitatively analyzed to categorize companies as dominant, leading, strong, tentative, and weak.

Research Analyst Overview

The market is a significant sector, encompassing a wide range of products. Heads, headphones, and protective cases are among the popular accessories in this market. Consumers seek convenience and compatibility with their devices, driving demand for these accessories. Brands offer various designs, materials, and features to cater to diverse preferences. Mobile phone users look for headphones that deliver superior sound quality and comfort. Protective cases are essential to safeguard devices from damage. Brands employ innovative technologies to create sleek, durable cases that enhance the look and feel of mobile phones.

Additionally, mobile phone accessories include power banks, screen protectors, and mounts. Power banks provide an extended battery life, while screen protectors shield the display from scratches and cracks. Mounts enable hands-free usage, making them popular among drivers and multitaskers. The market for mobile phone accessories is dynamic, with constant innovation and competition. Brands focus on creating accessories that offer unique value propositions to consumers. The market is expected to grow as mobile phone usage continues to increase worldwide.

Market Scope

Report Coverage

Details

Page number

178

Base year

2023

Historic period

2018-2022

Forecast period

2024-2028

Growth momentum & CAGR

Accelerate at a CAGR of 5.18%

Market Growth 2024-2028

USD 34.21 billion

Market structure

Fragmented

YoY growth 2023-2024(%)

4.28

Key countries

US, Canada, China, India, and Brazil

Competitive landscape

Leading Companies, Market Positioning of Companies, Competitive Strategies, and Industry Risks

Request Free Sample

What are the Key Data Covered in this Market Research and Growth Report?

  • CAGR of the market during the forecast period
  • Detailed information on factors that will drive the market growth and forecasting between 2024 and 2028
  • Precise estimation of the size of the market  and its contribution of the market in focus to the parent market
  • Accurate predictions about upcoming market growth and trends and changes in consumer behaviour
  • Growth of the market across APAC, North America, Europe, South America, and Middle East and Africa
  • Thorough analysis of the market's competitive landscape and detailed information about companies
  • Comprehensive analysis of factors that will challenge the growth of market companies

We can help! Our analysts can customize this market research report to meet your requirements. Get in touch

1 Executive Summary

  • 1.1 Market overview
    • Exhibit 01: Executive Summary – Chart on Market Overview
    • Exhibit 02: Executive Summary – Data Table on Market Overview
    • Exhibit 03: Executive Summary – Chart on Global Market Characteristics
    • Exhibit 04: Executive Summary – Chart on Market by Geography
    • Exhibit 05: Executive Summary – Chart on Market Segmentation by Distribution Channel
    • Exhibit 06: Executive Summary – Chart on Market Segmentation by Product
    • Exhibit 07: Executive Summary – Chart on Incremental Growth
    • Exhibit 08: Executive Summary – Data Table on Incremental Growth
    • Exhibit 09: Executive Summary – Chart on Vendor Market Positioning

2 Market Landscape

  • 2.1 Market ecosystem
    • Exhibit 10: Parent market
    • Exhibit 11: Market Characteristics

3 Market Sizing

  • 3.1 Market definition
    • Exhibit 12: Offerings of vendors included in the market definition
  • 3.2 Market segment analysis
    • Exhibit 13: Market segments
  • 3.3 Market size 2023
    • 3.4 Market outlook: Forecast for 2023-2028
      • Exhibit 14: Chart on Global - Market size and forecast 2023-2028 ($ billion)
      • Exhibit 15: Data Table on Global - Market size and forecast 2023-2028 ($ billion)
      • Exhibit 16: Chart on Global Market: Year-over-year growth 2023-2028 (%)
      • Exhibit 17: Data Table on Global Market: Year-over-year growth 2023-2028 (%)

    4 Historic Market Size

    • 4.1 Global mobile phone accessories market 2018 - 2022
      • Exhibit 18: Historic Market Size – Data Table on global mobile phone accessories market 2018 - 2022 ($ billion)
    • 4.2 Distribution Channel Segment Analysis 2018 - 2022
      • Exhibit 19: Historic Market Size – Distribution Channel Segment 2018 - 2022 ($ billion)
    • 4.3 Product Segment Analysis 2018 - 2022
      • Exhibit 20: Historic Market Size – Product Segment 2018 - 2022 ($ billion)
    • 4.4 Geography Segment Analysis 2018 - 2022
      • Exhibit 21: Historic Market Size – Geography Segment 2018 - 2022 ($ billion)
    • 4.5 Country Segment Analysis 2018 - 2022
      • Exhibit 22: Historic Market Size – Country Segment 2018 - 2022 ($ billion)

    5 Five Forces Analysis

    • 5.1 Five forces summary
      • Exhibit 23: Five forces analysis - Comparison between 2023 and 2028
    • 5.2 Bargaining power of buyers
      • Exhibit 24: Chart on Bargaining power of buyers – Impact of key factors 2023 and 2028
    • 5.3 Bargaining power of suppliers
      • Exhibit 25: Bargaining power of suppliers – Impact of key factors in 2023 and 2028
    • 5.4 Threat of new entrants
      • Exhibit 26: Threat of new entrants – Impact of key factors in 2023 and 2028
    • 5.5 Threat of substitutes
      • Exhibit 27: Threat of substitutes – Impact of key factors in 2023 and 2028
    • 5.6 Threat of rivalry
      • Exhibit 28: Threat of rivalry – Impact of key factors in 2023 and 2028
    • 5.7 Market condition
      • Exhibit 29: Chart on Market condition - Five forces 2023 and 2028

    6 Market Segmentation by Distribution Channel

    • 6.1 Market segments
      • Exhibit 30: Chart on Distribution Channel - Market share 2023-2028 (%)
      • Exhibit 31: Data Table on Distribution Channel - Market share 2023-2028 (%)
    • 6.2 Comparison by Distribution Channel
      • Exhibit 32: Chart on Comparison by Distribution Channel
      • Exhibit 33: Data Table on Comparison by Distribution Channel
    • 6.3 Offline - Market size and forecast 2023-2028
      • Exhibit 34: Chart on Offline - Market size and forecast 2023-2028 ($ billion)
      • Exhibit 35: Data Table on Offline - Market size and forecast 2023-2028 ($ billion)
      • Exhibit 36: Chart on Offline - Year-over-year growth 2023-2028 (%)
      • Exhibit 37: Data Table on Offline - Year-over-year growth 2023-2028 (%)
    • 6.4 Online - Market size and forecast 2023-2028
      • Exhibit 38: Chart on Online - Market size and forecast 2023-2028 ($ billion)
      • Exhibit 39: Data Table on Online - Market size and forecast 2023-2028 ($ billion)
      • Exhibit 40: Chart on Online - Year-over-year growth 2023-2028 (%)
      • Exhibit 41: Data Table on Online - Year-over-year growth 2023-2028 (%)
    • 6.5 Market opportunity by Distribution Channel
      • Exhibit 42: Market opportunity by Distribution Channel ($ billion)
      • Exhibit 43: Data Table on Market opportunity by Distribution Channel ($ billion)

    7 Market Segmentation by Product

    • 7.1 Market segments
      • Exhibit 44: Chart on Product - Market share 2023-2028 (%)
      • Exhibit 45: Data Table on Product - Market share 2023-2028 (%)
    • 7.2 Comparison by Product
      • Exhibit 46: Chart on Comparison by Product
      • Exhibit 47: Data Table on Comparison by Product
    • 7.3 Protective cases - Market size and forecast 2023-2028
      • Exhibit 48: Chart on Protective cases - Market size and forecast 2023-2028 ($ billion)
      • Exhibit 49: Data Table on Protective cases - Market size and forecast 2023-2028 ($ billion)
      • Exhibit 50: Chart on Protective cases - Year-over-year growth 2023-2028 (%)
      • Exhibit 51: Data Table on Protective cases - Year-over-year growth 2023-2028 (%)
    • 7.4 Screen protectors - Market size and forecast 2023-2028
      • Exhibit 52: Chart on Screen protectors - Market size and forecast 2023-2028 ($ billion)
      • Exhibit 53: Data Table on Screen protectors - Market size and forecast 2023-2028 ($ billion)
      • Exhibit 54: Chart on Screen protectors - Year-over-year growth 2023-2028 (%)
      • Exhibit 55: Data Table on Screen protectors - Year-over-year growth 2023-2028 (%)
    • 7.5 Headphones and earphones - Market size and forecast 2023-2028
      • Exhibit 56: Chart on Headphones and earphones - Market size and forecast 2023-2028 ($ billion)
      • Exhibit 57: Data Table on Headphones and earphones - Market size and forecast 2023-2028 ($ billion)
      • Exhibit 58: Chart on Headphones and earphones - Year-over-year growth 2023-2028 (%)
      • Exhibit 59: Data Table on Headphones and earphones - Year-over-year growth 2023-2028 (%)
    • 7.6 Wired chargers - Market size and forecast 2023-2028
      • Exhibit 60: Chart on Wired chargers - Market size and forecast 2023-2028 ($ billion)
      • Exhibit 61: Data Table on Wired chargers - Market size and forecast 2023-2028 ($ billion)
      • Exhibit 62: Chart on Wired chargers - Year-over-year growth 2023-2028 (%)
      • Exhibit 63: Data Table on Wired chargers - Year-over-year growth 2023-2028 (%)
    • 7.7 Power bank and others - Market size and forecast 2023-2028
      • Exhibit 64: Chart on Power bank and others - Market size and forecast 2023-2028 ($ billion)
      • Exhibit 65: Data Table on Power bank and others - Market size and forecast 2023-2028 ($ billion)
      • Exhibit 66: Chart on Power bank and others - Year-over-year growth 2023-2028 (%)
      • Exhibit 67: Data Table on Power bank and others - Year-over-year growth 2023-2028 (%)
    • 7.8 Market opportunity by Product
      • Exhibit 68: Market opportunity by Product ($ billion)
      • Exhibit 69: Data Table on Market opportunity by Product ($ billion)

    8 Customer Landscape

    • 8.1 Customer landscape overview
      • Exhibit 70: Analysis of price sensitivity, lifecycle, customer purchase basket, adoption rates, and purchase criteria

    9 Geographic Landscape

    • 9.1 Geographic segmentation
      • Exhibit 71: Chart on Market share by geography 2023-2028 (%)
      • Exhibit 72: Data Table on Market share by geography 2023-2028 (%)
    • 9.2 Geographic comparison
      • Exhibit 73: Chart on Geographic comparison
      • Exhibit 74: Data Table on Geographic comparison
    • 9.3 APAC - Market size and forecast 2023-2028
      • Exhibit 75: Chart on APAC - Market size and forecast 2023-2028 ($ billion)
      • Exhibit 76: Data Table on APAC - Market size and forecast 2023-2028 ($ billion)
      • Exhibit 77: Chart on APAC - Year-over-year growth 2023-2028 (%)
      • Exhibit 78: Data Table on APAC - Year-over-year growth 2023-2028 (%)
    • 9.4 North America - Market size and forecast 2023-2028
      • Exhibit 79: Chart on North America - Market size and forecast 2023-2028 ($ billion)
      • Exhibit 80: Data Table on North America - Market size and forecast 2023-2028 ($ billion)
      • Exhibit 81: Chart on North America - Year-over-year growth 2023-2028 (%)
      • Exhibit 82: Data Table on North America - Year-over-year growth 2023-2028 (%)
    • 9.5 Europe - Market size and forecast 2023-2028
      • Exhibit 83: Chart on Europe - Market size and forecast 2023-2028 ($ billion)
      • Exhibit 84: Data Table on Europe - Market size and forecast 2023-2028 ($ billion)
      • Exhibit 85: Chart on Europe - Year-over-year growth 2023-2028 (%)
      • Exhibit 86: Data Table on Europe - Year-over-year growth 2023-2028 (%)
    • 9.6 South America - Market size and forecast 2023-2028
      • Exhibit 87: Chart on South America - Market size and forecast 2023-2028 ($ billion)
      • Exhibit 88: Data Table on South America - Market size and forecast 2023-2028 ($ billion)
      • Exhibit 89: Chart on South America - Year-over-year growth 2023-2028 (%)
      • Exhibit 90: Data Table on South America - Year-over-year growth 2023-2028 (%)
    • 9.7 Middle East and Africa - Market size and forecast 2023-2028
      • Exhibit 91: Chart on Middle East and Africa - Market size and forecast 2023-2028 ($ billion)
      • Exhibit 92: Data Table on Middle East and Africa - Market size and forecast 2023-2028 ($ billion)
      • Exhibit 93: Chart on Middle East and Africa - Year-over-year growth 2023-2028 (%)
      • Exhibit 94: Data Table on Middle East and Africa - Year-over-year growth 2023-2028 (%)
    • 9.8 China - Market size and forecast 2023-2028
      • Exhibit 95: Chart on China - Market size and forecast 2023-2028 ($ billion)
      • Exhibit 96: Data Table on China - Market size and forecast 2023-2028 ($ billion)
      • Exhibit 97: Chart on China - Year-over-year growth 2023-2028 (%)
      • Exhibit 98: Data Table on China - Year-over-year growth 2023-2028 (%)
    • 9.9 India - Market size and forecast 2023-2028
      • Exhibit 99: Chart on India - Market size and forecast 2023-2028 ($ billion)
      • Exhibit 100: Data Table on India - Market size and forecast 2023-2028 ($ billion)
      • Exhibit 101: Chart on India - Year-over-year growth 2023-2028 (%)
      • Exhibit 102: Data Table on India - Year-over-year growth 2023-2028 (%)
    • 9.10 US - Market size and forecast 2023-2028
      • Exhibit 103: Chart on US - Market size and forecast 2023-2028 ($ billion)
      • Exhibit 104: Data Table on US - Market size and forecast 2023-2028 ($ billion)
      • Exhibit 105: Chart on US - Year-over-year growth 2023-2028 (%)
      • Exhibit 106: Data Table on US - Year-over-year growth 2023-2028 (%)
    • 9.11 Brazil - Market size and forecast 2023-2028
      • Exhibit 107: Chart on Brazil - Market size and forecast 2023-2028 ($ billion)
      • Exhibit 108: Data Table on Brazil - Market size and forecast 2023-2028 ($ billion)
      • Exhibit 109: Chart on Brazil - Year-over-year growth 2023-2028 (%)
      • Exhibit 110: Data Table on Brazil - Year-over-year growth 2023-2028 (%)
    • 9.12 Canada - Market size and forecast 2023-2028
      • Exhibit 111: Chart on Canada - Market size and forecast 2023-2028 ($ billion)
      • Exhibit 112: Data Table on Canada - Market size and forecast 2023-2028 ($ billion)
      • Exhibit 113: Chart on Canada - Year-over-year growth 2023-2028 (%)
      • Exhibit 114: Data Table on Canada - Year-over-year growth 2023-2028 (%)
    • 9.13 Market opportunity by geography
      • Exhibit 115: Market opportunity by geography ($ billion)
      • Exhibit 116: Data Tables on Market opportunity by geography ($ billion)

    10 Drivers, Challenges, and Trends

    • 10.1 Market drivers
      • 10.2 Market challenges
        • 10.3 Impact of drivers and challenges
          • Exhibit 117: Impact of drivers and challenges in 2023 and 2028
        • 10.4 Market trends

          11 Vendor Landscape

          • 11.1 Overview
            • 11.2 Vendor landscape
              • Exhibit 118: Overview on Criticality of inputs and Factors of differentiation
            • 11.3 Landscape disruption
              • Exhibit 119: Overview on factors of disruption
            • 11.4 Industry risks
              • Exhibit 120: Impact of key risks on business

            12 Vendor Analysis

            • 12.1 Vendors covered
              • Exhibit 121: Vendors covered
            • 12.2 Market positioning of vendors
              • Exhibit 122: Matrix on vendor position and classification
            • 12.3 Anker Technology UK Ltd.
              • Exhibit 123: Anker Technology UK Ltd. - Overview
              • Exhibit 124: Anker Technology UK Ltd. - Product / Service
              • Exhibit 125: Anker Technology UK Ltd. - Key offerings
            • 12.4 Apple Inc.
              • Exhibit 126: Apple Inc. - Overview
              • Exhibit 127: Apple Inc. - Business segments
              • Exhibit 128: Apple Inc. - Key news
              • Exhibit 129: Apple Inc. - Key offerings
              • Exhibit 130: Apple Inc. - Segment focus
            • 12.5 AUKEY Online
              • Exhibit 131: AUKEY Online - Overview
              • Exhibit 132: AUKEY Online - Product / Service
              • Exhibit 133: AUKEY Online - Key offerings
            • 12.6 Bose Corp.
              • Exhibit 134: Bose Corp. - Overview
              • Exhibit 135: Bose Corp. - Product / Service
              • Exhibit 136: Bose Corp. - Key news
              • Exhibit 137: Bose Corp. - Key offerings
            • 12.7 Callmate India Pvt. Ltd.
              • Exhibit 138: Callmate India Pvt. Ltd. - Overview
              • Exhibit 139: Callmate India Pvt. Ltd. - Product / Service
              • Exhibit 140: Callmate India Pvt. Ltd. - Key offerings
            • 12.8 Hon Hai Precision Industry Co. Ltd.
              • Exhibit 141: Hon Hai Precision Industry Co. Ltd. - Overview
              • Exhibit 142: Hon Hai Precision Industry Co. Ltd. - Product / Service
              • Exhibit 143: Hon Hai Precision Industry Co. Ltd. - Key offerings
            • 12.9 JVCKENWOOD Corp.
              • Exhibit 144: JVCKENWOOD Corp. - Overview
              • Exhibit 145: JVCKENWOOD Corp. - Business segments
              • Exhibit 146: JVCKENWOOD Corp. - Key offerings
              • Exhibit 147: JVCKENWOOD Corp. - Segment focus
            • 12.10 Koninklijke Philips N.V.
              • Exhibit 148: Koninklijke Philips N.V. - Overview
              • Exhibit 149: Koninklijke Philips N.V. - Business segments
              • Exhibit 150: Koninklijke Philips N.V. - Key news
              • Exhibit 151: Koninklijke Philips N.V. - Key offerings
              • Exhibit 152: Koninklijke Philips N.V. - Segment focus
            • 12.11 LG Electronics Inc.
              • Exhibit 153: LG Electronics Inc. - Overview
              • Exhibit 154: LG Electronics Inc. - Product / Service
              • Exhibit 155: LG Electronics Inc. - Key offerings
            • 12.12 Logitech International SA
              • Exhibit 156: Logitech International SA - Overview
              • Exhibit 157: Logitech International SA - Business segments
              • Exhibit 158: Logitech International SA - Key news
              • Exhibit 159: Logitech International SA - Key offerings
              • Exhibit 160: Logitech International SA - Segment focus
            • 12.13 Panasonic Holdings Corp.
              • Exhibit 161: Panasonic Holdings Corp. - Overview
              • Exhibit 162: Panasonic Holdings Corp. - Product / Service
              • Exhibit 163: Panasonic Holdings Corp. - Key news
              • Exhibit 164: Panasonic Holdings Corp. - Key offerings
            • 12.14 Samsung Electronics Co. Ltd.
              • Exhibit 165: Samsung Electronics Co. Ltd. - Overview
              • Exhibit 166: Samsung Electronics Co. Ltd. - Business segments
              • Exhibit 167: Samsung Electronics Co. Ltd. - Key news
              • Exhibit 168: Samsung Electronics Co. Ltd. - Key offerings
              • Exhibit 169: Samsung Electronics Co. Ltd. - Segment focus
            • 12.15 Sennheiser Electronic GmbH and Co. KG
              • Exhibit 170: Sennheiser Electronic GmbH and Co. KG - Overview
              • Exhibit 171: Sennheiser Electronic GmbH and Co. KG - Business segments
              • Exhibit 172: Sennheiser Electronic GmbH and Co. KG - Key news
              • Exhibit 173: Sennheiser Electronic GmbH and Co. KG - Key offerings
              • Exhibit 174: Sennheiser Electronic GmbH and Co. KG - Segment focus
            • 12.16 Sony Group Corp.
              • Exhibit 175: Sony Group Corp. - Overview
              • Exhibit 176: Sony Group Corp. - Business segments
              • Exhibit 177: Sony Group Corp. - Key news
              • Exhibit 178: Sony Group Corp. - Key offerings
              • Exhibit 179: Sony Group Corp. - Segment focus
            • 12.17 Vinci Brands LLC
              • Exhibit 180: Vinci Brands LLC - Overview
              • Exhibit 181: Vinci Brands LLC - Product / Service
              • Exhibit 182: Vinci Brands LLC - Key offerings

            13 Appendix

            • 13.1 Scope of the report
              • 13.2 Inclusions and exclusions checklist
                • Exhibit 183: Inclusions checklist
                • Exhibit 184: Exclusions checklist
              • 13.3 Currency conversion rates for US$
                • Exhibit 185: Currency conversion rates for US$
              • 13.4 Research methodology
                • Exhibit 186: Research methodology
                • Exhibit 187: Validation techniques employed for market sizing
                • Exhibit 188: Information sources
              • 13.5 List of abbreviations
                • Exhibit 189: List of abbreviations

              Research Methodology

              Technavio presents a detailed picture of the market by way of study, synthesis, and summation of data from multiple sources. The analysts have presented the various facets of the market with a particular focus on identifying the key industry influencers. The data thus presented is comprehensive, reliable, and the result of extensive research, both primary and secondary.

              INFORMATION SOURCES

              Primary sources

              • Manufacturers and suppliers
              • Channel partners
              • Industry experts
              • Strategic decision makers

              Secondary sources

              • Industry journals and periodicals
              • Government data
              • Financial reports of key industry players
              • Historical data
              • Press releases

              DATA ANALYSIS

              Data Synthesis

              • Collation of data
              • Estimation of key figures
              • Analysis of derived insights

              Data Validation

              • Triangulation with data models
              • Reference against proprietary databases
              • Corroboration with industry experts

              REPORT WRITING

              Qualitative

              • Market drivers
              • Market challenges
              • Market trends
              • Five forces analysis

              Quantitative

              • Market size and forecast
              • Market segmentation
              • Geographical insights
              • Competitive landscape

              Interested in this report?

              Get your sample now to see our research methodology and insights!

              Download Now

              Frequently Asked Questions

              Mobile Phone Accessories market growth will increase by $ 34.21 bn during 2024-2028 .

              The Mobile Phone Accessories market is expected to grow at a CAGR of 5.18% during 2024-2028 .

              Mobile Phone Accessories market is segmented by Distribution Channel( Offline, Online, Headphones and earphones, Wired Chargers, Others) Product( Protective cases, Screen protectors, Headphones and earphones, Wired chargers, Power bank and others)

              Anker Technology UK Ltd., Apple Inc., AUKEY Online, Bose Corp., Callmate India Pvt. Ltd., Case Mate Inc., Hon Hai Precision Industry Co. Ltd., HP Inc., Intex Technologies India Ltd., JVCKENWOOD Corp., Koninklijke Philips N.V., LG Electronics Inc., Logitech International SA, Panasonic Holdings Corp., Samsung Electronics Co. Ltd., Sennheiser Electronic GmbH and Co. KG, Skullcandy Inc., Sony Group Corp., Vinci Brands LLC, Xiaomi Communications Co. Ltd. are a few of the key vendors in the Mobile Phone Accessories market.

              APAC will register the highest growth rate of 67% among the other regions. Therefore, the Mobile Phone Accessories market in APAC is expected to garner significant business opportunities for the vendors during the forecast period.

              US, Canada, China, India, Brazil

              • Integration of advanced functionalities in smartphonesThe competition in the global smartphone market has intensified in recent years. Therefore is the driving factor this market.
              • smartphone manufacturers are focusing on integrating innovative features and technologies in their products to stay competitive in the market. For instance is the driving factor this market.
              • Apple is the driving factor this market.
              • an American multinational technology company that focuses on developing premium consumer electronics products is the driving factor this market.
              • launched the iPhone 15 Pro and iPhone 15 Pro Max in September 2023 is the driving factor this market.
              • which incorporate LiDAR scanner that enables advanced AR experiences is the driving factor this market.
              • including improved AR object placement is the driving factor this market.
              • better depth sensing is the driving factor this market.
              • and more. Such latest innovations will allow users to employ their devices for several applications is the driving factor this market.
              • such as taking high-definition videos and selfies is the driving factor this market.
              • accessing mobile applications quickly is the driving factor this market.
              • and playing high-definition games. All these activities will generate the demand for accessories such as power banks is the driving factor this market.
              • earphones is the driving factor this market.
              • headphones is the driving factor this market.
              • protective cases is the driving factor this market.
              • screen protectors is the driving factor this market.
              • and others to use smartphones in effective ways is the driving factor this market.
              • triggering the growth of the global mobile phone accessories market during the forecast period. is the driving factor this market.

              The Mobile Phone Accessories market vendors should focus on grabbing business opportunities from the Offline segment as it accounted for the largest market share in the base year.