
Mobile Power Generation Equipment Rentals Market Size 2025-2029
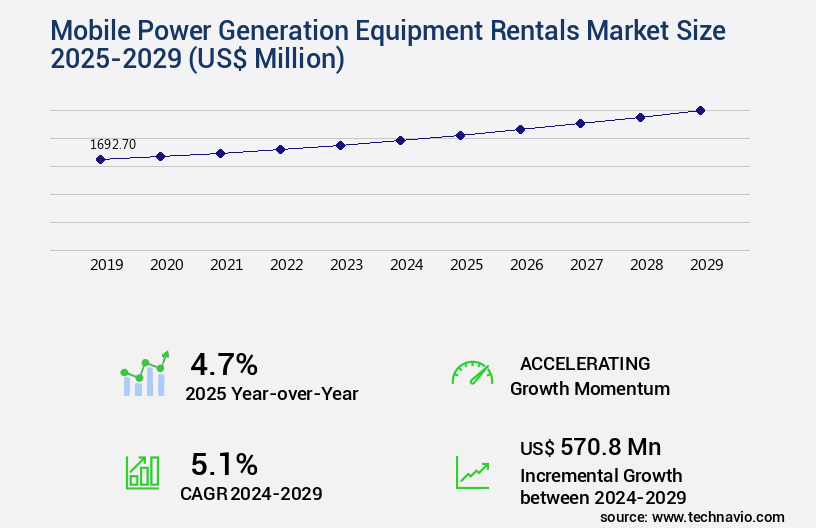
The mobile power generation equipment rentals market size is valued to increase USD 570.8 million, at a CAGR of 5.1% from 2024 to 2029. Increasing infrastructural activities will drive the mobile power generation equipment rentals market.
Major Market Trends & Insights
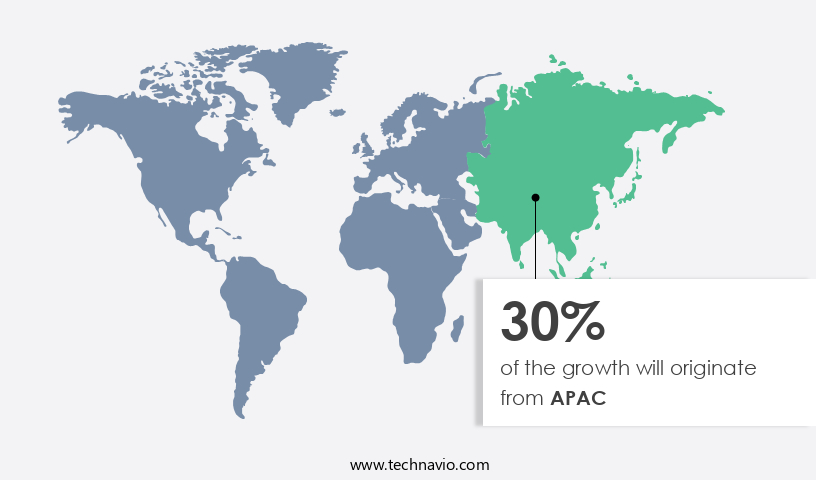
- APAC dominated the market and accounted for a 30% growth during the forecast period.
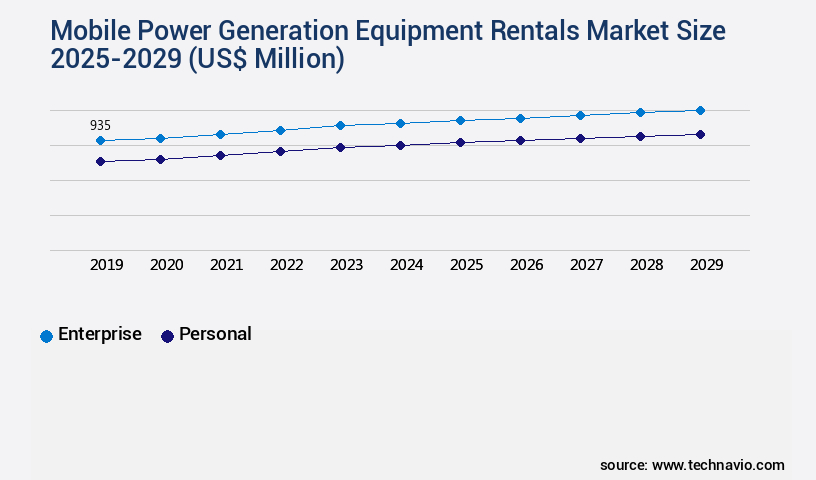
- By Application - Enterprise segment was valued at USD 935.00 million in 2023
- By Product - Generator segment accounted for the largest market revenue share in 2023
Market Size & Forecast
- Market Opportunities: USD 53.87 million
- Market Future Opportunities: USD 570.80 million
- CAGR from 2024 to 2029 : 5.1%
Market Summary
- The market is a dynamic and evolving sector, characterized by the continuous adoption of advanced technologies and shifting market trends. Core technologies, such as fuel cells and lithium-ion batteries, are gaining traction due to their efficiency and environmental sustainability. Applications in various industries, including construction, oil and gas, and disaster recovery, are driving market growth. Service types, including rental and lease, are becoming increasingly popular due to their flexibility and cost-effectiveness. Regulations, such as emissions standards, are influencing the market's direction.
- For instance, the shift to gas generators is on the rise, accounting for over 40% of the market share, due to their lower emissions compared to diesel generators. However, increasing competition from microgrids and energy storage systems presents challenges for market players. These trends underscore the ongoing evolution of the market and its potential for growth and innovation.
What will be the Size of the Mobile Power Generation Equipment Rentals Market during the forecast period?
Get Key Insights on Market Forecast (PDF) Request Free Sample
How is the Mobile Power Generation Equipment Rentals Market Segmented ?
The mobile power generation equipment rentals industry research report provides comprehensive data (region-wise segment analysis), with forecasts and estimates in "USD million" for the period 2025-2029, as well as historical data from 2019-2023 for the following segments.
- Application
- Enterprise
- Personal
- Product
- Generator
- Turbine
- Power Rating
- Up to 50 kW
- 51 kW to 500 kW
- Above 500 kW
- End-user
- Construction industry
- Oil and gas industry
- Mining industry
- Geography
- North America
- US
- Canada
- Europe
- UK
- Middle East and Africa
- South Africa
- UAE
- APAC
- China
- India
- Japan
- South America
- Brazil
- Rest of World (ROW)
- North America
By Application Insights
The enterprise segment is estimated to witness significant growth during the forecast period.
Mobile power generation equipment rentals have gained significant traction in various industries as businesses seek flexible and cost-effective solutions for their short-term or remote power requirements. According to recent market reports, the enterprise segment holds the largest revenue share in this market, accounting for approximately 45% of the total rentals in 2024. Construction sites, large-scale events, and data centers are among the primary enterprise applications for mobile power generation equipment rentals. These industries rely on portable generators to ensure operational efficiency and maintain uninterrupted power supply. For instance, construction companies use diesel generator rentals at off-grid job sites, event planners rent backup power solutions for large-scale events, and data centers rely on mobile power solutions for maintenance and emergency power needs.
The market for mobile power generation equipment rentals is expected to grow substantially in the coming years, with an estimated 30% of businesses planning to increase their usage of rental power systems. Furthermore, the adoption of advanced technologies, such as remote diagnostics, power outage mitigation, and preventive maintenance, is driving the demand for mobile power generation equipment rentals. Power system design, power distribution systems, and equipment uptime are critical factors that businesses consider when renting power generation equipment. Fuel consumption rates, power system reliability, and rental service agreements are also essential aspects of the rental process.
Equipment lifecycle management, generator maintenance, and load bank testing are crucial for ensuring the optimal performance and longevity of the rented equipment. Gas generator rentals are another popular choice for businesses due to their fuel efficiency and lower emissions. Fuel management systems and emission control systems are increasingly being integrated into rental power contracts to address environmental concerns and improve overall efficiency. In conclusion, the market is a dynamic and evolving industry that caters to the diverse power needs of businesses across various sectors. The flexibility, cost-effectiveness, and scalability of rental alternatives make them an attractive option for businesses seeking reliable power solutions without making significant upfront investments.
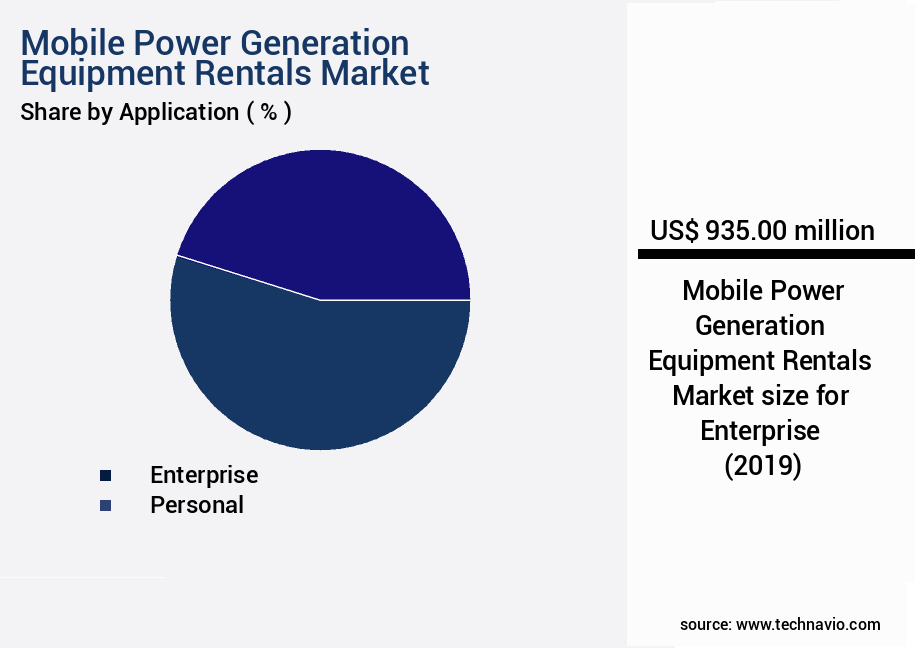
The Enterprise segment was valued at USD 935.00 million in 2019 and showed a gradual increase during the forecast period.
Regional Analysis
APAC is estimated to contribute 30% to the growth of the global market during the forecast period.Technavio’s analysts have elaborately explained the regional trends and drivers that shape the market during the forecast period.
See How Mobile Power Generation Equipment Rentals Market Demand is Rising in APAC Request Free Sample
Mobile power generation equipment rentals have gained significant traction in North America due to the increasing vulnerability of utility grids and the need for continuous electric supply. The US, in particular, has seen a surge in demand for these solutions, driven by frequent power outages. Weather-related power outages and natural disasters are leading causes of power disruptions in the country. For instance, California experiences a high number of power outages, and the trend is on the rise. The aging power infrastructure in the US has exposed the need for alternative backup power solutions, making mobile power generation equipment rentals an attractive option.
These rentals provide temporary power solutions during power outages, ensuring business continuity and mitigating potential losses. As a professional in the industry, I can attest to the growing importance of mobile power generation equipment rentals in the US market.
Market Dynamics
Our researchers analyzed the data with 2024 as the base year, along with the key drivers, trends, and challenges. A holistic analysis of drivers will help companies refine their marketing strategies to gain a competitive advantage.
The market is a critical sector that caters to diverse applications, from temporary power systems for large-scale events to backup power solutions for industrial facilities and critical operations. Diesel generator rental pricing models vary based on power capacity, location, and duration of usage. In designing temporary power systems, considerations include emergency power generator maintenance schedules and mobile power generation equipment transportation logistics. Power capacity planning for large-scale events necessitates optimizing generator fuel efficiency through strategies like preventive maintenance protocols and fuel management systems. Rental power contracts for construction projects often include power distribution system design for remote locations, noise reduction techniques for mobile generators, and gas generator emission compliance regulations.
More than 70% of rental power system configurations cater to diverse applications, including industrial facilities, data centers, hospitals, and disaster relief efforts. A significant portion of these applications prioritize power system reliability assessment for critical operations, with a minority of players focusing on high-end, customized solutions. Adoption rates for remote monitoring of mobile power generation equipment are significantly higher in industrial applications compared to academic or research settings. This trend reflects the need for real-time data access and predictive maintenance in industrial settings. Power outage mitigation plans for industrial facilities and backup power solutions for data centers and hospitals are essential components of business continuity strategies.
In conclusion, the market is a dynamic and essential sector that addresses diverse power generation needs. Its growth is driven by increasing demand for reliable power sources, advancements in generator technology, and the need for cost-effective, flexible power solutions.
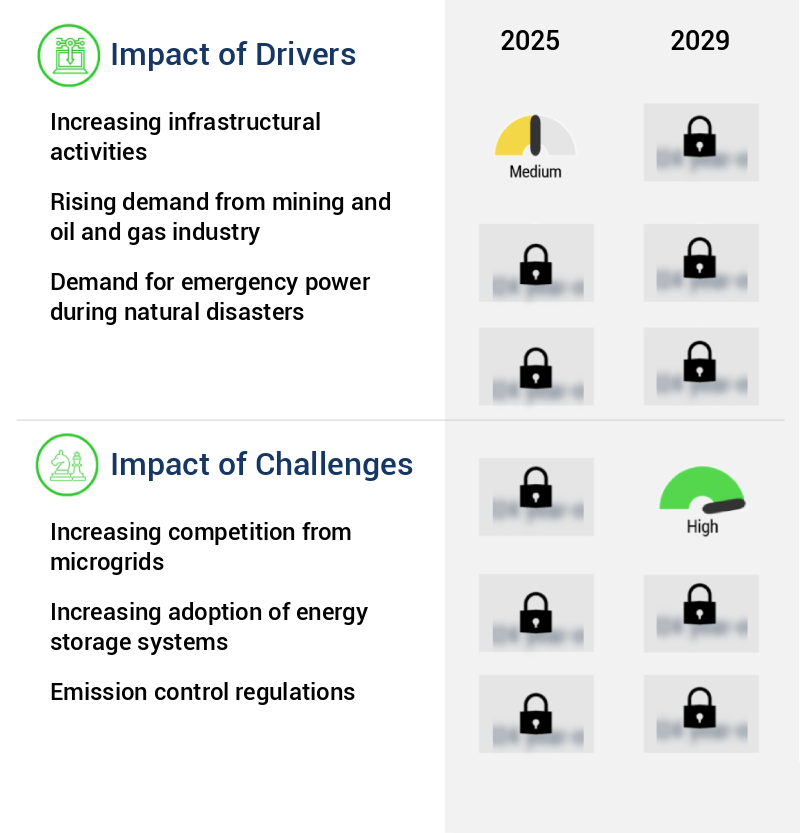
What are the key market drivers leading to the rise in the adoption of Mobile Power Generation Equipment Rentals Industry?
- The surge in infrastructure development activities serves as the primary catalyst for market growth.
- Infrastructural development continues to be a significant driver of economic growth worldwide, with ongoing projects in engineering, maintenance, and management sectors. These initiatives span various sectors, including both government and non-government entities. Power is a crucial element in these operations, necessitating reliable and efficient solutions. In particular, mobile power solutions have gained traction due to their cost-effectiveness and flexibility. They are ideal for temporary power requirements, such as maintenance activities or events like concerts and sports events. The global market for mobile power solutions is witnessing a dynamic landscape, with ongoing advancements in technology and increasing demand for sustainable power solutions.
- The adoption of renewable energy sources, such as solar and wind power, is a notable trend, contributing to the growth of this market. Additionally, the integration of energy storage systems is enhancing the efficiency and reliability of mobile power solutions. Overall, the market for mobile power solutions is poised for continued expansion, offering significant opportunities for businesses and investors.
What are the market trends shaping the Mobile Power Generation Equipment Rentals Industry?
- Shifting to gas generators is becoming a prevalent trend in the market. This transition signifies a significant development in energy production.
- Natural gas, an economical and efficient fuel from the non-renewable energy sector, is widely used in power generation. In 2023, natural gas-fueled combined cycle power plants remained a substantial contributor to electricity generation. In the US, natural gas surpassed other energy sources, providing nearly 43% of the country's electricity. The capacity utilization rate for combined cycle gas turbine (CCGT) plants has seen an upward trend due to operational efficiency enhancements. By 2023, the average capacity factor for CCGT plants had reached approximately 57%.
- This growth underscores the significant role natural gas plays in the evolving energy landscape. As a professional, it's essential to recognize the continuous advancements and applications of natural gas in various sectors, making it an indispensable resource in the power generation industry.
What challenges does the Mobile Power Generation Equipment Rentals Industry face during its growth?
- The expansion of microgrids represents a significant challenge to the industry's growth, as these decentralized energy systems increasingly compete with traditional power providers.
- In various sectors, mobile power generation systems serve essential functions as prime, standby, and backup power solutions. However, these systems encounter growing competition from microgrids, which have gained traction as a response to inconsistent grid infrastructure. Microgrids represent a small-scale power generation and storage system, capable of operating in both grid-connected (hybrid microgrids) and island modes. Their prevalence is driven by their ability to provide continuous power, thereby reducing the reliance on mobile power generation systems.
- Microgrids' adoption is particularly significant in countries with unstable power grids, where they help mitigate frequent power outages. By integrating both generation and storage resources, microgrids offer a more reliable power solution, making them an increasingly attractive alternative to mobile power generation systems.
Exclusive Technavio Analysis on Customer Landscape
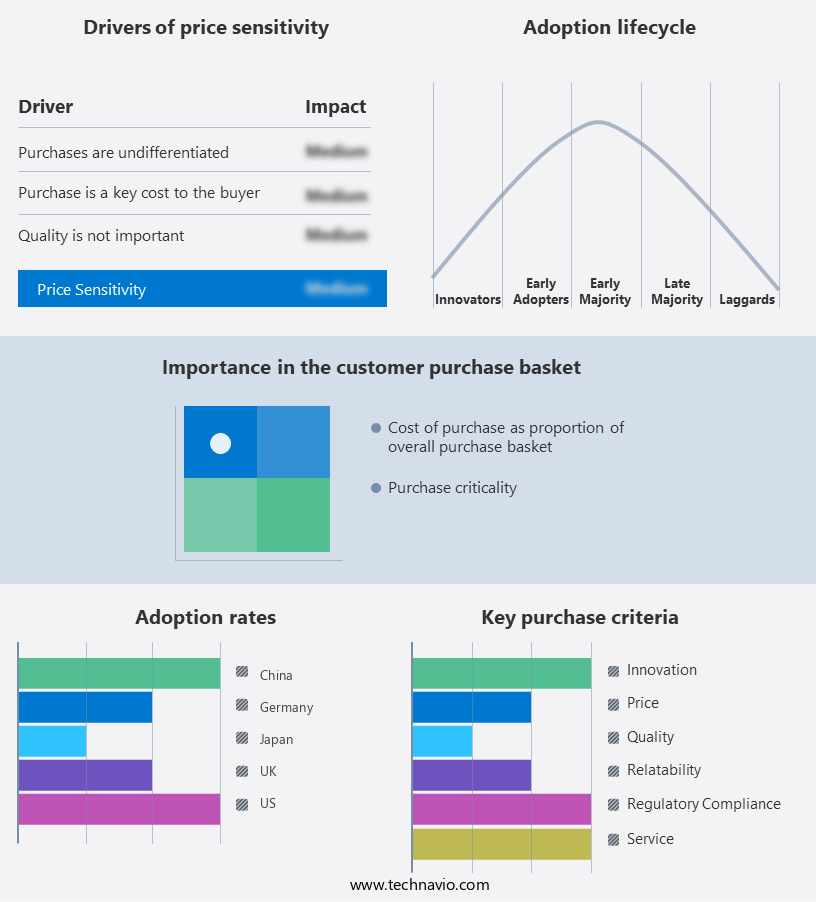
The mobile power generation equipment rentals market forecasting report includes the adoption lifecycle of the market, covering from the innovator’s stage to the laggard’s stage. It focuses on adoption rates in different regions based on penetration. Furthermore, the mobile power generation equipment rentals market report also includes key purchase criteria and drivers of price sensitivity to help companies evaluate and develop their market growth analysis strategies.
Customer Landscape of Mobile Power Generation Equipment Rentals Industry
Competitive Landscape
Companies are implementing various strategies, such as strategic alliances, mobile power generation equipment rentals market forecast, partnerships, mergers and acquisitions, geographical expansion, and product/service launches, to enhance their presence in the industry.
Aggreko Plc - This company specializes in providing mobile power generation equipment rentals, encompassing diesel, gas, and hybrid solutions. Their offerings cater to various energy needs, ensuring reliability and efficiency. The company's expertise lies in delivering power solutions to diverse industries and applications.
The industry research and growth report includes detailed analyses of the competitive landscape of the market and information about key companies, including:
- Aggreko Plc
- Alta Equipment Group Inc.
- APR Energy
- Ashtead Group Plc
- Atlas Copco AB
- ATLAS Corp.
- BigRentz Inc.
- Caterpillar Inc.
- Cummins Inc.
- Generac Power Systems Inc.
- Herc Holdings Inc.
- Himoinsa
- Multiquip Inc.
- PowerPlus
- RPC Inc.
- Siemens AG
- The Taylor Group Inc.
- United Rentals Inc.
- Wacker Neuson SE
Qualitative and quantitative analysis of companies has been conducted to help clients understand the wider business environment as well as the strengths and weaknesses of key industry players. Data is qualitatively analyzed to categorize companies as pure play, category-focused, industry-focused, and diversified; it is quantitatively analyzed to categorize companies as dominant, leading, strong, tentative, and weak.
Recent Development and News in Mobile Power Generation Equipment Rentals Market
- In January 2024, Caterpillar Inc. Announced the launch of its new line of rental power generators, the Caterpillar Solar-Diesel Hybrid Generator Sets. These innovative products combine solar and diesel power, reducing fuel consumption and emissions for customers in the construction and event industries (Caterpillar Press Release, 2024).
- In March 2024, APR Energy, a leading provider of fast-track power projects, entered into a strategic partnership with Doosan Portable Power to expand its rental fleet with Doosan's portable power generators. This collaboration aims to strengthen APR Energy's presence in the North American market (APR Energy Press Release, 2024).
- In May 2024, Generac Holdings Inc. Completed the acquisition of Neighborly Brands, a portfolio of home services brands, including DR Power Equipment, a leading provider of mobile power generation equipment rentals. This acquisition is expected to enhance Generac's presence in the rental market and expand its product offerings (Generac Holdings Inc. SEC Filing, 2024).
- In April 2025, the European Union passed the new Renewable Energy Directive, which mandates a 42% renewable energy target for the EU by 2030. This policy change is expected to increase the demand for mobile power generation equipment rentals with renewable energy capabilities (European Parliament Press Release, 2025).
Dive into Technavio’s robust research methodology, blending expert interviews, extensive data synthesis, and validated models for unparalleled Mobile Power Generation Equipment Rentals Market insights. See full methodology.
|
Market Scope |
|
|
Report Coverage |
Details |
|
Page number |
232 |
|
Base year |
2024 |
|
Historic period |
2019-2023 |
|
Forecast period |
2025-2029 |
|
Growth momentum & CAGR |
Accelerate at a CAGR of 5.1% |
|
Market growth 2025-2029 |
USD 570.8 million |
|
Market structure |
Fragmented |
|
YoY growth 2024-2025(%) |
4.7 |
|
Key countries |
US, Canada, China, Japan, Saudi Arabia, India, Brazil, UAE, UK, and South Africa |
|
Competitive landscape |
Leading Companies, Market Positioning of Companies, Competitive Strategies, and Industry Risks |
Research Analyst Overview
- The market is a dynamic and evolving sector, characterized by the continuous adoption of advanced technologies and innovative solutions. Diesel generator rentals remain a popular choice for backup power solutions and mobile power applications, with rental contract terms varying based on power output capacity, fuel consumption rates, and equipment uptime requirements. In response to the growing demand for more efficient and reliable power systems, market participants are increasingly focusing on power system design, power distribution systems, and preventive maintenance. Remote diagnostics and power monitoring systems enable early fault detection and proactive maintenance, while remote power monitoring and load bank testing ensure optimal performance and power system reliability.
- Mobile power solutions, including both diesel and gas generator rentals, are increasingly being used to mitigate power outages and support temporary power needs. Fuel efficiency metrics and emission control systems are becoming essential considerations, with many rental providers offering fuel management systems to optimize fuel consumption and reduce noise levels. Equipment lifecycle management and generator maintenance are crucial aspects of the rental service agreements, with many providers offering comprehensive maintenance programs and safety protocols to ensure the longevity and reliability of their rental fleets. Power capacity planning and generator sizing calculations are essential components of effective power system design, with rental providers offering expertise and guidance to help clients select the right equipment for their specific needs.
- Power distribution efficiency and equipment transport are also critical factors in the market. Rental power contracts often include provisions for generator installation and removal, as well as generator rental fleet management and emergency power rentals for unexpected power outages. In conclusion, the market is a dynamic and evolving sector, with a focus on advanced technologies, innovative solutions, and efficient power systems. From power system design and power distribution systems to preventive maintenance and fuel management, rental providers are continually adapting to meet the changing needs of their clients.
What are the Key Data Covered in this Mobile Power Generation Equipment Rentals Market Research and Growth Report?
-
What is the expected growth of the Mobile Power Generation Equipment Rentals Market between 2025 and 2029?
-
USD 570.8 million, at a CAGR of 5.1%
-
-
What segmentation does the market report cover?
-
The report segmented by Application (Enterprise and Personal), Product (Generator and Turbine), Power Rating (Up to 50 kW, 51 kW to 500 kW, and Above 500 kW), End-user (Construction industry, Oil and gas industry, and Mining industry), and Geography (North America, APAC, Middle East and Africa, Europe, and South America)
-
-
Which regions are analyzed in the report?
-
North America, APAC, Middle East and Africa, Europe, and South America
-
-
What are the key growth drivers and market challenges?
-
Increasing infrastructural activities, Increasing competition from microgrids
-
-
Who are the major players in the Mobile Power Generation Equipment Rentals Market?
-
Key Companies Aggreko Plc, Alta Equipment Group Inc., APR Energy, Ashtead Group Plc, Atlas Copco AB, ATLAS Corp., BigRentz Inc., Caterpillar Inc., Cummins Inc., Generac Power Systems Inc., Herc Holdings Inc., Himoinsa, Multiquip Inc., PowerPlus, RPC Inc., Siemens AG, The Taylor Group Inc., United Rentals Inc., and Wacker Neuson SE
-
Market Research Insights
- The market encompasses the provision of on-site power solutions for various applications, including emergency power needs and power system upgrades. Two key aspects of this market are fuel type selection and power system integration. According to industry estimates, mobile generator sets accounted for over 70% of the market share in 2020, with natural gas and diesel being the most common fuel types. In contrast, renewable fuel-powered generator sets, such as those using solar or wind energy, accounted for approximately 30%. Power rental services offer a range of rental agreement options, including short-term and long-term contracts, to cater to diverse customer requirements.
- Power system performance, safety regulations compliance, and power distribution networks are crucial considerations in the selection and integration of mobile power generation equipment. Additionally, power equipment decommissioning, equipment delivery scheduling, power supply reliability, and rental power pricing are significant factors influencing market trends. Remote monitoring tools and power system optimization are increasingly adopted to enhance performance and reduce operating costs. Power system upgrades, site surveys, and power system automation are other essential aspects of the market, with generator maintenance contracts, power equipment insurance, generator operating costs, environmental impact assessments, generator testing procedures, and noise level compliance being key concerns for customers.
We can help! Our analysts can customize this mobile power generation equipment rentals market research report to meet your requirements.
 RIA -
RIA - 
