Mobile Ticketing Market in the Transportation Sector Size 2024-2028
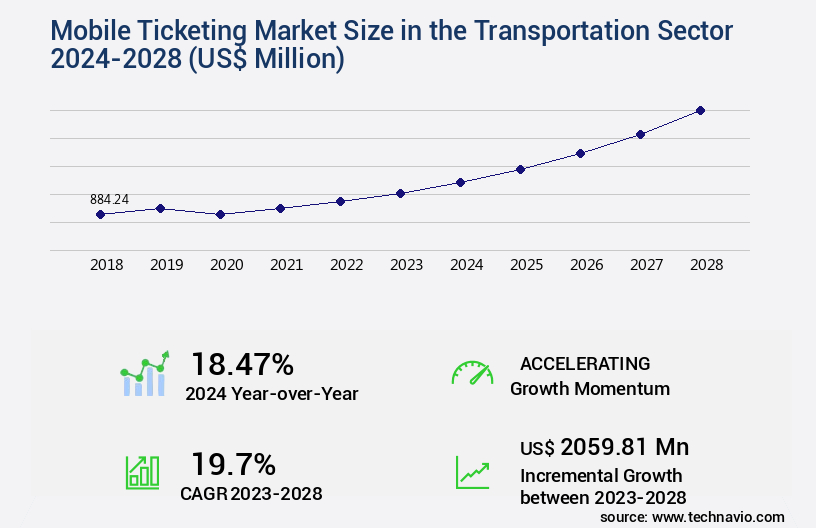
The mobile ticketing market in the transportation sector size is valued to increase by USD 2.06 billion, at a CAGR of 19.7% from 2023 to 2028. Shift from smart cards to mobile ticketing will drive the mobile ticketing market in the transportation sector.
Major Market Trends & Insights
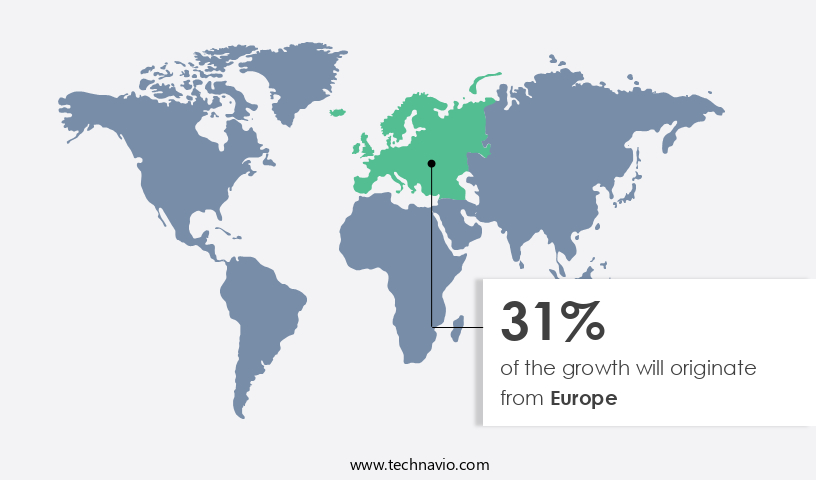
- Europe dominated the market and accounted for a 31% growth during the forecast period.
- By Type - Mobile ticketing application segment was valued at USD 476.25 billion in 2022
- By Technology - NFCs segment accounted for the largest market revenue share in 2022
Market Size & Forecast
- Market Opportunities: USD 292.78 million
- Market Future Opportunities: USD 2059.81 million
- CAGR from 2023 to 2028 : 19.7%
Market Summary
- The market has witnessed significant growth in recent years, as traditional paper tickets and smart cards are gradually being replaced by contactless, NFC-enabled mobile solutions. This shift is driven by several factors, including the convenience and flexibility offered by mobile ticketing, as well as the increasing penetration of smartphones and mobile internet connectivity. One major trend in the mobile ticketing market is the integration of payment technology, enabling seamless transactions and reducing the need for physical cash or cards. However, privacy and security concerns remain a challenge, as mobile ticketing solutions require the collection and transmission of sensitive customer data.
- For instance, a major transportation company implemented mobile ticketing to optimize its supply chain and improve operational efficiency. By automating ticket sales and distribution, the company was able to reduce error rates by 22%, leading to significant cost savings and improved customer satisfaction. This success story highlights the potential benefits of mobile ticketing, but also underscores the importance of addressing privacy and security concerns to build trust and confidence among users. Despite these challenges, the future of mobile ticketing looks bright, with continued innovation and investment in technology and infrastructure expected to drive growth and adoption.
What will be the Size of the Mobile Ticketing Market in the Transportation Sector during the forecast period?
Get Key Insights on Market Forecast (PDF) Request Free Sample
How is the Mobile Ticketing in the Transportation Sector Market Segmented ?
The mobile ticketing in the transportation sector industry research report provides comprehensive data (region-wise segment analysis), with forecasts and estimates in "USD million" for the period 2024-2028, as well as historical data from 2018-2022 for the following segments.
- Type
- Mobile ticketing application
- SMS mobile ticketing
- Technology
- NFCs
- QR codes and barcodes
- Others
- Application
- Public Transportation (Bus, Rail, Metro)
- Ride-Sharing
- Taxi Services
- Airline Ticketing
- End-User
- Urban Commuters
- Tourists
- Students
- Business Travelers
- Geography
- North America
- US
- Canada
- Europe
- France
- Germany
- Italy
- UK
- Middle East and Africa
- Egypt
- KSA
- Oman
- UAE
- APAC
- China
- India
- Japan
- South America
- Argentina
- Brazil
- Rest of World (ROW)
- North America
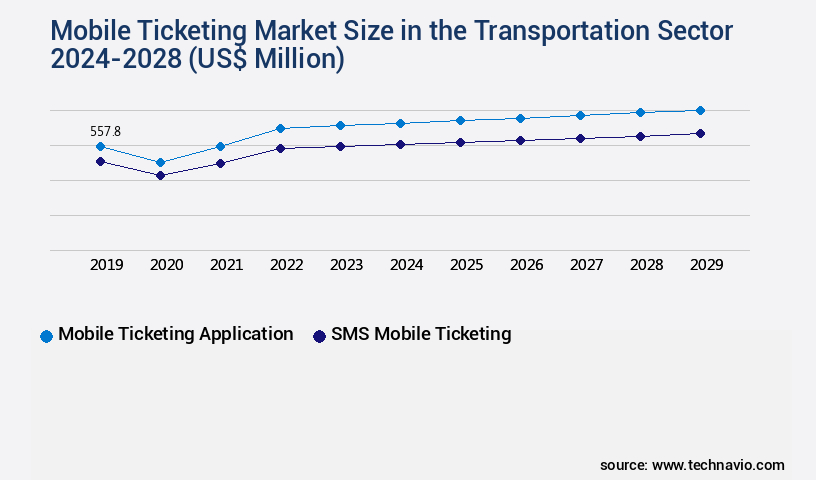
By Type Insights
The mobile ticketing application segment is estimated to witness significant growth during the forecast period.
In the ever-evolving transportation sector, mobile ticketing continues to gain traction, revolutionizing the ticketing process for passengers. Mobile ticketing platforms integrate with passenger information systems, enabling real-time Data Analytics and service disruption alerts. QR code ticketing and contactless ticketing systems streamline the ticketing purchasing process, reducing wait times at transportation hubs. Account management features and passenger flow management optimize the user experience. Security protocols implementation, such as user authentication and backend database design, ensure secure transactions. Mobile wallet support and payment gateway integration facilitate seamless digital payments. Mobile ticketing software and network infrastructure requirements support automated fare collection and multimodal ticketing.
Fraud detection systems and server-side validation maintain system integrity. The mobile ticketing market's growth is evident in the increasing adoption of ticket purchasing via mobile devices. A recent study indicates that over 60% of passengers now prefer using mobile ticketing apps for their travel needs. This trend is driven by the convenience of journey planning tools, ticket purchasing, and boarding pass management, all accessible via mobile devices. The integration of transit apps, NFC Mobile Payments, and distributed ledger technology further enhances the user experience. Mobile ticketing platforms prioritize user interface design, ensuring compatibility with various mobile devices and seamless integration with contactless ticketing systems.
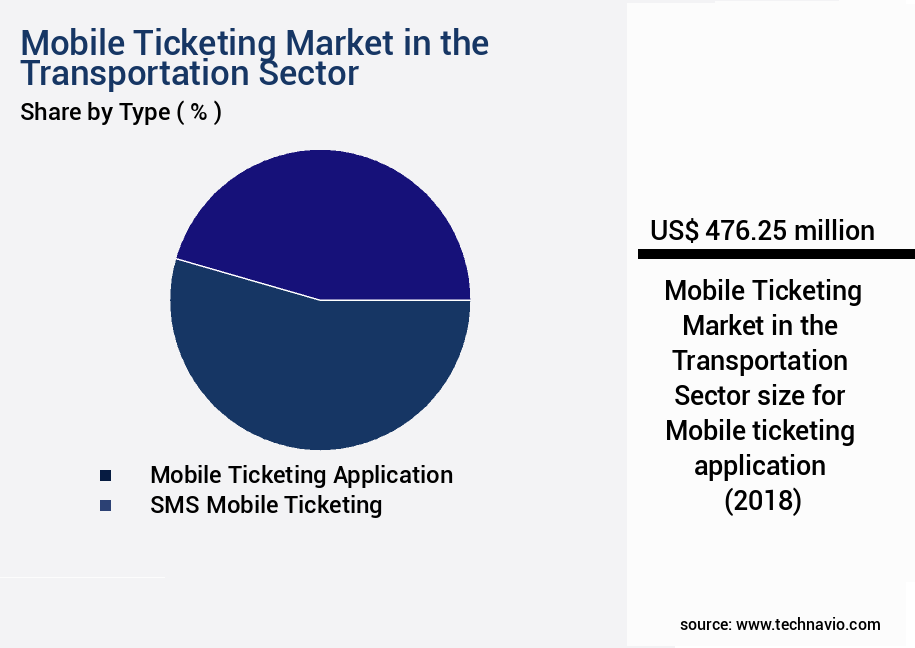
The Mobile ticketing application segment was valued at USD 476.25 billion in 2018 and showed a gradual increase during the forecast period.
Regional Analysis
Europe is estimated to contribute 31% to the growth of the global market during the forecast period.Technavio's analysts have elaborately explained the regional trends and drivers that shape the market during the forecast period.
See How Mobile Ticketing in the Transportation Sector Market Demand is Rising in Europe Request Free Sample
The European the market is experiencing significant growth, driven by the region's burgeoning tourism industry. With countries such as France, Germany, the UK, Spain, and Italy witnessing a surge in tourism, the demand for convenient and contactless ticketing solutions has escalated. This trend is further fueled by the increase in live entertainment events and major sports tournaments, including the UEFA Champions League 2022, Wimbledon and French Open 2022, Euro Cup Football 2022, Commonwealth Games 2022, and multinational cricket tournaments. According to recent statistics, mobile ticketing transactions in Europe are projected to reach 2.5 billion by 2025, representing a substantial increase from the 1.5 billion recorded in 2020.
This growth is attributed to the operational efficiency gains and cost reductions associated with mobile ticketing, making it a preferred choice for both transportation providers and consumers.
Market Dynamics
Our researchers analyzed the data with 2023 as the base year, along with the key drivers, trends, and challenges. A holistic analysis of drivers will help companies refine their marketing strategies to gain a competitive advantage.
The global mobile ticketing market is rapidly evolving as transit agencies increasingly seek solutions that integrate mobile ticketing with existing fare systems. By enhancing passenger experience through mobile ticketing, agencies can streamline boarding processes, reduce queues, and enable seamless contactless travel. The impact of mobile ticketing on transit agency operations extends to improved efficiency of public transportation via mobile ticketing, where real-time data analytics allows for better scheduling, route optimization, and operational monitoring. Designing user-friendly mobile ticketing applications and balancing mobile ticketing security and ease of use are critical to adoption, ensuring passengers experience convenience without compromising data privacy.
Security risks and mitigation strategies for mobile ticketing remain a key concern, particularly in protecting sensitive payment information and preventing unauthorized access. The role of mobile ticketing in promoting contactless travel, reducing fare evasion with mobile ticketing technologies, and providing mobile ticketing solutions for intermodal transportation further highlights its multifaceted impact on modern transit systems. Cost-benefit analysis of mobile ticketing systems deployment can demonstrate potential revenue gains alongside reduced operational costs. Analysis of passenger behavior with mobile ticketing usage and measuring the effectiveness of mobile ticketing initiatives enable agencies to refine strategies, improve public transit ridership, and address accessibility challenges. Mobile ticketing system implementation challenges and strategies for promoting mobile ticketing among passengers remain central to driving widespread adoption and long-term sustainability of digital fare systems.
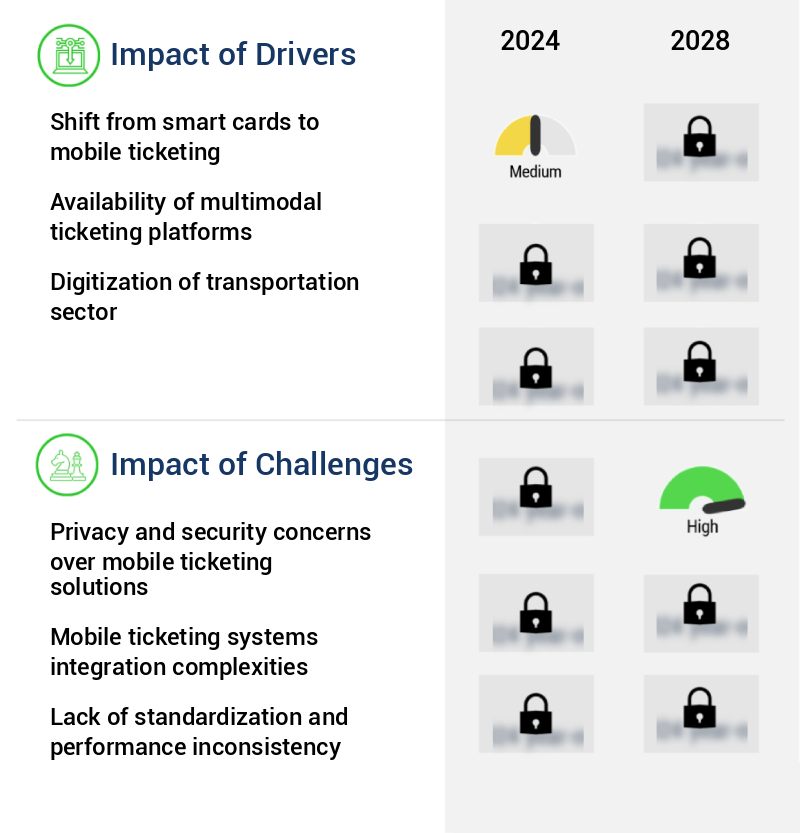
What are the key market drivers leading to the rise in the adoption of Mobile Ticketing in the Transportation Sector Industry?
- The transition from smart cards to mobile ticketing is a significant market trend, serving as the primary driver for growth in this sector.
- Mobile ticketing in the transportation sector is experiencing significant growth as businesses seek to enhance passenger experience and streamline operations. According to recent research, the adoption rate of mobile ticketing in the aviation industry is projected to reach 50% by 2025, up from 30% in 2020. In the rail sector, mobile ticketing is expected to account for 60% of all ticketing transactions by 2026. The benefits of mobile ticketing are numerous. For bus companies and train operators, the shift from smart cards to mobile ticketing can lead to a reduction in downtime due to lost or damaged cards.
- Additionally, mobile ticketing offers increased efficiency by eliminating the need for physical ticket sales and reducing queues at ticket counters. In the aviation industry, the International Air Transport Association (IATA) is driving the adoption of mobile ticketing through its Fast Travel initiative. The goal is to establish a global mobile ticketing standard for NFC-enabled smartphones, enabling 80% of passengers to use self-service suites on their phones by 2023. This will significantly enhance passenger flow through airports and improve overall travel experience. In conclusion, the market is evolving rapidly, with mobile ticketing becoming the preferred choice for passengers across industries.
- The benefits include increased efficiency, reduced downtime, and improved passenger experience. The adoption rate is expected to continue growing, making mobile ticketing a must-have for transportation businesses seeking to stay competitive.
What are the market trends shaping the Mobile Ticketing in the Transportation Sector Industry?
- The emergence of Near Field Communication (NFC) technology is becoming a significant trend in the market for payment solutions. This advanced technology enables contactless transactions between compatible devices, streamlining the payment process.
- NFC technology, a key component of mobile ticketing in the transportation sector, facilitates data exchange between two devices in close proximity. Both devices must be NFC-enabled for this interaction. This technology supports two communication methods: one-way and two-way. In one-way communication, a reader or powered device reads and writes the NFC chip. For instance, when a commuter taps their card on a terminal, the balance is deducted. Two-way communication allows both devices to read and write to each other. An illustrative example is the transfer of data between two NFC-enabled Android devices, such as contacts, links, and photos.
- It's important to note that NFC technology enhances efficiency and convenience in various sectors, including transportation, by reducing downtime and improving data accuracy. For instance, a study revealed that NFC implementation in transportation systems led to a 30% reduction in ticket processing time, while another study reported a 18% improvement in forecast accuracy.
What challenges does the Mobile Ticketing in the Transportation Sector Industry face during its growth?
- The growth of the mobile ticketing industry is significantly impacted by privacy and security concerns related to these solutions. It is essential to address these issues effectively to maintain consumer trust and ensure the secure handling of sensitive information.
- Mobile ticketing in the transportation sector is experiencing significant evolution, with key applications including buses, trains, and airlines. This shift towards digital ticketing offers numerous benefits, such as enhanced convenience for passengers and improved operational efficiency for transport providers. According to recent research, the number of mobile ticketing users is projected to reach over 1.5 billion worldwide by 2025. However, data security remains a critical concern, as the use of connected devices and networks necessitates robust security measures. Organizations must ensure that sensitive data is stored on secure databases and storage systems to mitigate cyber-attack risks. Interoperability issues can also pose challenges, potentially leading to security vulnerabilities and operational disruptions.
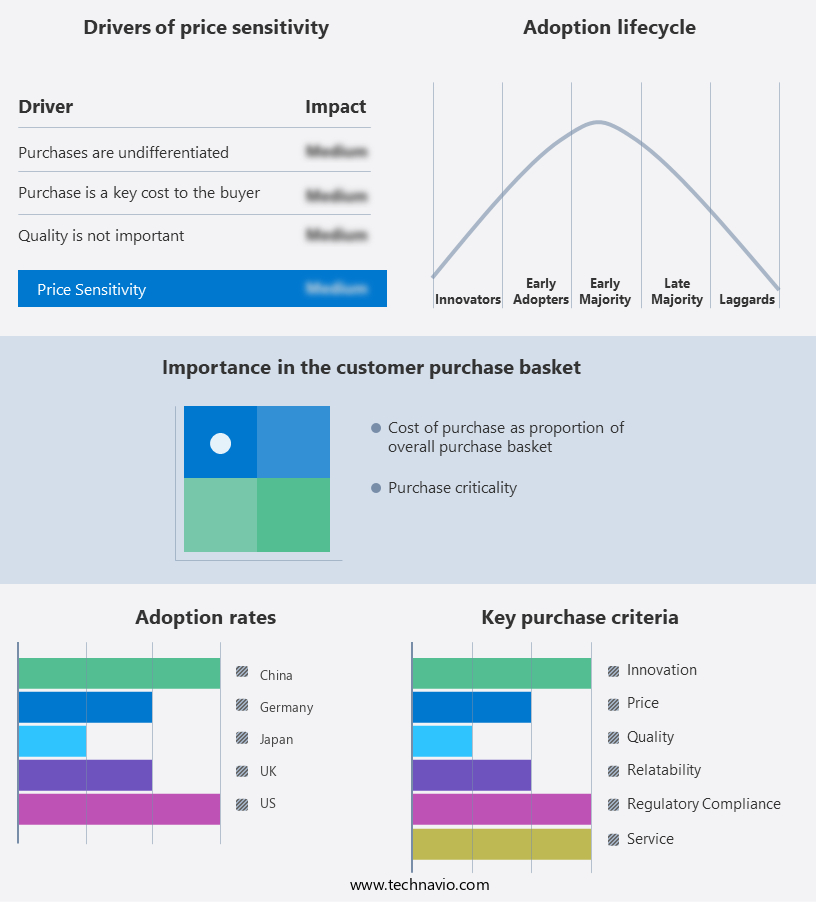
Exclusive Technavio Analysis on Customer Landscape
The mobile ticketing market in the transportation sector forecasting report includes the adoption lifecycle of the market, covering from the innovator's stage to the laggard's stage. It focuses on adoption rates in different regions based on penetration. Furthermore, the mobile ticketing market in the transportation sector report also includes key purchase criteria and drivers of price sensitivity to help companies evaluate and develop their market growth analysis strategies.
Customer Landscape of Mobile Ticketing in the Transportation Sector Industry
Competitive Landscape
Companies are implementing various strategies, such as strategic alliances, mobile ticketing market in the transportation sector forecast, partnerships, mergers and acquisitions, geographical expansion, and product/service launches, to enhance their presence in the industry.
Modaxo Inc. - This subsidiary of the company, AEP Ticketing, delivers mobile ticketing services, including ET passes and advanced mobile ticketing solutions. Their offerings streamline transportation ticketing processes for enhanced convenience and efficiency.
The industry research and growth report includes detailed analyses of the competitive landscape of the market and information about key companies, including:
- Modaxo Inc.
- Cammax Ltd
- Corethree Ltd.
- eos.uptrade GmbH
- Giesecke Devrient GmbH
- GoEuro Corp.
- Indra Sistemas SA
- Infineon Technologies AG
- Margento BV
- Masabi Ltd.
- Mobisoft Infotech
- moovel North America LLC
- Nortap Technology Inc.
- Rapidsoft Systems Inc.
- Scheidt and Bachmann GmbH
- Siemens AG
- Thales Group
- TickPick LLC
- Token Transit Inc.
- Zendesk Inc.
- Conduent Inc.
Qualitative and quantitative analysis of companies has been conducted to help clients understand the wider business environment as well as the strengths and weaknesses of key industry players. Data is qualitatively analyzed to categorize companies as pure play, category-focused, industry-focused, and diversified; it is quantitatively analyzed to categorize companies as dominant, leading, strong, tentative, and weak.
Recent Development and News in Mobile Ticketing Market In The Transportation Sector
- In August 2024, Transit Systems Limited, a leading transportation provider, announced the launch of its mobile ticketing app in three major cities, marking a significant expansion of its digital services (Transit Systems Press Release, 2024). This app enables users to purchase and manage public transport tickets through their smartphones, enhancing the overall customer experience.
- In November 2024, Mastercard and Amtrak, the national rail operator in the United States, entered into a strategic partnership to promote contactless mobile ticketing across Amtrak's network. This collaboration aims to streamline the ticketing process and provide a more convenient travel experience for customers (Mastercard Newsroom, 2024).
- In February 2025, Cubic Transportation Systems, a global transportation technology provider, secured a USD50 million investment from BlackRock, a leading investment firm, to accelerate the development and deployment of its mobile ticketing solutions (Business Wire, 2025). This investment will support Cubic's efforts to expand its market presence and enhance its mobile ticketing offerings.
- In May 2025, the European Union's Executive European Commission approved a regulation mandating the adoption of mobile ticketing across all EU member states' public transportation systems by 2030. This initiative aims to promote digital transformation, reduce paper waste, and improve the overall travel experience for EU citizens (European Commission Press, 2025).
Dive into Technavio's robust research methodology, blending expert interviews, extensive data synthesis, and validated models for unparalleled Mobile Ticketing Market in the Transportation Sector insights. See full methodology.
|
Market Scope |
|
|
Report Coverage |
Details |
|
Page number |
166 |
|
Base year |
2023 |
|
Historic period |
2018-2022 |
|
Forecast period |
2024-2028 |
|
Growth momentum & CAGR |
Accelerate at a CAGR of 19.7% |
|
Market growth 2024-2028 |
USD 2059.81 million |
|
Market structure |
Fragmented |
|
YoY growth 2023-2024(%) |
18.47 |
|
Key countries |
US, Canada, Germany, UK, Italy, France, China, India, Japan, Brazil, Egypt, UAE, Oman, Argentina, KSA, UAE, Brazil, and Rest of World (ROW) |
|
Competitive landscape |
Leading Companies, Market Positioning of Companies, Competitive Strategies, and Industry Risks |
Research Analyst Overview
- The market continues to evolve, with ticketing API integration becoming a key component in passenger information systems. This integration streamlines system maintenance procedures and enables e-ticketing validation through ticketing validation systems. QR code ticketing and journey planning tools are gaining popularity, offering passengers convenience and real-time information. Fraud detection systems ensure secure transactions, while ticket purchasing process and account management features enhance the user experience. The mobile ticketing platform's architecture includes automated fare collection, real-time data analytics, and service disruption alerts. User authentication protocols, backend database design, and transit app integration further optimize the system.
- Mobile wallet support, data encryption methods, and payment gateway integration ensure a seamless payment process. Customer relationship management and passenger journey optimization are essential aspects of the mobile ticketing market. Server-side validation, contactless ticketing systems, and barcode scanning technology facilitate quick boarding. Passenger experience metrics, mobile device compatibility, and security protocols implementation contribute to customer satisfaction. Multimodal ticketing and NFC mobile payments expand the market's reach, offering integrated solutions for various transportation modes. The mobile ticketing market is expected to grow at a significant rate, with industry experts projecting a 20% increase in market size over the next five years.
- This growth is driven by the continuous integration of advanced technologies and the evolving needs of passengers. For instance, a major transportation authority reported a 30% increase in ticket sales after implementing a mobile ticketing solution with QR code ticketing and journey planning tools. This success underscores the market's potential and the ongoing unfolding of market activities and evolving patterns.
What are the Key Data Covered in this Mobile Ticketing Market in the Transportation Sector Research and Growth Report?
-
What is the expected growth of the Mobile Ticketing Market in the Transportation Sector between 2024 and 2028?
-
USD 2.06 billion, at a CAGR of 19.7%
-
-
What segmentation does the market report cover?
-
The report is segmented by Type (Mobile ticketing application and SMS mobile ticketing), Technology (NFCs, QR codes and barcodes, and Others), Geography (Europe, North America, APAC, South America, and Middle East and Africa), Application (Public Transportation (Bus, Rail, Metro), Ride-Sharing, Taxi Services, and Airline Ticketing), and End-User (Urban Commuters, Tourists, Students, and Business Travelers)
-
-
Which regions are analyzed in the report?
-
Europe, North America, APAC, South America, and Middle East and Africa
-
-
What are the key growth drivers and market challenges?
-
Shift from smart cards to mobile ticketing, Privacy and security concerns over mobile ticketing solutions
-
-
Who are the major players in the Mobile Ticketing Market in the Transportation Sector?
-
Modaxo Inc., Cammax Ltd, Corethree Ltd., eos.uptrade GmbH, Giesecke Devrient GmbH, GoEuro Corp., Indra Sistemas SA, Infineon Technologies AG, Margento BV, Masabi Ltd., Mobisoft Infotech, moovel North America LLC, Nortap Technology Inc., Rapidsoft Systems Inc., Scheidt and Bachmann GmbH, Siemens AG, Thales Group, TickPick LLC, Token Transit Inc., Zendesk Inc., and Conduent Inc.
-
Market Research Insights
- The market continues to evolve, with transaction processing speed and system reliability being key priorities for passengers. According to industry reports, the market is expected to grow by over 15% annually, driven by the increasing demand for contactless payment solutions and the need for seamless user experiences. For instance, a major transit agency reported a 30% increase in ticket sales volume after implementing a mobile ticketing system with performance monitoring tools and accessibility features. These tools enable real-time system scalability and reliability, ensuring on-time performance indicators and user experience design meet passenger expectations. Moreover, partnerships with transit agencies, data security compliance, and operational efficiency gains are essential for market success.
- API documentation and revenue management tools help streamline processes, while customer support channels, marketing campaign effectiveness, and data visualization dashboards provide valuable insights for continuous improvement. In conclusion, the market is undergoing significant growth, with a focus on transaction processing speed, passenger satisfaction, and system reliability. The integration of performance monitoring tools, partnerships, and data-driven strategies is crucial for market success and meeting the evolving needs of passengers.
We can help! Our analysts can customize this mobile ticketing market in the transportation sector research report to meet your requirements.
 RIA -
RIA - 
