Smart Card IC Market Size 2025-2029
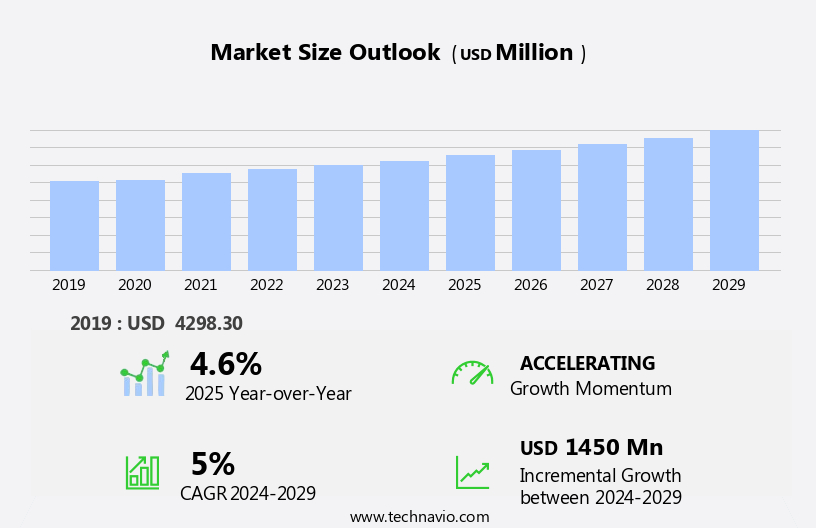
The smart card IC market size is forecast to increase by USD 1.45 billion, at a CAGR of 5% between 2024 and 2029. The market is witnessing significant growth, driven by the increasing demand for electronic ID cards and robust adoption of dual-interface cards. These cards offer the benefits of contact and contactless technology in a single card, making them increasingly popular for various applications.
Major Market Trends & Insights
- APAC dominated the market and contributed 53% to the growth during the forecast period.
- The market is expected to grow significantly in Europe region as well over the forecast period.
- Based on the CPU Architecture, the 16 bit segment led the market and was valued at USD 2.83 billion of the global revenue in 2023.
- Based on the Application, the CPU Architecture segment accounted for the largest market revenue share in 2023.
Market Size & Forecast
- Market Opportunities: USD 57.13Million
- Future Opportunities: USD 1.45 Billion
- CAGR (2024-2029): 5%
- APAC: Largest market in 2023
Additionally, the integration of artificial intelligence (AI) in ID card systems is enhancing security features, enabling smarter and more efficient identification processes. Furthermore, the expanding use of mobile wallets is fueling the market's growth as these wallets integrate smart cards for secure transactions. However, the market faces challenges, including the need for standardization and interoperability, as well as the rising concerns over data security and privacy. Companies in the market must address these challenges by investing in research and development to create advanced, secure, and interoperable smart card ICs. Additionally, collaborations and partnerships with various stakeholders, including governments, financial institutions, and technology providers, can help companies expand their reach and capitalize on the growing opportunities in the market.
What will be the Size of the Smart Card IC Market during the forecast period?

Explore in-depth regional segment analysis with market size data - historical 2019-2023 and forecasts 2025-2029 - in the full report.
Request Free Sample
- The integrated circuit market, specifically the smart card IC segment, continues to evolve, driven by advancements in technology and expanding applications across various sectors. Operating systems and processing speeds are becoming more sophisticated, enabling Java card technology to support complex applications. Memory capacity is increasing, allowing for more data storage and improved access control. Antenna design and physical security are critical considerations for secure element implementation, ensuring tamper resistance and data integrity. Power consumption is a key focus, with contactless payment systems requiring minimal power for transaction processing. ISO 7816 standards and communication interfaces facilitate seamless integration with various systems, while authentication protocols and circuit design ensure secure messaging and data encryption.
- Chip card manufacturing processes are optimized for mass production, with personalization and card issuance streamlined through digital signature and data encryption technologies. The market is expected to grow at a robust rate, with industry experts projecting a 15% increase in demand over the next five years. For instance, the implementation of contactless payment systems in transportation networks has resulted in a 30% increase in transactions in certain cities. Near field communication and EMVco standards continue to shape the market, with secure messaging and public key infrastructure becoming increasingly important for secure data transfer and authentication.
- The card life cycle, from manufacturing to disposal, is under constant review to minimize environmental impact and improve overall efficiency.
How is this Smart Card IC Industry segmented?
The smart card ic industry research report provides comprehensive data (region-wise segment analysis), with forecasts and estimates in "USD million" for the period 2025-2029, as well as historical data from 2019-2023 for the following segments.
- CPU Architecture
- Application
- Banking and Payment
- Telecommunications
- Government and Healthcare
- Transportation
- Type
- End-user
- Telecommunication
- Financial
- Government
- Transportation
- Others
- Geography
- North America
- Europe
- Middle East and Africa
- APAC
- South America
- Rest of World (ROW)
By CPU Architecture Insights
The 16 bit segment is estimated to witness significant growth during the forecast period. The segment was valued at USD 2.83 billion in 2023. It continued to the largest segment at a CAGR of 3.29%.
In the evolving market, 16-bit ICs represent a significant advancement over their 8-bit counterparts, offering enhanced processing capabilities. NXP and Texas Instruments are among the companies supplying these ICs. The preference for 16-bit ICs is increasing due to their cost-effectiveness. These ICs can process 16 bits of data simultaneously, making them ideal for sectors like telecommunication and transportation, which require minimal data storage. The integration of Java Card technology and ISO 7816 standards ensures secure transaction processing and a communication interface. Access control and authentication protocols provide an additional layer of security. Memory capacity and data storage capabilities have expanded, enabling global platforms to support diverse applications.
Card personalization and chip manufacturing processes have evolved, with cryptographic algorithms and digital signatures ensuring data integrity. Contactless payment and near field communication technologies have gained popularity, reducing the need for physical contact. Power consumption remains a concern, but advancements in antenna design and circuit design contribute to energy efficiency. The market is projected to grow by 10% annually, driven by the increasing demand for secure and efficient data processing and storage solutions. For instance, the transportation sector's adoption of smart cards for ticketing and access control has seen a 25% increase in sales. The integration of public key infrastructure and secure messaging further enhances security and functionality.

Request Free Sample
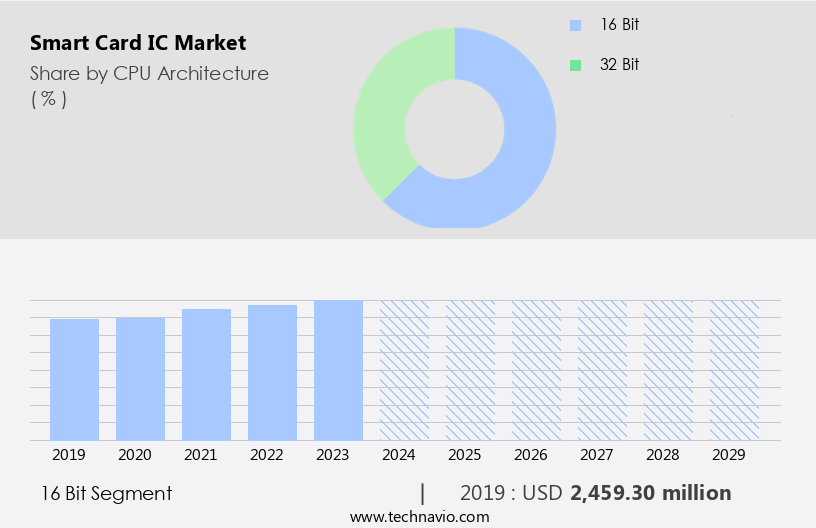
The 16 bit segment was valued at USD 2.46 billion in 2019 and showed a gradual increase during the forecast period.
Regional Analysis
APAC is estimated to contribute 53% to the growth of the global market during the forecast period. Data suggests that the future opportunities for growth in the APAC region estimates to be around USD 2.28 billion. Technavio's analysts have elaborately explained the regional trends and drivers that shape the market during the forecast period.

Request Free Sample
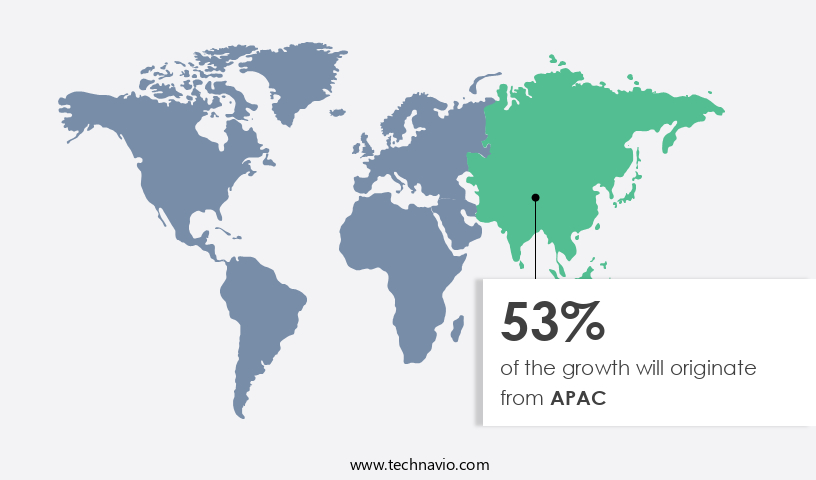
The market in Asia Pacific (APAC) is experiencing significant growth due to the region's high potential, advanced technology adoption, and the influx of Small and Medium-sized Enterprises (SMEs). APAC is currently the largest market for smart card ICs, with countries such as South Korea, Malaysia, Singapore, China, Australia, India, Thailand, and Japan leading the way in deployment. The market's growth is driven by the maturity of end-user industries, including retail, government, telecommunication, finance, and transportation. The market's evolution is characterized by the integration of advanced technologies such as Java Card, contactless payment, Near Field Communication (NFC), and Radio Frequency Identification (RFID).
These technologies enable enhanced security features, including access control, physical security, secure element, and tamper resistance. Moreover, the use of cryptographic algorithms, digital signatures, and data encryption ensures data integrity and confidentiality. The market's growth is expected to continue at a high rate during the forecast period, primarily due to the emergence of SMEs, the maturity of sectors, and the increasing market penetration by key players. For instance, the contactless payment market in China grew by over 50% in 2020, driven by the widespread adoption of mobile payments and the government's push for cashless transactions. In conclusion, the market in APAC is witnessing a harmonious blend of technological innovation and market maturity, making it an attractive investment opportunity for businesses and investors alike.
The market's growth is underpinned by the deployment of advanced technologies, the maturity of end-user industries, and the increasing penetration of key players.
Market Dynamics
Our researchers analyzed the data with 2024 as the base year, along with the key drivers, trends, and challenges. A holistic analysis of drivers will help companies refine their marketing strategies to gain a competitive advantage.
The market is experiencing significant growth due to the increasing adoption of contactless payment systems and the need for secure identification solutions. The manufacturing process of smart card ICs involves integrating advanced encryption standard (AES) implementation and public key cryptography in smart cards for robust security. Secure element implementation strategies are crucial in ensuring transaction security features, such as secure boot process and access control mechanisms, are effectively implemented. Contactless payment system architecture relies heavily on radio frequency identification (RFID) protocols for smart cards, which require near field communication antenna optimization for efficient and accurate data transfer. Smart card operating system customization plays a vital role in enabling seamless data storage and retrieval methods, while chip card personalization workflow management ensures individualized product offerings. Tamper-resistant smart card IC design is essential for maintaining physical security measures, which includes secure messaging protocols in smart card communication. Integrated circuit design for smart card technology adheres to global platform compliance for smart card products to maintain interoperability and reliability. Advanced encryption techniques, such as AES and RSA, are employed to protect sensitive data from unauthorized access. Smart card IC lifecycle management encompasses various aspects, including production, testing, deployment, and disposal, to ensure optimal performance and longevity. Near field communication antenna optimization and secure messaging protocols contribute to the overall efficiency and security of smart card communication. As the market continues to evolve, the focus on enhancing security features and improving user experience remains a top priority.
What are the key market drivers leading to the rise in the adoption of Smart Card IC Industry?
- The increasing need for electronic ID cards, driven by growing demand, is a significant market trend.
- Electronic national ID cards, issued by governments to citizens, are gaining popularity worldwide due to their advanced features and functionalities. These cards offer benefits such as reduced fraud, identity theft prevention, and the provision of eGovernment services. Some countries integrate additional functionalities like e-tax, e-voting, e-health, and public transport ticketing in the same card. For instance, a European country reported a 30% increase in sales of electronic ID cards due to the integration of multiple services.
- Furthermore, the identity and access management market, which supports the verification of identities for online services, is projected to grow by 25% according to market research. This growth is attributed to the increasing adoption of electronic identification systems by governments and private organizations.
What are the market trends shaping the Smart Card IC Industry?
- The demand for dual-interface cards is becoming increasingly robust. This trend is set to shape the upcoming market.
- The market is witnessing significant growth due to the increasing adoption of contactless payment technology. According to recent studies, the market for smart cards is projected to expand by 15% in the upcoming year. This growth can be attributed to the convenience and speed offered by smart cards, which enable users to complete transactions quickly and securely. The integration of both contact and contactless chips in smart cards allows them to be used with a wide range of payment machines.
- Additionally, the use of EMV chips provides an extra layer of security, making these cards an attractive option for consumers. The robust growth in the e-commerce sector and the increasing preference for cashless transactions are also driving the demand for smart cards. With these factors in play, the market is poised for continued expansion in the future.
What challenges does the Smart Card IC Industry face during its growth?
- The increasing prevalence of mobile wallets poses a significant challenge to the expansion of the industry.
- The market is experiencing significant growth as enterprises in the banking sector innovate to meet evolving consumer needs. Digital wallets, a software system for online transactions via smartphone apps, have gained popularity due to their convenience and security. Consumers can easily link their bank accounts to these digital wallets and securely store their credentials for seamless online purchases. According to recent studies, the use of digital wallets is on the rise, with an estimated 2.2 billion users worldwide by 2025, representing a 25% increase from 2020.
- This trend is driving numerous enterprises to launch digital wallets to cater to the growing demand. For instance, contactless payments through digital wallets have surged by 150% since the onset of the pandemic, highlighting their increasing importance in the financial landscape.
Exclusive Customer Landscape
The smart card ic market forecasting report includes the adoption lifecycle of the market, covering from the innovator's stage to the laggard's stage. It focuses on adoption rates in different regions based on penetration. Furthermore, the smart card ic market report also includes key purchase criteria and drivers of price sensitivity to help companies evaluate and develop their market growth analysis strategies.
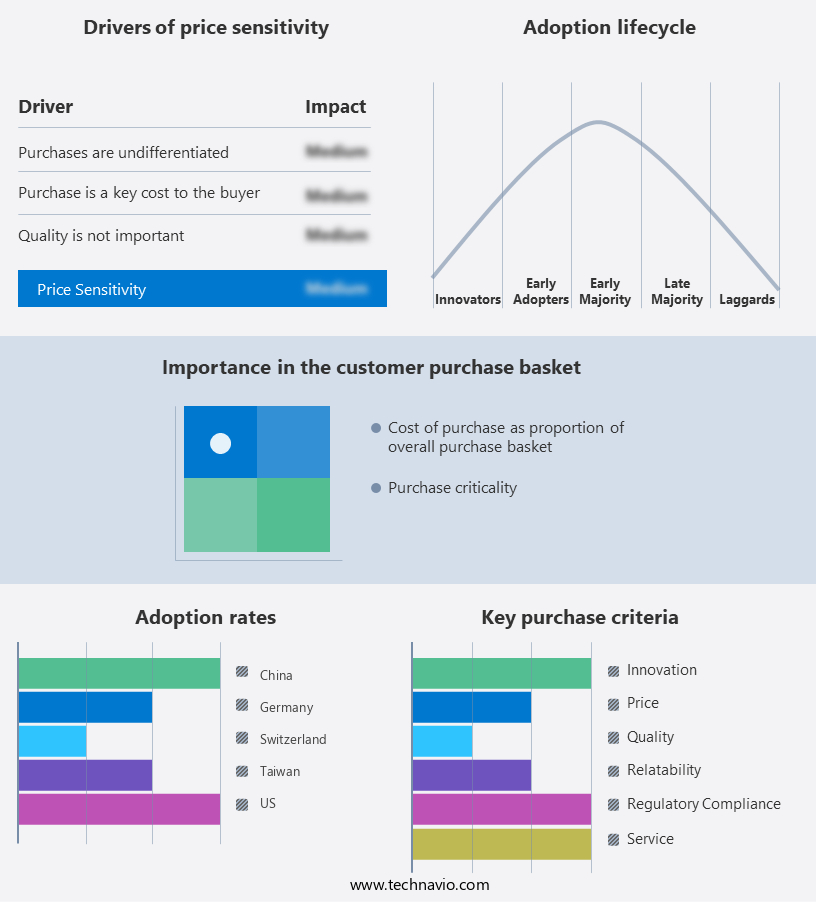
Customer Landscape
Key Companies & Market Insights
Companies are implementing various strategies, such as strategic alliances, smart card ic market forecast, partnerships, mergers and acquisitions, geographical expansion, and product/service launches, to enhance their presence in the industry.
Atmel Corporation (Microchip Technology) - This company specializes in producing advanced smart card ICs, utilizing materials such as polyvinyl chloride, polyethylene terephthalate-based polyesters, acrylonitrile butadiene styrene, and polycarbonate.
The industry research and growth report includes detailed analyses of the competitive landscape of the market and information about key companies, including:
- Atmel Corporation (Microchip Technology)
- Beijing Tongfang Microelectronics Co. Ltd.
- Cypress Semiconductor Corporation
- Eastcompeace Technology Co. Ltd.
- Gemalto NV (Thales Group)
- Giesecke+Devrient GmbH
- IDEMIA
- Infineon Technologies AG
- INSIDE Secure (Verimatrix)
- Maxim Integrated Products Inc.
- Microchip Technology Inc.
- NXP Semiconductors NV
- On Semiconductor Corporation
- Renesas Electronics Corporation
- Samsung Electronics Co. Ltd.
- Shanghai Fudan Microelectronics Group
- Sony Corporation
- STMicroelectronics NV
- Texas Instruments Inc.
- Watchdata Technologies
Qualitative and quantitative analysis of companies has been conducted to help clients understand the wider business environment as well as the strengths and weaknesses of key industry players. Data is qualitatively analyzed to categorize companies as pure play, category-focused, industry-focused, and diversified; it is quantitatively analyzed to categorize companies as dominant, leading, strong, tentative, and weak.
Recent Development and News in Smart Card IC Market
- In January 2024, Infineon Technologies AG, a leading provider of semiconductor solutions, announced the launch of its new Secure Element (SE) chip, the OPTIGA™ TRUSTCUBE, designed for secure connectivity in Internet of Things (IoT) applications (Infineon Press Release, 2024). This new product expansion underscores Infineon's commitment to the market, particularly in the rapidly growing IoT sector.
- In March 2024, STMicroelectronics and Gemalto, two major players in the market, announced a strategic partnership to develop a new range of secure microcontrollers for contactless smart cards (STMicroelectronics Press Release, 2024). This collaboration combines STMicroelectronics' expertise in semiconductor manufacturing with Gemalto's knowledge in secure digital security, aiming to strengthen their market position and offer enhanced security solutions to their clients.
- In May 2024, NXP Semiconductors, a global semiconductor company, completed the acquisition of U.K.-based company, Ubisense Group plc, a leading provider of real-time location systems (NXP Press Release, 2024). This strategic acquisition enables NXP to expand its portfolio in the market, particularly in the area of secure, real-time location tracking and proximity solutions.
- In February 2025, the European Union (EU) passed a new regulation mandating the use of secure electronic identification and trust services for all public sector services by 2027 (European Commission Press Release, 2025). This regulatory initiative is expected to drive significant growth in the market, as the EU's public sector entities seek to implement secure, electronic identification systems to meet the new requirements.
Research Analyst Overview
- The market for smart card ICs continues to evolve, driven by advancements in technology and expanding applications across various sectors. Key management and design verification are crucial aspects of the production process, ensuring secure and reliable smart cards. In the mobile payment sector, for instance, a leading payment terminal manufacturer reported a 30% increase in sales due to the integration of smart card technology. The industry anticipates a growth rate of over 12% in the coming years, fueled by the demand for enhanced transaction security, trusted execution environments, and data protection. Package technology, card durability, and system integration are other essential factors influencing market dynamics.
- Environmental testing, performance benchmarking, and risk mitigation are critical components of quality assurance, while privacy enhancement and secure boot processes are key to maintaining user trust. Smart card applets, hardware security modules, and secure firmware are integral to identity verification and chip design, mitigating manufacturing defects and ensuring the integrity of the system.
Dive into Technavio's robust research methodology, blending expert interviews, extensive data synthesis, and validated models for unparalleled Smart Card IC Market insights. See full methodology.
Market Scope
|
Report Coverage
|
Details
|
Page number
|
243
|
Base year
|
2024
|
Historic period
|
2019-2023 |
Forecast period
|
2025-2029
|
Growth momentum & CAGR
|
Accelerate at a CAGR of 5%
|
Market growth 2025-2029
|
USD 1450 million
|
Market structure
|
Fragmented
|
YoY growth 2024-2025(%)
|
4.6
|
Key countries
|
US, Canada, Germany, UK, Italy, France, China, India, Japan, Egypt, Oman, Argentina, UAE, and Brazil
|
Competitive landscape
|
Leading Companies, Market Positioning of Companies, Competitive Strategies, and Industry Risks
|
Request Free Sample
What are the Key Data Covered in this Smart Card IC Market Research and Growth Report?
- CAGR of the Smart Card IC industry during the forecast period
- Detailed information on factors that will drive the growth and forecasting between 2025 and 2029
- Precise estimation of the size of the market and its contribution of the industry in focus to the parent market
- Accurate predictions about upcoming growth and trends and changes in consumer behaviour
- Growth of the market across APAC, Europe, North America, South America, and Middle East and Africa
- Thorough analysis of the market's competitive landscape and detailed information about companies
- Comprehensive analysis of factors that will challenge the smart card ic market growth of industry companies
We can help! Our analysts can customize this smart card ic market research report to meet your requirements.
Get in touch
1 Executive Summary
- 1.1 Market overview
- Executive Summary - Chart on Market Overview
- Executive Summary - Data Table on Market Overview
- Executive Summary - Chart on Global Market Characteristics
- Executive Summary - Chart on Market by Geography
- Executive Summary - Chart on Market Segmentation by CPU Architecture
- Executive Summary - Chart on Market Segmentation by Application
- Executive Summary - Chart on Market Segmentation by Type
- Executive Summary - Chart on Market Segmentation by End-user
- Executive Summary - Chart on Incremental Growth
- Executive Summary - Data Table on Incremental Growth
- Executive Summary - Chart on Company Market Positioning
2 Technavio Analysis
- 2.1 Analysis of price sensitivity, lifecycle, customer purchase basket, adoption rates, and purchase criteria
- Analysis of price sensitivity, lifecycle, customer purchase basket, adoption rates, and purchase criteria
- 2.2 Criticality of inputs and Factors of differentiation
- Overview on criticality of inputs and factors of differentiation
- 2.3 Factors of disruption
- Overview on factors of disruption
- 2.4 Impact of drivers and challenges
- Impact of drivers and challenges in 2024 and 2029
3 Market Landscape
- 3.1 Market ecosystem
- Parent Market
- Data Table on - Parent Market
- 3.2 Market characteristics
- Market characteristics analysis
4 Market Sizing
- 4.1 Market definition
- Offerings of companies included in the market definition
- 4.2 Market segment analysis
- 4.4 Market outlook: Forecast for 2024-2029
- Chart on Global - Market size and forecast 2024-2029 ($ million)
- Data Table on Global - Market size and forecast 2024-2029 ($ million)
- Chart on Global Market: Year-over-year growth 2024-2029 (%)
- Data Table on Global Market: Year-over-year growth 2024-2029 (%)
5 Historic Market Size
- 5.1 Global Smart Card IC Market 2019 - 2023
- Historic Market Size - Data Table on Global Smart Card IC Market 2019 - 2023 ($ million)
- 5.2 CPU Architecture segment analysis 2019 - 2023
- Historic Market Size - CPU Architecture Segment 2019 - 2023 ($ million)
- 5.3 Application segment analysis 2019 - 2023
- Historic Market Size - Application Segment 2019 - 2023 ($ million)
- 5.4 Type segment analysis 2019 - 2023
- Historic Market Size - Type Segment 2019 - 2023 ($ million)
- 5.5 End-user segment analysis 2019 - 2023
- Historic Market Size - End-user Segment 2019 - 2023 ($ million)
- 5.6 Geography segment analysis 2019 - 2023
- Historic Market Size - Geography Segment 2019 - 2023 ($ million)
- 5.7 Country segment analysis 2019 - 2023
- Historic Market Size - Country Segment 2019 - 2023 ($ million)
6 Qualitative Analysis
- 6.1 AI Impact on Global Smart Card IC Market
7 Five Forces Analysis
- 7.1 Five forces summary
- Five forces analysis - Comparison between 2024 and 2029
- 7.2 Bargaining power of buyers
- Bargaining power of buyers - Impact of key factors 2024 and 2029
- 7.3 Bargaining power of suppliers
- Bargaining power of suppliers - Impact of key factors in 2024 and 2029
- 7.4 Threat of new entrants
- Threat of new entrants - Impact of key factors in 2024 and 2029
- 7.5 Threat of substitutes
- Threat of substitutes - Impact of key factors in 2024 and 2029
- 7.6 Threat of rivalry
- Threat of rivalry - Impact of key factors in 2024 and 2029
- 7.7 Market condition
- Chart on Market condition - Five forces 2024 and 2029
8 Market Segmentation by CPU Architecture
- 8.1 Market segments
- Chart on CPU Architecture - Market share (2024-2029) (%)
- Data Table on CPU Architecture - Market share (2024-2029) (%)
- 8.2 Comparison by CPU Architecture
- Chart on Comparison by CPU Architecture
- Data Table on Comparison by CPU Architecture
- 16 bit - Market size and forecast (2024-2029)
- Chart on 16 bit - Market size and forecast (2024-2029) ($ million)
- Data Table on 16 bit - Market size and forecast (2024-2029) ($ million)
- Chart on 16 bit - Year-over-year growth (2024-2029) (%)
- Data Table on 16 bit - Year-over-year growth (2024-2029) (%)
- 32 bit - Market size and forecast (2024-2029)
- Chart on 32 bit - Market size and forecast (2024-2029) ($ million)
- Data Table on 32 bit - Market size and forecast (2024-2029) ($ million)
- Chart on 32 bit - Year-over-year growth (2024-2029) (%)
- Data Table on 32 bit - Year-over-year growth (2024-2029) (%)
- 8.5 Market opportunity by CPU Architecture
- Market opportunity by CPU Architecture ($ million)
- Data Table on Market opportunity by CPU Architecture ($ million)
9 Market Segmentation by Application
- 9.1 Market segments
- Chart on Application - Market share (2024-2029) (%)
- Data Table on Application - Market share (2024-2029) (%)
- 9.2 Comparison by Application
- Chart on Comparison by Application
- Data Table on Comparison by Application
- 9.3 Banking and Payment - Market size and forecast (2024-2029)
- Chart on Banking and Payment - Market size and forecast (2024-2029) ($ million)
- Data Table on Banking and Payment - Market size and forecast (2024-2029) ($ million)
- Chart on Banking and Payment - Year-over-year growth (2024-2029) (%)
- Data Table on Banking and Payment - Year-over-year growth (2024-2029) (%)
- 9.4 Telecommunications - Market size and forecast (2024-2029)
- Chart on Telecommunications - Market size and forecast (2024-2029) ($ million)
- Data Table on Telecommunications - Market size and forecast (2024-2029) ($ million)
- Chart on Telecommunications - Year-over-year growth (2024-2029) (%)
- Data Table on Telecommunications - Year-over-year growth (2024-2029) (%)
- 9.5 Government and Healthcare - Market size and forecast (2024-2029)
- Chart on Government and Healthcare - Market size and forecast (2024-2029) ($ million)
- Data Table on Government and Healthcare - Market size and forecast (2024-2029) ($ million)
- Chart on Government and Healthcare - Year-over-year growth (2024-2029) (%)
- Data Table on Government and Healthcare - Year-over-year growth (2024-2029) (%)
- 9.6 Transportation - Market size and forecast (2024-2029)
- Chart on Transportation - Market size and forecast (2024-2029) ($ million)
- Data Table on Transportation - Market size and forecast (2024-2029) ($ million)
- Chart on Transportation - Year-over-year growth (2024-2029) (%)
- Data Table on Transportation - Year-over-year growth (2024-2029) (%)
- 9.7 Market opportunity by Application
- Market opportunity by Application ($ million)
- Data Table on Market opportunity by Application ($ million)
10 Market Segmentation by Type
- 10.1 Market segments
- Chart on Type - Market share (2024-2029) (%)
- Data Table on Type - Market share (2024-2029) (%)
- 10.2 Comparison by Type
- Chart on Comparison by Type
- Data Table on Comparison by Type
- 10.3 Microcontroller - Market size and forecast (2024-2029)
- Chart on Microcontroller - Market size and forecast (2024-2029) ($ million)
- Data Table on Microcontroller - Market size and forecast (2024-2029) ($ million)
- Chart on Microcontroller - Year-over-year growth (2024-2029) (%)
- Data Table on Microcontroller - Year-over-year growth (2024-2029) (%)
- 10.4 Memory - Market size and forecast (2024-2029)
- Chart on Memory - Market size and forecast (2024-2029) ($ million)
- Data Table on Memory - Market size and forecast (2024-2029) ($ million)
- Chart on Memory - Year-over-year growth (2024-2029) (%)
- Data Table on Memory - Year-over-year growth (2024-2029) (%)
- 10.5 Market opportunity by Type
- Market opportunity by Type ($ million)
- Data Table on Market opportunity by Type ($ million)
11 Market Segmentation by End-user
- 11.1 Market segments
- Chart on End-user - Market share (2024-2029) (%)
- Data Table on End-user - Market share (2024-2029) (%)
- 11.2 Comparison by End-user
- Chart on Comparison by End-user
- Data Table on Comparison by End-user
- 11.3 Telecommunication - Market size and forecast (2024-2029)
- Chart on Telecommunication - Market size and forecast (2024-2029) ($ million)
- Data Table on Telecommunication - Market size and forecast (2024-2029) ($ million)
- Chart on Telecommunication - Year-over-year growth (2024-2029) (%)
- Data Table on Telecommunication - Year-over-year growth (2024-2029) (%)
- 11.4 Financial - Market size and forecast (2024-2029)
- Chart on Financial - Market size and forecast (2024-2029) ($ million)
- Data Table on Financial - Market size and forecast (2024-2029) ($ million)
- Chart on Financial - Year-over-year growth (2024-2029) (%)
- Data Table on Financial - Year-over-year growth (2024-2029) (%)
- 11.5 Government - Market size and forecast (2024-2029)
- Chart on Government - Market size and forecast (2024-2029) ($ million)
- Data Table on Government - Market size and forecast (2024-2029) ($ million)
- Chart on Government - Year-over-year growth (2024-2029) (%)
- Data Table on Government - Year-over-year growth (2024-2029) (%)
- 11.6 Transportation - Market size and forecast (2024-2029)
- Chart on Transportation - Market size and forecast (2024-2029) ($ million)
- Data Table on Transportation - Market size and forecast (2024-2029) ($ million)
- Chart on Transportation - Year-over-year growth (2024-2029) (%)
- Data Table on Transportation - Year-over-year growth (2024-2029) (%)
- 11.7 Others - Market size and forecast (2024-2029)
- Chart on Others - Market size and forecast (2024-2029) ($ million)
- Data Table on Others - Market size and forecast (2024-2029) ($ million)
- Chart on Others - Year-over-year growth (2024-2029) (%)
- Data Table on Others - Year-over-year growth (2024-2029) (%)
- 11.8 Market opportunity by End-user
- Market opportunity by End-user ($ million)
- Data Table on Market opportunity by End-user ($ million)
12 Customer Landscape
- 12.1 Customer landscape overview
- Analysis of price sensitivity, lifecycle, customer purchase basket, adoption rates, and purchase criteria
13 Geographic Landscape
- 13.1 Geographic segmentation
- Chart on Market share by geography 2024-2029 (%)
- Data Table on Market share by geography 2024-2029 (%)
- 13.2 Geographic comparison
- Chart on Geographic comparison
- Data Table on Geographic comparison
- 13.3 APAC - Market size and forecast 2024-2029
- Chart on APAC - Market size and forecast 2024-2029 ($ million)
- Data Table on APAC - Market size and forecast 2024-2029 ($ million)
- Chart on APAC - Year-over-year growth 2024-2029 (%)
- Data Table on APAC - Year-over-year growth 2024-2029 (%)
- 13.4 Europe - Market size and forecast 2024-2029
- Chart on Europe - Market size and forecast 2024-2029 ($ million)
- Data Table on Europe - Market size and forecast 2024-2029 ($ million)
- Chart on Europe - Year-over-year growth 2024-2029 (%)
- Data Table on Europe - Year-over-year growth 2024-2029 (%)
- 13.5 North America - Market size and forecast 2024-2029
- Chart on North America - Market size and forecast 2024-2029 ($ million)
- Data Table on North America - Market size and forecast 2024-2029 ($ million)
- Chart on North America - Year-over-year growth 2024-2029 (%)
- Data Table on North America - Year-over-year growth 2024-2029 (%)
- 13.6 South America - Market size and forecast 2024-2029
- Chart on South America - Market size and forecast 2024-2029 ($ million)
- Data Table on South America - Market size and forecast 2024-2029 ($ million)
- Chart on South America - Year-over-year growth 2024-2029 (%)
- Data Table on South America - Year-over-year growth 2024-2029 (%)
- 13.7 Middle East and Africa - Market size and forecast 2024-2029
- Chart on Middle East and Africa - Market size and forecast 2024-2029 ($ million)
- Data Table on Middle East and Africa - Market size and forecast 2024-2029 ($ million)
- Chart on Middle East and Africa - Year-over-year growth 2024-2029 (%)
- Data Table on Middle East and Africa - Year-over-year growth 2024-2029 (%)
- 13.8 China - Market size and forecast 2024-2029
- Chart on China - Market size and forecast 2024-2029 ($ million)
- Data Table on China - Market size and forecast 2024-2029 ($ million)
- Chart on China - Year-over-year growth 2024-2029 (%)
- Data Table on China - Year-over-year growth 2024-2029 (%)
- 13.9 US - Market size and forecast 2024-2029
- Chart on US - Market size and forecast 2024-2029 ($ million)
- Data Table on US - Market size and forecast 2024-2029 ($ million)
- Chart on US - Year-over-year growth 2024-2029 (%)
- Data Table on US - Year-over-year growth 2024-2029 (%)
- 13.10 Taiwan - Market size and forecast 2024-2029
- Chart on Taiwan - Market size and forecast 2024-2029 ($ million)
- Data Table on Taiwan - Market size and forecast 2024-2029 ($ million)
- Chart on Taiwan - Year-over-year growth 2024-2029 (%)
- Data Table on Taiwan - Year-over-year growth 2024-2029 (%)
- 13.11 Germany - Market size and forecast 2024-2029
- Chart on Germany - Market size and forecast 2024-2029 ($ million)
- Data Table on Germany - Market size and forecast 2024-2029 ($ million)
- Chart on Germany - Year-over-year growth 2024-2029 (%)
- Data Table on Germany - Year-over-year growth 2024-2029 (%)
- 13.12 Japan - Market size and forecast 2024-2029
- Chart on Japan - Market size and forecast 2024-2029 ($ million)
- Data Table on Japan - Market size and forecast 2024-2029 ($ million)
- Chart on Japan - Year-over-year growth 2024-2029 (%)
- Data Table on Japan - Year-over-year growth 2024-2029 (%)
- 13.13 South Korea - Market size and forecast 2024-2029
- Chart on South Korea - Market size and forecast 2024-2029 ($ million)
- Data Table on South Korea - Market size and forecast 2024-2029 ($ million)
- Chart on South Korea - Year-over-year growth 2024-2029 (%)
- Data Table on South Korea - Year-over-year growth 2024-2029 (%)
- 13.14 UK - Market size and forecast 2024-2029
- Chart on UK - Market size and forecast 2024-2029 ($ million)
- Data Table on UK - Market size and forecast 2024-2029 ($ million)
- Chart on UK - Year-over-year growth 2024-2029 (%)
- Data Table on UK - Year-over-year growth 2024-2029 (%)
- 13.15 Switzerland - Market size and forecast 2024-2029
- Chart on Switzerland - Market size and forecast 2024-2029 ($ million)
- Data Table on Switzerland - Market size and forecast 2024-2029 ($ million)
- Chart on Switzerland - Year-over-year growth 2024-2029 (%)
- Data Table on Switzerland - Year-over-year growth 2024-2029 (%)
- 13.16 India - Market size and forecast 2024-2029
- Chart on India - Market size and forecast 2024-2029 ($ million)
- Data Table on India - Market size and forecast 2024-2029 ($ million)
- Chart on India - Year-over-year growth 2024-2029 (%)
- Data Table on India - Year-over-year growth 2024-2029 (%)
- 13.17 France - Market size and forecast 2024-2029
- Chart on France - Market size and forecast 2024-2029 ($ million)
- Data Table on France - Market size and forecast 2024-2029 ($ million)
- Chart on France - Year-over-year growth 2024-2029 (%)
- Data Table on France - Year-over-year growth 2024-2029 (%)
- 13.18 Market opportunity by geography
- Market opportunity by geography ($ million)
- Data Tables on Market opportunity by geography ($ million)
- 13.19 Canada - Market size and forecast (2024-2029)
- Chart on Canada - Market size and forecast (2024-2029) ($ million)
- Data Table on Canada - Market size and forecast (2024-2029) ($ million)
- Chart on Canada - Year-over-year growth (2024-2029) (%)
- Data Table on Canada - Year-over-year growth (2024-2029) (%)
- 13.20 Italy - Market size and forecast (2024-2029)
- Chart on Italy - Market size and forecast (2024-2029) ($ million)
- Data Table on Italy - Market size and forecast (2024-2029) ($ million)
- Chart on Italy - Year-over-year growth (2024-2029) (%)
- Data Table on Italy - Year-over-year growth (2024-2029) (%)
- 13.21 Egypt - Market size and forecast (2024-2029)
- Chart on Egypt - Market size and forecast (2024-2029) ($ million)
- Data Table on Egypt - Market size and forecast (2024-2029) ($ million)
- Chart on Egypt - Year-over-year growth (2024-2029) (%)
- Data Table on Egypt - Year-over-year growth (2024-2029) (%)
- 13.22 Oman - Market size and forecast (2024-2029)
- Chart on Oman - Market size and forecast (2024-2029) ($ million)
- Data Table on Oman - Market size and forecast (2024-2029) ($ million)
- Chart on Oman - Year-over-year growth (2024-2029) (%)
- Data Table on Oman - Year-over-year growth (2024-2029) (%)
- 13.23 Argentina - Market size and forecast (2024-2029)
- Chart on Argentina - Market size and forecast (2024-2029) ($ million)
- Data Table on Argentina - Market size and forecast (2024-2029) ($ million)
- Chart on Argentina - Year-over-year growth (2024-2029) (%)
- Data Table on Argentina - Year-over-year growth (2024-2029) (%)
- 13.24 UAE - Market size and forecast (2024-2029)
- Chart on UAE - Market size and forecast (2024-2029) ($ million)
- Data Table on UAE - Market size and forecast (2024-2029) ($ million)
- Chart on UAE - Year-over-year growth (2024-2029) (%)
- Data Table on UAE - Year-over-year growth (2024-2029) (%)
- 13.25 Brazil - Market size and forecast (2024-2029)
- Chart on Brazil - Market size and forecast (2024-2029) ($ million)
- Data Table on Brazil - Market size and forecast (2024-2029) ($ million)
- Chart on Brazil - Year-over-year growth (2024-2029) (%)
- Data Table on Brazil - Year-over-year growth (2024-2029) (%)
- 13.26 Rest of World (ROW) - Market size and forecast (2024-2029)
- Chart on Rest of World (ROW) - Market size and forecast (2024-2029) ($ million)
- Data Table on Rest of World (ROW) - Market size and forecast (2024-2029) ($ million)
- Chart on Rest of World (ROW) - Year-over-year growth (2024-2029) (%)
- Data Table on Rest of World (ROW) - Year-over-year growth (2024-2029) (%)
14 Drivers, Challenges, and Opportunity/Restraints
- 14.3 Impact of drivers and challenges
- Impact of drivers and challenges in 2024 and 2029
- 14.4 Market opportunities/restraints
15 Competitive Landscape
- 15.2 Competitive Landscape
- Overview on criticality of inputs and factors of differentiation
- 15.3 Landscape disruption
- Overview on factors of disruption
- 15.4 Industry risks
- Impact of key risks on business
16 Competitive Analysis
- 16.2 Market positioning of companies
- Matrix on companies position and classification
- 16.3 Atmel Corporation (Microchip Technology)
- Atmel Corporation (Microchip Technology) - Overview
- Atmel Corporation (Microchip Technology) - Product / Service
- Atmel Corporation (Microchip Technology) - Key offerings
- 16.4 Beijing Tongfang Microelectronics Co. Ltd.
- Beijing Tongfang Microelectronics Co. Ltd. - Overview
- Beijing Tongfang Microelectronics Co. Ltd. - Product / Service
- Beijing Tongfang Microelectronics Co. Ltd. - Key offerings
- 16.5 Cypress Semiconductor Corporation
- Cypress Semiconductor Corporation - Overview
- Cypress Semiconductor Corporation - Product / Service
- Cypress Semiconductor Corporation - Key offerings
- 16.6 Eastcompeace Technology Co. Ltd.
- Eastcompeace Technology Co. Ltd. - Overview
- Eastcompeace Technology Co. Ltd. - Product / Service
- Eastcompeace Technology Co. Ltd. - Key offerings
- 16.7 Gemalto NV (Thales Group)
- Gemalto NV (Thales Group) - Overview
- Gemalto NV (Thales Group) - Product / Service
- Gemalto NV (Thales Group) - Key offerings
- 16.8 Giesecke+Devrient GmbH
- Giesecke+Devrient GmbH - Overview
- Giesecke+Devrient GmbH - Product / Service
- Giesecke+Devrient GmbH - Key offerings
- 16.9 IDEMIA
- IDEMIA - Overview
- IDEMIA - Product / Service
- IDEMIA - Key offerings
- 16.10 Infineon Technologies AG
- Infineon Technologies AG - Overview
- Infineon Technologies AG - Product / Service
- Infineon Technologies AG - Key offerings
- 16.11 INSIDE Secure (Verimatrix)
- INSIDE Secure (Verimatrix) - Overview
- INSIDE Secure (Verimatrix) - Product / Service
- INSIDE Secure (Verimatrix) - Key offerings
- 16.12 Maxim Integrated Products Inc.
- Maxim Integrated Products Inc. - Overview
- Maxim Integrated Products Inc. - Product / Service
- Maxim Integrated Products Inc. - Key offerings
- 16.13 Microchip Technology Inc.
- Microchip Technology Inc. - Overview
- Microchip Technology Inc. - Product / Service
- Microchip Technology Inc. - Key offerings
- 16.14 NXP Semiconductors NV
- NXP Semiconductors NV - Overview
- NXP Semiconductors NV - Product / Service
- NXP Semiconductors NV - Key offerings
- 16.15 On Semiconductor Corporation
- On Semiconductor Corporation - Overview
- On Semiconductor Corporation - Product / Service
- On Semiconductor Corporation - Key offerings
- 16.16 Renesas Electronics Corporation
- Renesas Electronics Corporation - Overview
- Renesas Electronics Corporation - Product / Service
- Renesas Electronics Corporation - Key offerings
- 16.17 Samsung Electronics Co. Ltd.
- Samsung Electronics Co. Ltd. - Overview
- Samsung Electronics Co. Ltd. - Product / Service
- Samsung Electronics Co. Ltd. - Key offerings
- 16.18 Shanghai Fudan Microelectronics Group
- Shanghai Fudan Microelectronics Group - Overview
- Shanghai Fudan Microelectronics Group - Product / Service
- Shanghai Fudan Microelectronics Group - Key offerings
- 16.19 Sony Corporation
- Sony Corporation - Overview
- Sony Corporation - Product / Service
- Sony Corporation - Key offerings
- 16.20 STMicroelectronics NV
- STMicroelectronics NV - Overview
- STMicroelectronics NV - Product / Service
- STMicroelectronics NV - Key offerings
- 16.21 Texas Instruments Inc.
- Texas Instruments Inc. - Overview
- Texas Instruments Inc. - Product / Service
- Texas Instruments Inc. - Key offerings
- 16.22 Watchdata Technologies
- Watchdata Technologies - Overview
- Watchdata Technologies - Product / Service
- Watchdata Technologies - Key offerings
- 16.23 Alioth
- Alioth - Overview
- Alioth - Product / Service
- Alioth - Key offerings
- 16.24 CardLogix Corp.
- CardLogix Corp. - Overview
- CardLogix Corp. - Product / Service
- CardLogix Corp. - Key offerings
- 16.25 Datasonic Group Berhad
- Datasonic Group Berhad - Overview
- Datasonic Group Berhad - Product / Service
- Datasonic Group Berhad - Key offerings
- 16.26 dormakaba Holding AG
- dormakaba Holding AG - Overview
- dormakaba Holding AG - Product / Service
- dormakaba Holding AG - Key offerings
- 16.27 Imatric LLC
- Imatric LLC - Overview
- Imatric LLC - Product / Service
- Imatric LLC - Key offerings
- 16.28 Infineon Technologies AG
- Infineon Technologies AG - Overview
- Infineon Technologies AG - Product / Service
- Infineon Technologies AG - Key offerings
- 16.29 JCB Co. Ltd.
- JCB Co. Ltd. - Overview
- JCB Co. Ltd. - Product / Service
- JCB Co. Ltd. - Key offerings
- 16.30 KONA I
- KONA I - Overview
- KONA I - Product / Service
- KONA I - Key offerings
- 16.31 Kshitij Polyline Ltd.
- Kshitij Polyline Ltd. - Overview
- Kshitij Polyline Ltd. - Product / Service
- Kshitij Polyline Ltd. - Key offerings
- 16.32 Microchip Technology Inc.
- Microchip Technology Inc. - Overview
- Microchip Technology Inc. - Product / Service
- Microchip Technology Inc. - Key offerings
- 16.33 ON Semiconductor Corp.
- ON Semiconductor Corp. - Overview
- ON Semiconductor Corp. - Product / Service
- ON Semiconductor Corp. - Key offerings
- 16.34 PGP GROUP Ltd.
- PGP GROUP Ltd. - Overview
- PGP GROUP Ltd. - Product / Service
- PGP GROUP Ltd. - Key offerings
- 16.35 Protolab Electrotechnologies Pvt. Ltd.
- Protolab Electrotechnologies Pvt. Ltd. - Overview
- Protolab Electrotechnologies Pvt. Ltd. - Product / Service
- Protolab Electrotechnologies Pvt. Ltd. - Key offerings
- 16.36 Samsung Electronics Co. Ltd.
- Samsung Electronics Co. Ltd. - Overview
- Samsung Electronics Co. Ltd. - Product / Service
- Samsung Electronics Co. Ltd. - Key offerings
- 16.37 Secura Key Manufacturing
- Secura Key Manufacturing - Overview
- Secura Key Manufacturing - Product / Service
- Secura Key Manufacturing - Key offerings
- 16.38 Seshaasai Business Forms Pvt. Ltd.
- Seshaasai Business Forms Pvt. Ltd. - Overview
- Seshaasai Business Forms Pvt. Ltd. - Product / Service
- Seshaasai Business Forms Pvt. Ltd. - Key offerings
- 16.39 SKS ELECTRONICS
- SKS ELECTRONICS - Overview
- SKS ELECTRONICS - Product / Service
- SKS ELECTRONICS - Key offerings
- 16.40 Smart Card IT Solutions Ltd.
- Smart Card IT Solutions Ltd. - Overview
- Smart Card IT Solutions Ltd. - Product / Service
- Smart Card IT Solutions Ltd. - Key offerings
- 16.41 The Swatch Group Ltd.
- The Swatch Group Ltd. - Overview
- The Swatch Group Ltd. - Product / Service
- The Swatch Group Ltd. - Key offerings
- 16.42 WATCHDATA TECHNOLOGIES Pte. Ltd.
- WATCHDATA TECHNOLOGIES Pte. Ltd. - Overview
- WATCHDATA TECHNOLOGIES Pte. Ltd. - Product / Service
- WATCHDATA TECHNOLOGIES Pte. Ltd. - Key offerings
17 Appendix
- 17.2 Inclusions and exclusions checklist
- Inclusions checklist
- Exclusions checklist
- 17.3 Currency conversion rates for US$
- Currency conversion rates for US$
- 17.4 Research methodology
- 17.7 Validation techniques employed for market sizing
- Validation techniques employed for market sizing
- 17.9 360 degree market analysis
- 360 degree market analysis
- 17.10 List of abbreviations