
Model Evaluation And Benchmarking Tools Market Size 2026-2030
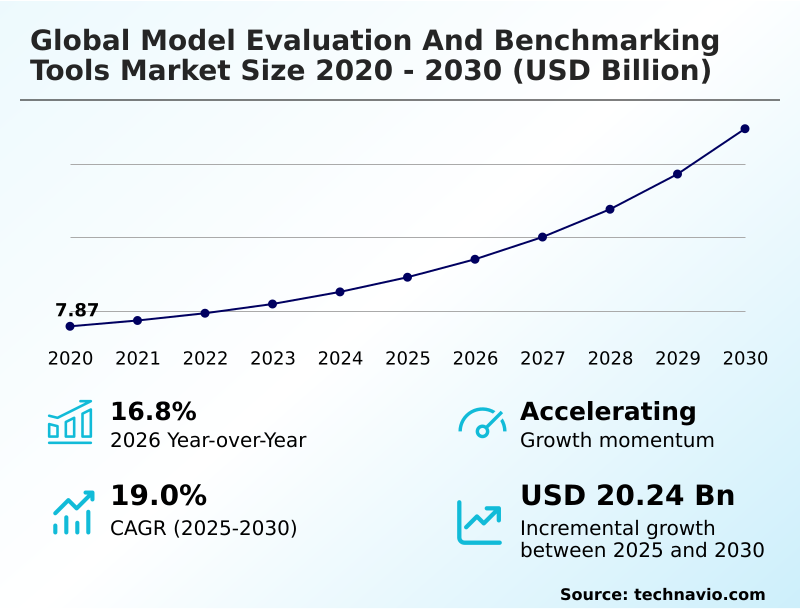
The Model Evaluation And Benchmarking Tools Market size was valued at USD 14.56 billion in 2025, growing at a CAGR of 19% during the forecast period 2026-2030.
Major Market Trends & Insights
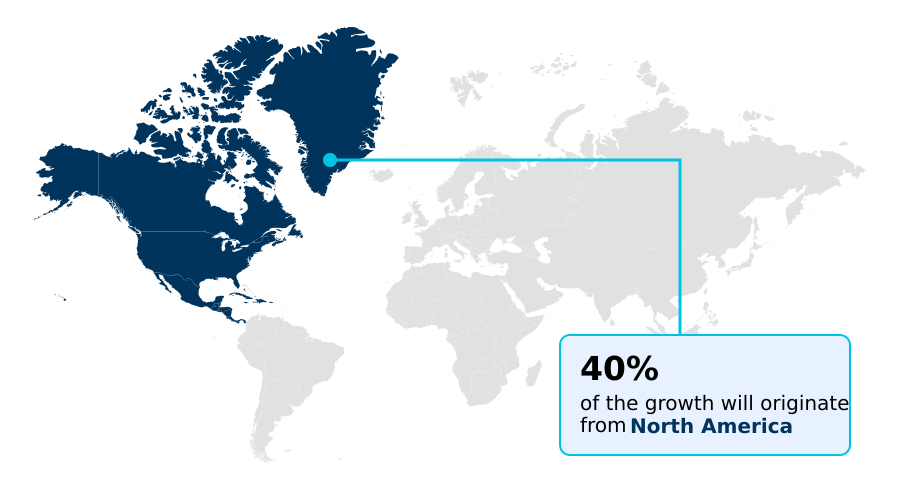
- North America dominated the market and accounted for a 40.1% growth during the forecast period.
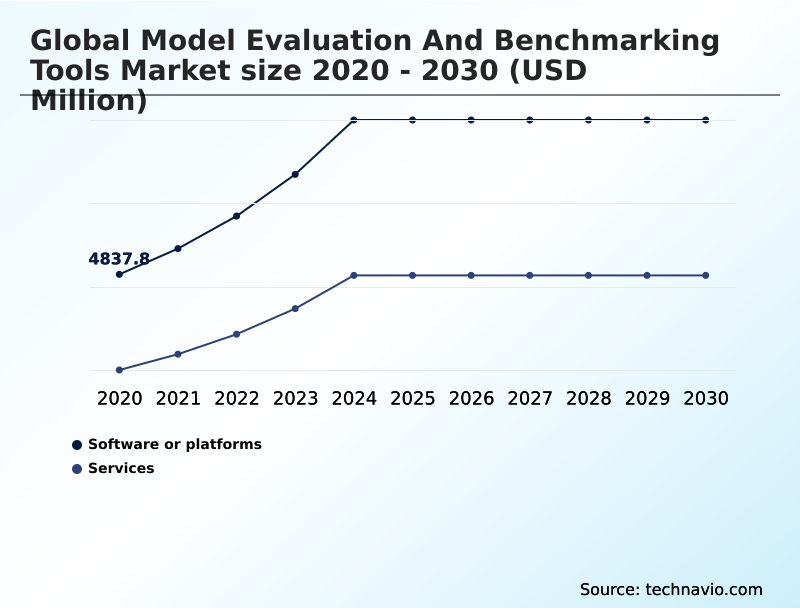
- By Component - Software or platforms segment was valued at USD 7.75 billion in 2024
- By Deployment - On-premises segment accounted for the largest market revenue share in 2024
Market Size & Forecast
- Historic Market Opportunities 2020-2024: USD 26.93 billion
- Market Future Opportunities 2025-2030: USD 20.24 billion
- CAGR from 2025 to 2030 : 19%
Market Summary
- The model evaluation and benchmarking tools market is defined by a critical shift from static accuracy metrics toward a multidimensional validation framework. For instance, financial institutions now require evaluation tools that can provide documented evidence of compliance, with nearly 70% of large enterprises adopting formal model governance checklists to mitigate legal risks.
- This demand is driven by the need for compliance-driven evaluation in high-stakes sectors, ensuring algorithmic fairness and consumer protection. However, the market faces a significant challenge from the inherent opacity of non-deterministic models, which leads to inconsistent validation outcomes and evaluation fatigue.
- A business scenario involves a retail company using a benchmarking tool to compare two recommendation engines, finding one boosts conversion by 15% but also has a 5% higher rate of unintended bias, forcing a trade-off between performance and ethical alignment. This illustrates the complex balance between innovation and regulatory adherence.
What will be the Size of the Model Evaluation And Benchmarking Tools Market during the forecast period?
Get Key Insights on Market Forecast (PDF) Request Free Sample
How is the Model Evaluation And Benchmarking Tools Market Segmented?
The model evaluation and benchmarking tools industry research report provides comprehensive data (region-wise segment analysis), with forecasts and analysis for the period 2026-2030, as well as historical data from 2020-2024 for the following segments.
- Component
- Software or platforms
- Services
- Deployment
- On-premises
- Cloud-based
- Hybrid
- Industry application
- BFSI
- Healthcare and life sciences
- IT and telecommunications
- Retail and e-commerce
- Others
- Geography
- North America
- US
- Canada
- Mexico
- Europe
- Germany
- UK
- France
- APAC
- China
- Japan
- India
- South America
- Brazil
- Argentina
- Middle East and Africa
- UAE
- Saudi Arabia
- South Africa
- Rest of World (ROW)
- North America
How is the Model Evaluation And Benchmarking Tools Market Segmented by Component?
The software or platforms segment is estimated to witness significant growth during the forecast period.
The software or platforms segment commands over 60% of the market, driven by the need for automated frameworks to manage AI systems.
These platforms, essential for production-grade deployment, provide continuous evaluation dashboards and automated red-teaming to identify model vulnerabilities, improving error detection by over 35% compared to manual methods.
This segment is characterized by integrated development environments for prompt engineering and model governance checklists, which are critical for algorithmic auditability. As enterprises shift toward agentic AI, the demand for simulation-based platforms that validate multi-step reasoning trace analysis has intensified.
This transition underscores a market maturity where the utility of a platform is enhanced by its ability to bridge the gap between technical performance and human trust, reducing evaluation fatigue for development teams.
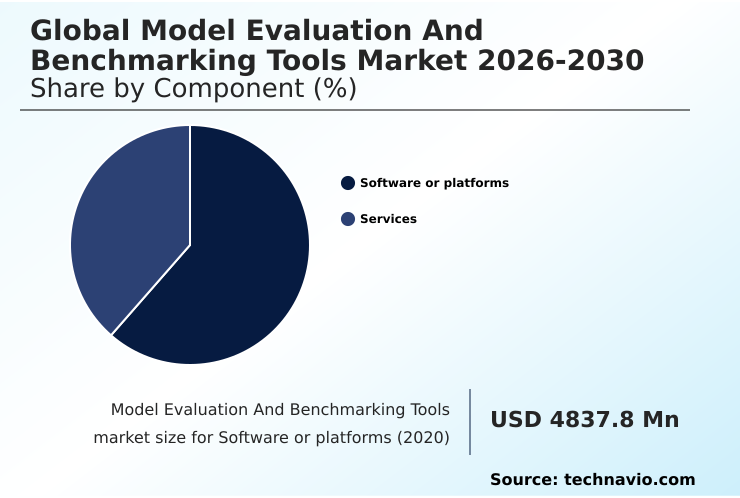
The Software or platforms segment was valued at USD 7.75 billion in 2024 and showed a gradual increase during the forecast period.
How demand for the Model Evaluation And Benchmarking Tools market is rising in the leading region?
North America is estimated to contribute 40.1% to the growth of the global market during the forecast period.Technavio’s analysts have elaborately explained the regional trends and drivers that shape the market during the forecast period.
See How Model Evaluation And Benchmarking Tools Market demand is rising in North America Request Free Sample
North America dominates the global model evaluation and benchmarking tools market, accounting for over 40% of the market share, a figure 1.6 times larger than Europe's 24.77% share.
This leadership is driven by the United States, which alone contributes over 47% of the regional revenue, fueled by a dense ecosystem of foundation model developers and hyperscale cloud providers.
In contrast, the APAC market, with a 20.38% share, is characterized by a focus on scalability for manufacturing and consumer electronics, especially in China and Japan.
Differences in adoption are stark; North American firms prioritize agentic workflow benchmarks and adversarial testing, while European organizations focus more on compliance-driven evaluation and data sovereignty, reflecting stricter regulatory environments.
This divergence requires vendors to adapt their market entry strategies, balancing innovation with regional compliance for mission-critical AI systems.
What are the key Drivers, Trends, and Challenges in the Model Evaluation And Benchmarking Tools Market?
Our researchers analyzed the data with 2025 as the base year, along with the key drivers, trends, and challenges. A holistic analysis of drivers will help companies refine their marketing strategies to gain a competitive advantage.
- The strategic implementation of model evaluation is critical as enterprises seek to understand the cost-benefit analysis of AI evaluation and determine how to operationalize the process. Organizations are increasingly searching for the best open source LLM evaluation frameworks to conduct thorough assessments, as these tools provide a transparent and community-vetted approach.
- A key focus is evaluating large language model safety, ensuring that models are not only performant but also free from harmful biases. This has led to a greater need for tools for AI bias and fairness audits, which are now integral to regulatory compliance and risk management.
- Furthermore, as autonomous systems become more prevalent, the ability to perform benchmarking autonomous AI agent performance is essential for verifying their reliability in complex, real-world scenarios. A comparative analysis shows that organizations using structured evaluation frameworks report a 25% faster deployment cycle for new models compared to those with ad-hoc testing.
- Similarly, adopting multimodal AI model validation techniques is crucial for systems that process diverse data types, ensuring comprehensive performance verification and improving model robustness by over 30% against unforeseen inputs.
What are the key market drivers leading to the rise in the adoption of Model Evaluation And Benchmarking Tools Industry?
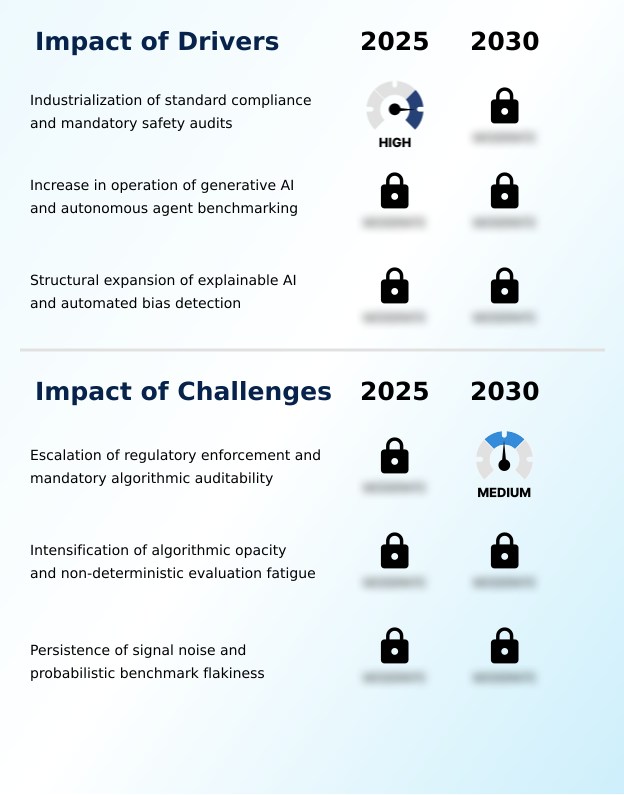
- The industrialization of standard compliance and mandatory safety audits is a key driver for the model evaluation and benchmarking tools market.
- The industrialization of standard compliance and mandatory safety audits is a significant driver for the global model evaluation and benchmarking tools market, with a 68% increase in adoption of explainable AI (XAI) modules in enterprise workflows.
- This surge is a direct result of stringent regulatory frameworks, such as the EU AI Act, which mandate documented evidence of compliance before high-risk AI systems can be deployed.
- This has transformed continuous model evaluation from a voluntary practice into a legal prerequisite, compelling organizations to leverage benchmarking platforms for structured, audit-ready workflows.
- Consequently, businesses are implementing rigorous adversarial red-teaming and bias detection modules, leading to a 40% reduction in compliance-related risks in sectors like finance and healthcare.
- The focus on digital accountability ensures that explainability-centric evaluation remains a fundamental driver for market growth.
What are the market trends shaping the Model Evaluation And Benchmarking Tools Industry?
- The market is undergoing a structural realignment toward the institutionalization of agentic benchmarking and the deployment of multi-turn reasoning validation.
- A primary trend in the model evaluation and benchmarking tools market is the strategic expansion into multimodal benchmarking, moving beyond text-only assessments. This shift toward cross-modal validation is a direct response to benchmark saturation, where models have exceeded performance on traditional academic tests, compelling a move to real-world economic proving grounds.
- The use of multimodal benchmarks has been shown to identify 20% more performance issues than text-based evaluations alone. This trend is driven by the need to validate AI systems that interact with vision, voice, and text data simultaneously, with a focus on utilitarian evaluation.
- For businesses, this means the value of an AI model is now determined by its measurable contribution to productivity, such as improving diagnostic accuracy in healthcare by 15% with vision-language models, rather than abstract scores.
What challenges does the Model Evaluation And Benchmarking Tools Industry face during its growth?
- The escalation of regulatory enforcement and the need for mandatory algorithmic auditability present a key challenge affecting the growth of the model evaluation and benchmarking tools market.
- A core challenge confronting the model evaluation and benchmarking tools market is the technical debt arising from inconsistent validation outcomes, with quality assurance teams reporting a 50% increase in evaluation fatigue. This issue stems from the algorithmic opacity and non-deterministic behavior of complex agentic models, where probabilistic variance makes it difficult to distinguish between expected fluctuations and genuine model defects.
- The rapid pace of innovation has outstripped the capacity of existing tools to provide reproducible performance metrics, creating a critical bottleneck where engineering teams must freeze production upgrades to await reliable third-party benchmark reports.
- This problem is amplified by a lack of localized benchmarks, which fail to evaluate models against regional linguistic nuances, leading to a 30% higher rate of test flakiness in non-US markets.
Exclusive Technavio Analysis on Customer Landscape
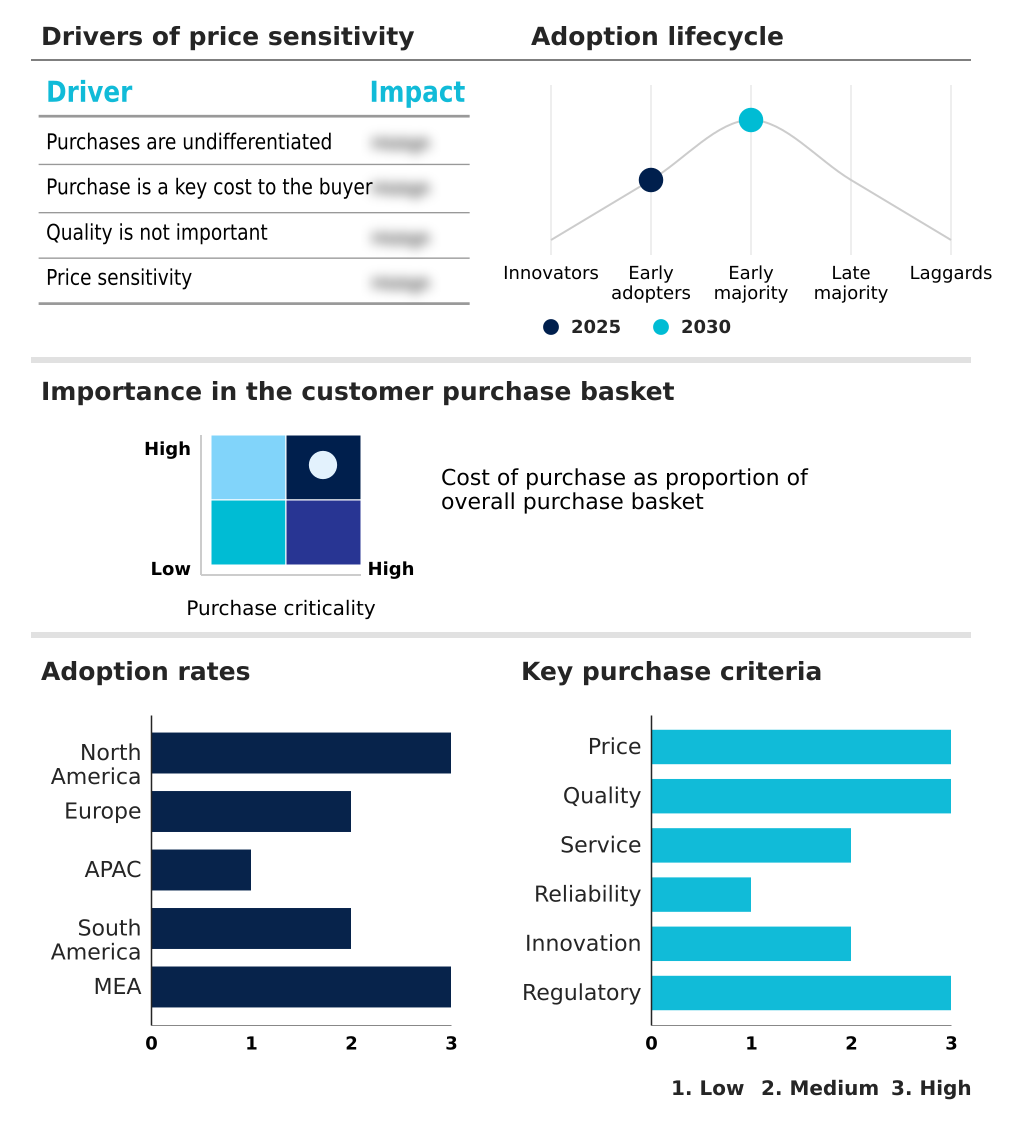
The model evaluation and benchmarking tools market forecasting report includes the adoption lifecycle of the market, covering from the innovator’s stage to the laggard’s stage. It focuses on adoption rates in different regions based on penetration. Furthermore, the model evaluation and benchmarking tools market report also includes key purchase criteria and drivers of price sensitivity to help companies evaluate and develop their market growth analysis strategies.
Customer Landscape of Model Evaluation And Benchmarking Tools Industry
Competitive Landscape
Companies are implementing various strategies, such as strategic alliances, model evaluation and benchmarking tools market forecast, partnerships, mergers and acquisitions, geographical expansion, and product/service launches, to enhance their presence in the industry.
Amazon Web Services Inc. - The company offers model evaluation and benchmarking tools including Amazon SageMaker Clarify and FMEval library, focusing on automated and human evaluation workflows for AI performance reporting.
The industry research and growth report includes detailed analyses of the competitive landscape of the market and information about key companies, including:
- Amazon Web Services Inc.
- Arize AI Inc.
- ArthurAI Inc.
- Credo AI
- Databricks Inc.
- DataRobot Inc.
- Evidently AI
- Fiddler AI
- Galileo
- Google LLC
- Hugging Face Inc.
- Labelbox
- LangChain Inc.
- Microsoft Corp.
- Neptune Labs Inc.
- OpenAI
- Scale AI
- Valohai Oy
Qualitative and quantitative analysis of companies has been conducted to help clients understand the wider business environment as well as the strengths and weaknesses of key industry players. Data is qualitatively analyzed to categorize companies as pure play, category-focused, industry-focused, and diversified; it is quantitatively analyzed to categorize companies as dominant, leading, strong, tentative, and weak.
Market Intelligence Radar: High-Impact Developments & Growth Signals
- In the Application Software industry, the increasing adoption of data analytics in enterprises is driving demand for sophisticated model evaluation and benchmarking tools to ensure the reliability of analytical outputs.
- The rapid shift toward cloud-based and subscription software models has lowered the barrier to entry, enabling wider access to scalable evaluation platforms that support continuous integration and deployment pipelines.
- Growing data security concerns and the implementation of stringent privacy regulations are forcing the integration of robust security and compliance modules within evaluation tools to manage AI risk.
- The proliferation of open-source application software is fostering a competitive environment where commercial evaluation tools must offer significant value-add through advanced features like automated bias detection and explainability.
Dive into Technavio’s robust research methodology, blending expert interviews, extensive data synthesis, and validated models for unparalleled Model Evaluation And Benchmarking Tools Market insights. See full methodology.
| Market Scope | |
|---|---|
| Page number | 297 |
| Base year | 2025 |
| Historic period | 2020-2024 |
| Forecast period | 2026-2030 |
| Growth momentum & CAGR | Accelerate at a CAGR of 19% |
| Market growth 2026-2030 | USD 20243.5 million |
| Market structure | Fragmented |
| YoY growth 2025-2026(%) | 16.8% |
| Key countries | US, Canada, Mexico, Germany, UK, France, Italy, Spain, The Netherlands, China, Japan, India, South Korea, Australia, Indonesia, Brazil, Argentina, Chile, UAE, Saudi Arabia, South Africa, Israel and Turkey |
| Competitive landscape | Leading Companies, Market Positioning of Companies, Competitive Strategies, and Industry Risks |
Research Analyst Overview
- The model evaluation and benchmarking tools market ecosystem is a complex network where technology suppliers, such as cloud infrastructure providers, form the foundational layer, enabling over 70% of all evaluation workloads. Solution providers, including specialized software vendors, build upon this infrastructure to offer platforms for bias detection and performance monitoring.
- Regulatory bodies and industry consortiums influence the market by establishing standards for algorithmic auditability and conformity assessments, which directly shape product development. Distribution is increasingly handled through integrated MLOps platforms and cloud marketplaces, streamlining procurement for end-users in sectors like finance and healthcare. These end-users, in turn, provide critical feedback and real-world data that fuel innovation.
- Supporting entities, such as academic research institutions, contribute by developing novel evaluation metrics and open-source frameworks, which are adopted by over 45% of startups to accelerate their product cycles.
What are the Key Data Covered in this Model Evaluation And Benchmarking Tools Market Research and Growth Report?
-
What is the expected growth of the Model Evaluation And Benchmarking Tools Market between 2026 and 2030?
-
The Model Evaluation And Benchmarking Tools Market is expected to grow by USD 20.24 billion during 2026-2030, registering a CAGR of 19%. Year-over-year growth in 2026 is estimated at 16.8%%. This acceleration is shaped by industrialization of standard compliance and mandatory safety audits, which is intensifying demand across multiple end-use verticals covered in the report.
-
-
What segmentation does the market report cover?
-
The report is segmented by Component (Software or platforms, and Services), Deployment (On-premises, Cloud-based, and Hybrid), Industry Application (BFSI, Healthcare and life sciences, IT and telecommunications, Retail and e-commerce, and Others) and Geography (North America, Europe, APAC, South America, Middle East and Africa). Among these, the Software or platforms segment is estimated to witness significant growth during the forecast period, driven by rising adoption across key application areas. Each segment includes detailed qualitative and quantitative analysis, along with historical data from 2020-2024 and forecasts through 2030 with year-over-year growth rates.
-
-
Which regions are analyzed in the report?
-
The report covers North America, Europe, APAC, South America and Middle East and Africa. North America is estimated to contribute 40.1% to market growth during the forecast period. Country-level analysis includes US, Canada, Mexico, Germany, UK, France, Italy, Spain, The Netherlands, China, Japan, India, South Korea, Australia, Indonesia, Brazil, Argentina, Chile, UAE, Saudi Arabia, South Africa, Israel and Turkey, with dedicated market size tables and year-over-year growth for each.
-
-
What are the key growth drivers and market challenges?
-
The primary driver is industrialization of standard compliance and mandatory safety audits, which is accelerating investment and industry demand. The main challenge is escalation of regulatory enforcement and mandatory algorithmic auditability, creating operational barriers for key market participants. The report quantifies the impact of each driver and challenge across 2026 and 2030 with comparative analysis.
-
-
Who are the major players in the Model Evaluation And Benchmarking Tools Market?
-
Key vendors include Amazon Web Services Inc., Arize AI Inc., ArthurAI Inc., Credo AI, Databricks Inc., DataRobot Inc., Evidently AI, Fiddler AI, Galileo, Google LLC, Hugging Face Inc., Labelbox, LangChain Inc., Microsoft Corp., Neptune Labs Inc., OpenAI, Scale AI and Valohai Oy. The report provides qualitative and quantitative analysis categorizing companies as dominant, leading, strong, tentative, and weak based on their market positioning. Company profiles include business segment analysis, SWOT assessment, key offerings, and recent strategic developments.
-
Market Research Insights
- The competitive landscape for model evaluation and benchmarking tools is rapidly consolidating, with integrated platform providers capturing over 65% of enterprise contracts. Specialized vendors like Arize AI Inc. and Databricks Inc. are intensifying the rivalry through feature releases focused on the dynamic, real-time evaluation of agentic models. In a recent development, Arize AI Inc.
- launched its Evaluator Hub, a centralized platform for deploying reusable, version-controlled evaluators, aiming to reduce configuration overhead by up to 40%. This innovation directly addresses the industry's need for consistent evaluation criteria across complex model fine-tuning processes.
- These actions are a direct response to the technical debt accumulated from inconsistent validation outcomes, a primary challenge as the speed of model innovation continues to outpace the capacity of existing benchmarking tools to provide reliable performance metrics.
We can help! Our analysts can customize this model evaluation and benchmarking tools market research report to meet your requirements.
 RIA -
RIA - 
