
Modular Cleanroom Market Size 2026-2030
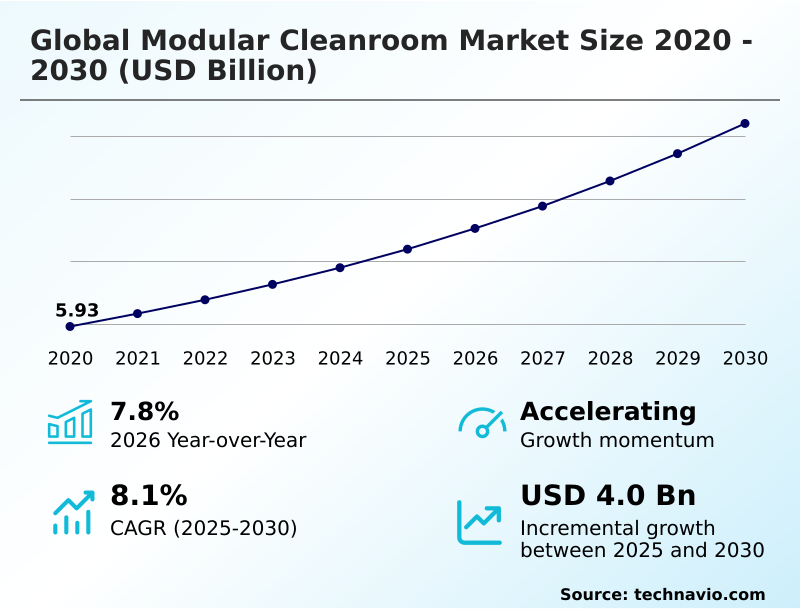
The modular cleanroom market size is valued to increase by USD 4.00 billion, at a CAGR of 8.1% from 2025 to 2030. Surging investments in pharmaceutical and biotechnology sectors will drive the modular cleanroom market.
Major Market Trends & Insights
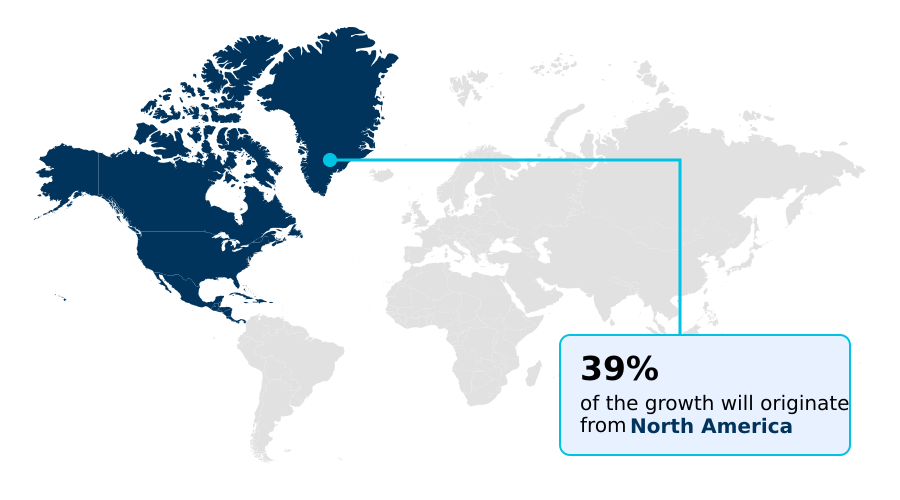
- North America dominated the market and accounted for a 39.2% growth during the forecast period.
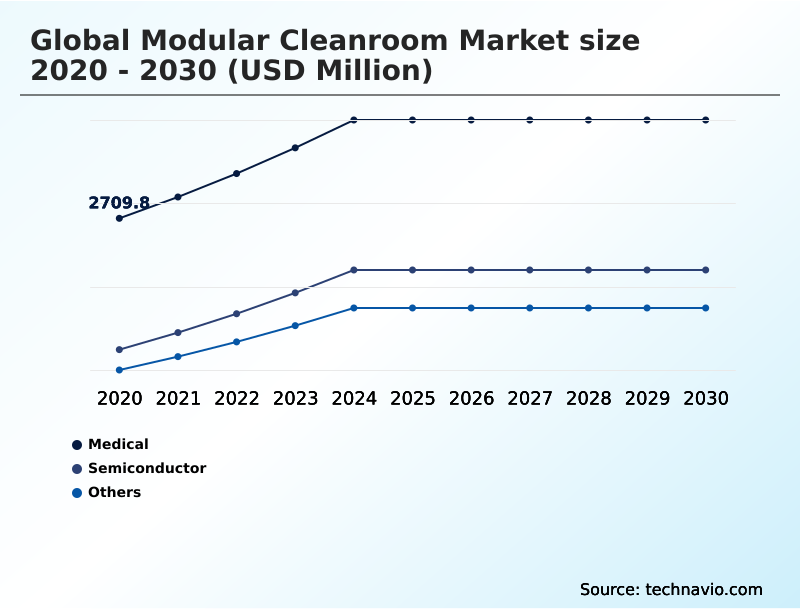
- By End-user - Medical segment was valued at USD 3.47 billion in 2024
- By Type - Hardwall segment accounted for the largest market revenue share in 2024
Market Size & Forecast
- Market Opportunities: USD 6.46 billion
- Market Future Opportunities: USD 4.00 billion
- CAGR from 2025 to 2030 : 8.1%
Market Summary
- The Modular Cleanroom Market is defined by its capacity to deliver rapidly deployable and scalable controlled environments, which are crucial for high-tech industries. The core driver is the intense capital investment in the pharmaceutical, biotechnology, and semiconductor sectors, where sterile manufacturing and aseptic processing environments are non-negotiable for ensuring product safety and efficacy.
- A key trend is the integration of smart technologies, enabling advanced particle count monitoring and predictive maintenance, which significantly enhances operational efficiency. For instance, a biotech firm developing a novel cell and gene therapy can utilize a prefabricated cleanroom system to establish a cgmp-compliant facility for clinical trials in months rather than years.
- This speed-to-market advantage is a powerful benefit of modular construction. However, the industry is not without challenges; high initial costs and the need for complex cleanroom validation services can be barriers for smaller enterprises, while customization for unique cleanroom workflows can test the limits of standardized cleanroom components.
- Sustainability is also becoming a key consideration, with a push toward energy efficiency in cleanroom hvac systems and fan filter units to reduce long-term operational expenditures. The market's dynamism reflects a broader industrial shift towards flexible infrastructure that can adapt to rapid technological and regulatory changes.
What will be the Size of the Modular Cleanroom Market during the forecast period?
Get Key Insights on Market Forecast (PDF) Get Free Sample
How is the Modular Cleanroom Market Segmented?
The modular cleanroom industry research report provides comprehensive data (region-wise segment analysis), with forecasts and estimates in "USD million" for the period 2026-2030, as well as historical data from 2020-2024 for the following segments.
- End-user
- Medical
- Semiconductor
- Others
- Type
- Hardwall
- Softwall
- Component
- Panels and walls
- HVAC and filters
- Lighting and flooring
- Pass-throughs
- Geography
- North America
- US
- Canada
- Mexico
- Europe
- Germany
- France
- UK
- APAC
- China
- India
- Japan
- South America
- Brazil
- Argentina
- Colombia
- Middle East and Africa
- Saudi Arabia
- UAE
- South Africa
- Rest of World (ROW)
- North America
By End-user Insights
The medical segment is estimated to witness significant growth during the forecast period.
The medical sector's adoption of modular cleanroom technology is driven by the urgent need for scalable production facilities in applications like pharmaceutical manufacturing and medical device assembly.
These systems are essential for creating validated aseptic processing environments compliant with stringent cgmp regulations.
By using prefabricated modular cleanroom panels and integrated systems, organizations developing cell and gene therapy products or performing sterile compounding can achieve operational readiness significantly faster than with traditional construction.
This approach supports regulatory compliance and allows for phased expansion, ensuring that as demand grows, facilities can scale efficiently.
The implementation of such controlled environments, backed by comprehensive cleanroom validation services, has been shown to reduce contamination risks, improving process yields by over 15%.
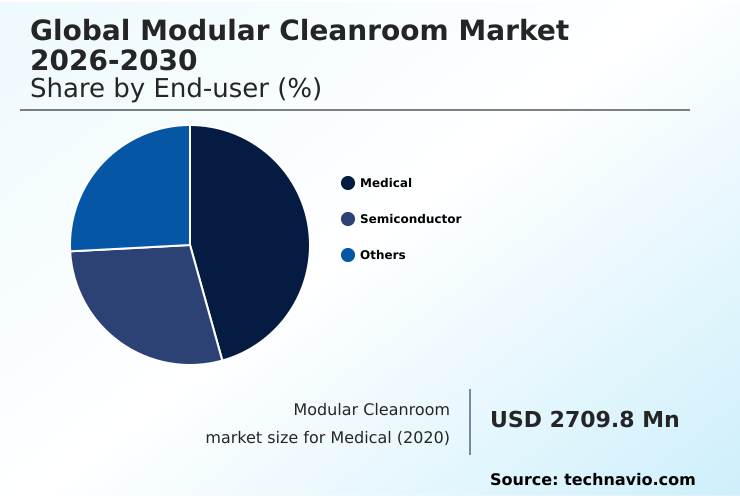
The Medical segment was valued at USD 3.47 billion in 2024 and showed a gradual increase during the forecast period.
Regional Analysis
North America is estimated to contribute 39.2% to the growth of the global market during the forecast period.Technavio’s analysts have elaborately explained the regional trends and drivers that shape the market during the forecast period.
See How Modular Cleanroom Market Demand is Rising in North America Get Free Sample
The market's geographic landscape is led by North America, which accounts for approximately 39% of the global incremental growth, driven by its advanced pharmaceutical and semiconductor industries.
However, the APAC region is projected to exhibit the fastest expansion, with a growth rate of 9.0%, fueled by massive investments in local manufacturing capabilities.
In Europe, the focus is on high-specification turnkey cleanroom solutions that ensure iso 14644 compliance and enhance operational efficiency.
Across all regions, the adoption of prefabricated cleanroom systems with precise differential pressure control is standard for achieving the required cleanroom classification and preventing controlled contamination, supporting industries from life sciences to data center cooling.
Market Dynamics
Our researchers analyzed the data with 2025 as the base year, along with the key drivers, trends, and challenges. A holistic analysis of drivers will help companies refine their marketing strategies to gain a competitive advantage.
- When evaluating the benefits of modular vs traditional cleanroom construction, decision-makers must consider factors beyond initial price, including long-term operational costs and flexibility. For example, the hardwall vs softwall cleanroom cost trade-off depends heavily on the application; hardwall systems offer superior environmental control for a semiconductor fab cleanroom design, while softwall systems provide flexibility.
- A comprehensive cleanroom construction materials guide is essential for selecting appropriate surfaces that meet cleanroom flooring and lighting standards. For regulated industries, a modular cleanroom for pharmaceutical use must satisfy a detailed cgmp cleanroom validation checklist.
- This includes validating the hvac design for aseptic processing and ensuring the correct use of a pass-through chamber for sterile transfer to maintain environmental integrity. Adherence to iso class 7 cleanroom requirements involves rigorous protocols, including periodic cleanroom particle counter calibration. As sustainability gains importance, specifying energy efficient fan filter units becomes crucial.
- While turnkey cleanroom project management simplifies deployment, customizing modular cleanroom layouts to accommodate specific workflows remains a key advantage. For short-term needs, portable cleanroom rental options offer a viable alternative, though they present different compliance challenges. Ultimately, a well-planned modular approach offers a more than 30% faster path to operational readiness compared to onsite construction.
What are the key market drivers leading to the rise in the adoption of Modular Cleanroom Industry?
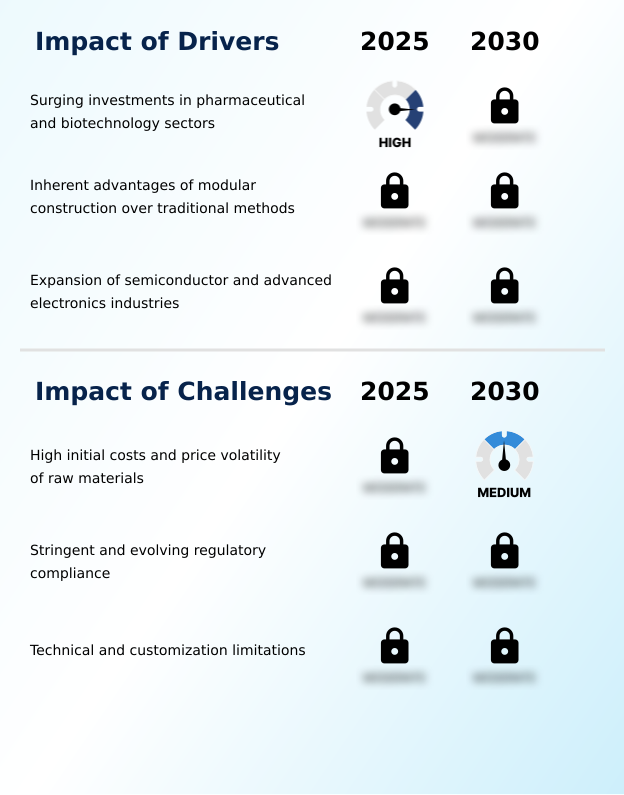
- Surging investments in the pharmaceutical and biotechnology sectors are a key driver for market growth.
- Surging investment in biotechnology applications and semiconductor fabrication is a primary market driver, heightening the demand for advanced sterile manufacturing facilities.
- The inherent speed-to-market advantage of modular construction, which leverages off-site fabrication, accelerates project timelines by over 40% compared to conventional methods. This is critical for building supply chain resilience in strategic sectors.
- High-purity zones depend on the performance of sophisticated cleanroom hvac systems and hepa filtration systems to ensure process integrity.
- As organizations race to expand capacity, the ability to rapidly deploy verified controlled environments is paramount, reinforcing the strategic value of modular designs for achieving both speed and quality in facility build-outs.
What are the market trends shaping the Modular Cleanroom Industry?
- The integration of smart technologies and Industry 4.0 principles is an emerging trend. This shift is reshaping how controlled environments are monitored, managed, and maintained.
- Emerging trends are reshaping the market, led by the integration of smart technologies for advanced environmental control. The use of IoT sensors for real-time particle count monitoring enables predictive maintenance on critical cleanroom components like fan filter units, reducing downtime by up to 30%.
- Concurrently, a focus on sustainability is driving the adoption of designs that prioritize energy efficiency, with some systems lowering energy consumption by 25%. This flexible infrastructure is expanding beyond traditional sectors, with softwall cleanroom systems being adopted for new applications such as EV battery production.
- Enhanced environmental monitoring capabilities ensure these diverse industries can maintain precise operational standards, showcasing the technology's adaptability.
What challenges does the Modular Cleanroom Industry face during its growth?
- High initial costs and the price volatility of raw materials present a key challenge to industry growth.
- Navigating high initial costs and material price volatility challenges the cost predictability of deploying new controlled environments. While contamination control solutions are critical, fluctuations in raw materials for hardwall cleanroom enclosures can lead to budget variances exceeding 15%.
- Furthermore, adhering to evolving standards like the quality management system regulation demands constant updates to cleanroom design and complex components such as air handling units. In highly specialized sectors like aerospace component assembly and advanced electronics manufacturing, extensive customization to optimize the cleanroom workflow can extend project timelines by up to 25%, offsetting some of the technology's inherent speed advantages.
Exclusive Technavio Analysis on Customer Landscape
The modular cleanroom market forecasting report includes the adoption lifecycle of the market, covering from the innovator’s stage to the laggard’s stage. It focuses on adoption rates in different regions based on penetration. Furthermore, the modular cleanroom market report also includes key purchase criteria and drivers of price sensitivity to help companies evaluate and develop their market growth analysis strategies.

Customer Landscape of Modular Cleanroom Industry
Competitive Landscape
Companies are implementing various strategies, such as strategic alliances, modular cleanroom market forecast, partnerships, mergers and acquisitions, geographical expansion, and product/service launches, to enhance their presence in the industry.
AAON Inc. - Key offerings include modular cleanroom systems, alongside comprehensive cleanroom design and validation services for regulated industries.
The industry research and growth report includes detailed analyses of the competitive landscape of the market and information about key companies, including:
- AAON Inc.
- ACMAS Technologies Pvt. Ltd.
- AES Clean Technology
- Arbonia AG
- Camfil AB
- Clean Air Products
- Clean Room Depot Inc.
- Clean Rooms International Inc.
- CleanZones LLC
- Modular Cleanrooms Inc.
- Nicomac Srl
- OCTANORM North America Inc.
- Parteco S.r.l.
- PortaFab Corp.
- Subzero Engineering
- Terra Universal Inc.
Qualitative and quantitative analysis of companies has been conducted to help clients understand the wider business environment as well as the strengths and weaknesses of key industry players. Data is qualitatively analyzed to categorize companies as pure play, category-focused, industry-focused, and diversified; it is quantitatively analyzed to categorize companies as dominant, leading, strong, tentative, and weak.
Recent Development and News in Modular cleanroom market
- In May, 2025, the United States government awarded a major contract to a consortium to build a pandemic-readiness vaccine facility, mandating a modular design to ensure completion within eighteen months.
- In April, 2025, AES Cleanroom Technology launched its Omni ASCENT system, a vertical utility solution that uses off-site manufacturing to integrate critical cleanroom utilities into an adaptable framework.
- In March, 2025, Honeywell entered a strategic partnership with Camfil to deliver integrated modular cleanroom and filtration solutions designed for the life sciences manufacturing sector.
- In February, 2025, Modulus Cleanrooms introduced a series of self-supporting hybrid modular units capable of functioning independently of a building's structural support, enhancing flexibility for leased facilities.
Dive into Technavio’s robust research methodology, blending expert interviews, extensive data synthesis, and validated models for unparalleled Modular Cleanroom Market insights. See full methodology.
| Market Scope | |
|---|---|
| Page number | 292 |
| Base year | 2025 |
| Historic period | 2020-2024 |
| Forecast period | 2026-2030 |
| Growth momentum & CAGR | Accelerate at a CAGR of 8.1% |
| Market growth 2026-2030 | USD 4000.3 million |
| Market structure | Fragmented |
| YoY growth 2025-2026(%) | 7.8% |
| Key countries | US, Canada, Mexico, Germany, Ireland, France, UK, Italy, Switzerland, China, India, Japan, South Korea, Singapore, Australia, Brazil, Argentina, Colombia, Saudi Arabia, UAE, South Africa, Israel and Egypt |
| Competitive landscape | Leading Companies, Market Positioning of Companies, Competitive Strategies, and Industry Risks |
Research Analyst Overview
- The market for modular cleanroom solutions is expanding as industries demand agile and compliant controlled environments. Driven by the need for rapid deployment in sterile manufacturing and research, modular construction utilizes off-site fabrication of core cleanroom components like modular cleanroom panels. This approach can reduce facility construction timelines by up to 40%.
- Boardroom decisions are increasingly influenced by the long-term operational savings offered by energy-efficient cleanroom hvac systems, which incorporate advanced air handling units and fan filter units. A crucial aspect is ensuring stringent environmental control through effective contamination control solutions, including hepa filtration systems and laminar airflow units that maintain differential pressure control.
- Whether deploying hardwall cleanroom enclosures for aseptic processing environments or flexible softwall cleanroom systems for sterile compounding, adherence to iso 14644 compliance and cgmp regulations is paramount. End-to-end project success relies on a combination of robust cleanroom design, precise particle count monitoring, and comprehensive cleanroom validation services, often delivered as turnkey cleanroom solutions.
What are the Key Data Covered in this Modular Cleanroom Market Research and Growth Report?
-
What is the expected growth of the Modular Cleanroom Market between 2026 and 2030?
-
USD 4.00 billion, at a CAGR of 8.1%
-
-
What segmentation does the market report cover?
-
The report is segmented by End-user (Medical, Semiconductor, and Others), Type (Hardwall, and Softwall), Component (Panels and walls, HVAC and filters, Lighting and flooring, and Pass-throughs) and Geography (North America, Europe, APAC, South America, Middle East and Africa)
-
-
Which regions are analyzed in the report?
-
North America, Europe, APAC, South America and Middle East and Africa
-
-
What are the key growth drivers and market challenges?
-
Surging investments in pharmaceutical and biotechnology sectors, High initial costs and price volatility of raw materials
-
-
Who are the major players in the Modular Cleanroom Market?
-
AAON Inc., ACMAS Technologies Pvt. Ltd., AES Clean Technology, Arbonia AG, Camfil AB, Clean Air Products, Clean Room Depot Inc., Clean Rooms International Inc., CleanZones LLC, Modular Cleanrooms Inc., Nicomac Srl, OCTANORM North America Inc., Parteco S.r.l., PortaFab Corp., Subzero Engineering and Terra Universal Inc.
-
Market Research Insights
- The market's momentum is driven by its ability to enhance operational efficiency and provide a critical speed-to-market advantage across diverse sectors. From pharmaceutical manufacturing and semiconductor fabrication to emerging biotechnology applications and EV battery production, the demand for scalable production is universal. A sustainable design approach improves energy efficiency, reducing operational costs by over 20%.
- The adoption of this flexible infrastructure bolsters supply chain resilience and ensures regulatory compliance with standards like the quality management system regulation. In practice, modular systems reduce facility deployment times by up to 40% compared to traditional builds, offering superior cost predictability and streamlined workflows for applications requiring strict controlled contamination and environmental monitoring.
We can help! Our analysts can customize this modular cleanroom market research report to meet your requirements.
 RIA -
RIA - 
