Modular Instruments Market Analysis APAC, North America, Europe, South America, Middle East and Africa - US, China, Germany, Japan, UK - Size and Forecast 2024-2028

Modular Instruments Market Analysis APAC, North America, Europe, South America, Middle East and Africa - US, China, Germany, Japan, UK - Size and Forecast 2024-2028

Published: May 2024 179 Pages SKU: IRTNTR43842

Market Overview at a Glance

$1.50 B
Market Opportunity
11.74%
CAGR
10.19
YoY growth 2023-2024(%)

Modular Instruments Market Size 2024-2028 

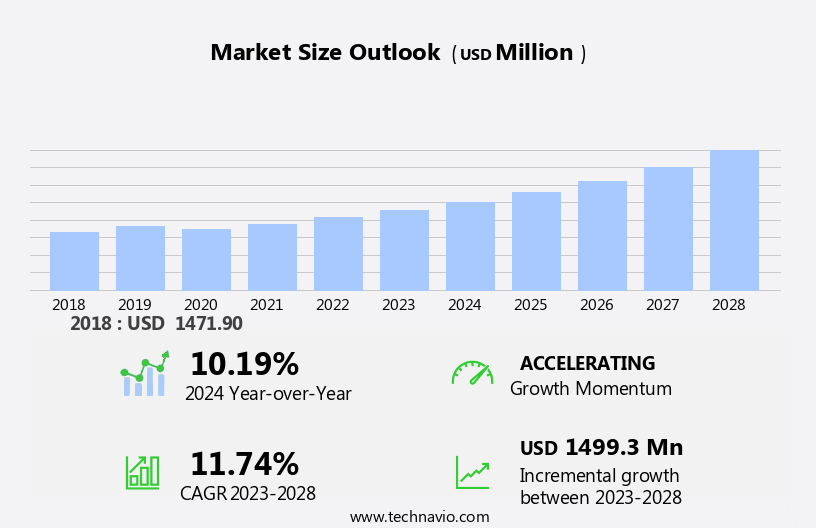
The modular instruments market size is forecast to increase by USD 1.5 billion at a CAGR of 11.74% between 2023 and 2028.

  • The market is experiencing significant growth due to the increasing demand for automation in various industries. Hardware devices, such as functional cards, are becoming increasingly popular as they offer flexibility and ease of use in benchtop tests and measurements. The trend towards faceless instruments, which prioritize functionality over user interface, is also driving market growth.
  • Modular instruments are hardware devices designed for measurement and automation applications in various sectors, including telecommunications, electronics, and semiconductors. Interoperability in telecommunications and testing equipment is another key factor, as price-sensitive and multiple technology solutions are necessary for businesses to remain competitive. The report provides an in-depth analysis of these market growth factors and more, offering valuable insights for stakeholders in the modular instruments industry.

What will be the Modular Instruments Market Size During the Forecast Period?

Modular Instruments Market Size

 Request Free Sample

  • The market is witnessing significant growth due to the increasing demand for advanced measurement and automation solutions in various industries. These instruments offer flexibility, scalability, and functionality, making them an essential component of modern technology infrastructures. They consist of functional cards that can be interconnected using sole instrument buses to create customized measurement systems. These instruments facilitate benchtop tests, data transfer, and communication between different devices. Communication and networking play a crucial role in the market.
  • Furthermore, the integration of wireless technologies like LTE and mobile data traffic has led to the development of smart devices that require sophisticated measurement solutions. Modular instruments offer seamless communication capabilities, enabling real-time data transfer and analysis. The user interface of modular instruments is another critical factor driving the market growth. Faceless instruments, which offer a high degree of customization and ease of use, are gaining popularity. A test program can be implemented on these instruments, allowing users to perform various measurements and automate testing processes. Scalability is another essential aspect of modular instruments. These instruments can be easily upgraded or expanded as per the changing requirements of an organization.

How is this market segmented and which is the largest segment?

The market research report provides comprehensive data (region-wise segment analysis), with forecasts and estimates in "USD billion" for the period 2024-2028, as well as historical data from 2018-2022 for the following segments.
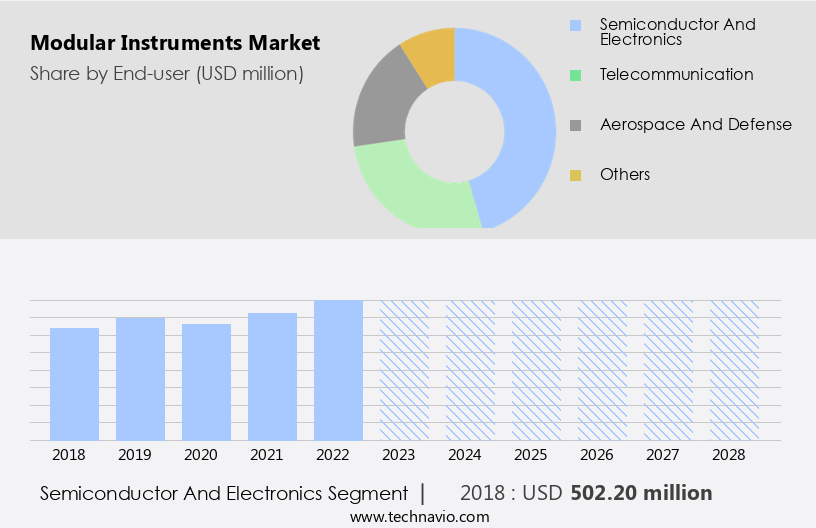
  • End-user
    • Semiconductor and electronics
    • Telecommunication
    • Aerospace and defense
    • Others
  • Product
    • PXI platform
    • VXI platform
    • AXIe platform
  • Geography
    • APAC
      • China
      • Japan
    • North America
      • US
    • Europe
      • Germany
      • UK
    • South America
    • Middle East and Africa

By End-user Insights

  • The semiconductor and electronics segment is estimated to witness significant growth during the forecast period.

In the realm of semiconductors and electronics, various applications utilize modular instruments for advancements in mechanical and electrical engineering, submicron and nano-precision technology, photonics production, and nanotechnology. Circuit board manufacturing holds significant importance due to its role in introducing new, quicker, and more precise manufacturing techniques. This progression is anticipated to generate demand for modular instruments. The persistent expansion of the electronics sector and the quest for advanced technology will fuel research and development activities, thereby amplifying the demand for modular instruments. Additionally, China's imports of semiconductors, valued at over USD200 billion, are essential for the production of smart devices, consumer electronics, and computing products.

Modular Instruments Market Size

Get a glance at the market report of share of various segments Request Free Sample

The semiconductor and electronics segment was valued at USD 502.20 million in 2018 and showed a gradual increase during the forecast period.

Regional Analysis

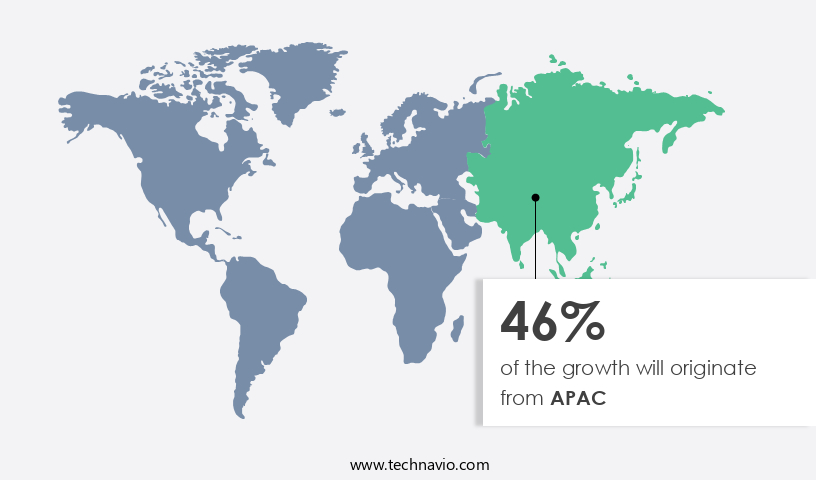
  • APAC is estimated to contribute 46% to the growth of the global market during the forecast period.

Technavio's analysts have elaborately explained the regional trends and drivers that shape the market during the forecast period.

Modular Instruments Market Share by Geography

For more insights on the market share of various regions, Request Free Sample

In the electronic devices sector, communication and networking technologies, including Long-Term Evolution (LTE) and Fourth Generation (4G) wireless technologies, are driving growth in the market in the Asia Pacific (APAC) region. Modular instruments are increasingly being utilized in smart devices and mobile data traffic applications due to their flexibility and ease of integration. APAC countries are significantly investing in modular instruments for the IoT (Internet of Things) and defense and aviation industries. China, Japan, and South Korea are at the forefront of modular instrument production in APAC, with numerous companies in these countries manufacturing cost-effective, advanced test equipment for defense and aerospace applications.

Market Dynamics

Our researchers analyzed the data with 2023 as the base year, along with the key drivers, trends, and challenges. A holistic analysis of drivers will help companies refine their marketing strategies to gain a competitive advantage.

What are the key market drivers leading to the rise in adoption of Modular Instruments Market?

Growth in communication sector in APAC is the key driver of the market.

  • The market is experiencing substantial expansion due to the increasing adoption of communication solutions by various industries, including telecommunications, aerospace and defense, and automotive and transportation. Telecommunication service providers hold a prominent position in the communication market, contributing significantly to its growth. In the telecommunications sector, modular instruments enable high-quality and high-performance services, making them indispensable for mobile device manufacturers, network equipment manufacturers, and telecommunication service providers. The Asia Pacific (APAC) region presents lucrative opportunities for modular communication equipment. The region's rapid growth in the communication sector, driven by the increasing demand for high-speed connectivity and advanced communication systems, is fueling the adoption of modular communication instruments.
  • Moreover, China, in particular, is a major contributor to the global communication sector and the largest market for modular communication equipment in APAC. Ethernet and fiber optics are the primary technologies driving the market in various industries. PXI, AXIe, and VXI are the most commonly used standards in modular instruments for communication applications. These standards ensure interoperability and compatibility among various components, making it easier for manufacturers to design and build modular communication systems. In conclusion, the market is witnessing a strong growth due to the increasing demand for high-performance communication systems in various industries. Telecommunication service providers are the major consumers of modular communication instruments, while APAC is the fastest-growing market for these instruments.

What are the market trends shaping the Modular Instruments Market?

Interoperability in T and M equipment is the upcoming trend in the market.

  • In today's electronic and electrical landscape, the interoperability of test and measurement (T&M) equipment is crucial for end-users to ensure seamless integration of various devices from different manufacturers. This challenge applies to both heterogeneous sets of products, such as home security systems, video monitors, and networking equipment, as well as homogeneous sets, like routers and switches. End-users often encounter compatibility issues between T&M devices, which can hinder their ability to use a diverse range of products. This issue poses a significant challenge for companies, as it may deter potential customers from purchasing their equipment. To address this problem, hardware devices in the T&M market are evolving to include functional cards and user-friendly interfaces.
  • Moreover, these advancements enable benchtop tests and measurements to be conducted more efficiently and accurately. Moreover, faceless instruments with advanced test programs are increasingly popular, as they offer automated solutions to complex testing scenarios. These developments aim to streamline the testing process, ensuring that T&M equipment functions optimally in various environments. As the demand for interoperability grows, companies are investing in research and development to create more compatible solutions, ultimately benefiting end-users and the industry as a whole.

What challenges does Modular Instruments Market face during the growth?

Necessity for price-sensitive and multiple technology solutions is a key challenge affecting market growth.

  • The electronics and semiconductor industry continues to advance, driving the development of innovative modular instruments. IoT, 5G, LTE Advanced, LTE gateways, access points, machine vision, and motion control technologies are leading the charge in this evolution. However, the increasing reliance on raw materials sourced from China and the subsequent rise in production costs due to import duties pose a challenge for manufacturers. This, in turn, impacts the affordability of modular instruments for price-sensitive end-users.
  • Moreover, For instance, local Chinese companies offer digital ultrasonic flow detectors at significantly lower prices, around USD1,000, compared to those sold by major suppliers. In the competitive landscape, companies must maintain a balance between innovation and affordability to cater to the evolving needs of consumers.

Exclusive Customer Landscape

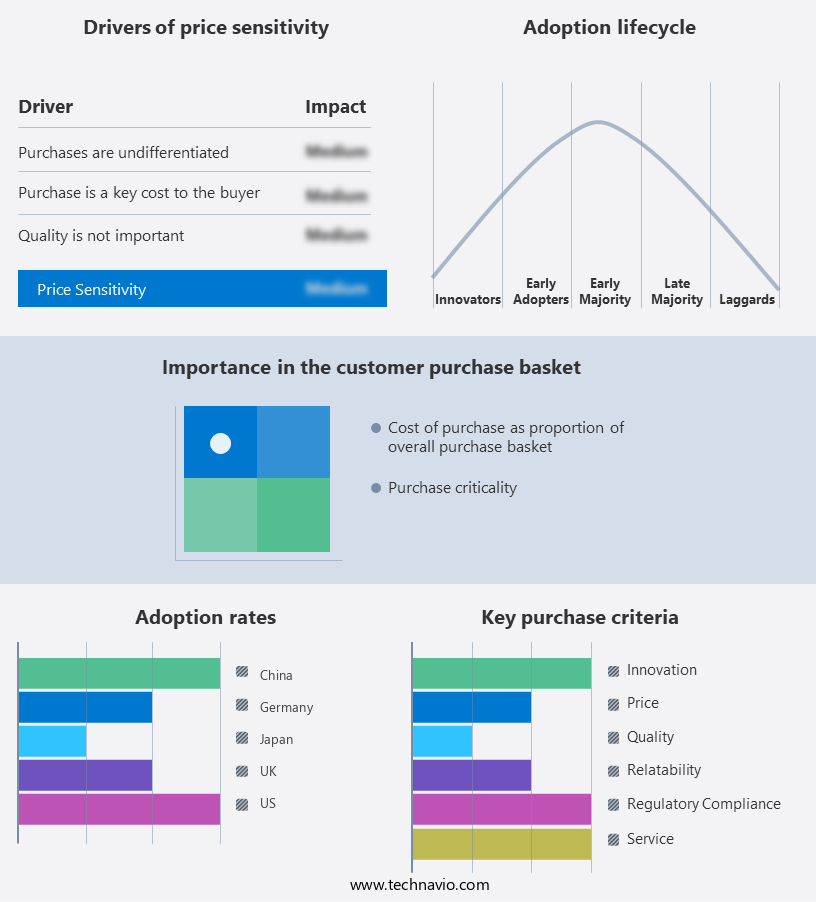
The market forecasting report includes the adoption lifecycle of the market, covering from the innovator's stage to the laggard's stage. It focuses on adoption rates in different regions based on penetration. Furthermore, the market report also includes key purchase criteria and drivers of price sensitivity to help companies evaluate and develop their market growth analysis strategies.

Modular Instruments Market Share by Geography

 Customer Landscape

Key Companies & Market Insights

Companies are implementing various strategies, such as strategic alliances, market forecast, partnerships, mergers and acquisitions, geographical expansion, and product/service launches, to enhance their presence in the market.

The market research and growth report includes detailed analyses of the competitive landscape of the market and information about key companies, including:

  • ADLINK Technology Inc.
  • AMETEK Inc.
  • Aplab Ltd
  • Astronics Corp.
  • Chroma ATE Inc.
  • Coolisys Technology Inc.
  • EXFO Inc.
  • Fortive Corp.
  • GOPEL electronic GmbH
  • Guzik Technical Enterprises
  • Keysight Technologies Inc.
  • National Instruments Corp.
  • Pickering Interfaces Ltd.
  • Rohde and Schwarz GmbH and Co. KG
  • Sulzer Ltd.
  • Teledyne Technologies Inc.
  • Teradyne Inc.
  • The Marvin Group
  • Viavi Solutions Inc.
  • Yokogawa Electric Corp.

Qualitative and quantitative analysis of companies has been conducted to help clients understand the wider business environment as well as the strengths and weaknesses of key market players. Data is qualitatively analyzed to categorize companies as pure play, category-focused, industry-focused, and diversified; it is quantitatively analyzed to categorize companies as dominant, leading, strong, tentative, and weak.

Research Analyst Overview

Modular instruments have gained significant traction in various industries due to their flexibility and scalability. These electronic devices are widely used in communication and networking applications, particularly in the context of LTE, 4G, and 5G wireless technologies. Modular instruments play a crucial role in facilitating data transfer and communication in smart devices, IoT, and telecommunications. The use of modular instruments extends beyond wireless technologies, with applications in sectors such as aerospace and defense, automotive and transportation, electronics and semiconductor, and machine vision. Modular instruments enable synchronized measurements, benchtop tests, and functional card implementation in various industrial test benches. Modular instruments come in various forms, including PXI, VXI, and AXIE, and can be integrated with hardware devices such as PCIe, USB, and Ethernet.

Moreover, their deployment capabilities make them suitable for various applications, from portable chassis to industrial-scale systems. Modular instruments offer high data transfer rates and system compatibility, making them ideal for implementing test programs and user interfaces. Their use in automation and motion control applications is also increasing due to their scalability and functional capabilities. In summary, modular instruments are essential components in various industries, enabling communication, data transfer, and measurement applications in the context of wireless technologies, industrial test benches, and automation systems. Their flexibility, scalability, and compatibility make them indispensable tools for implementing advanced technologies such as LTE advanced, 5G, and IoT devices.

Market Scope

Report Coverage

Details

Page number

179

Base year

2023

Historic period

2018-2022

Forecast period

2024-2028

Growth momentum & CAGR

Accelerate at a CAGR of 11.74%

Market growth 2024-2028

USD 1.5 billion

Market structure

Fragmented

YoY growth 2023-2024(%)

10.19

Key countries

US, China, Germany, Japan, and UK

Competitive landscape

Leading Companies, Market Positioning of Companies, Competitive Strategies, and Industry Risks

Request Free Sample

What are the Key Data Covered in this Market Research and Growth Report?

  • CAGR of the market during the forecast period
  • Detailed information on factors that will drive the market growth and forecasting between 2024 and 2028
  • Precise estimation of the size of the market  and its contribution of the market in focus to the parent market
  • Accurate predictions about upcoming market growth and trends and changes in consumer behaviour
  • Growth of the market across APAC, North America, Europe, South America, and Middle East and Africa
  • Thorough analysis of the market's competitive landscape and detailed information about companies
  • Comprehensive analysis of factors that will challenge the growth of market companies

We can help! Our analysts can customize this market research report to meet your requirements. Get in touch

1 Executive Summary

  • 1.1 Market overview
    • Executive Summary - Chart on Market Overview
    • Executive Summary - Data Table on Market Overview
    • Executive Summary - Chart on Global Market Characteristics
    • Executive Summary - Chart on Market by Geography
    • Executive Summary - Chart on Market Segmentation by End-user
    • Executive Summary - Chart on Market Segmentation by Product
    • Executive Summary - Chart on Incremental Growth
    • Executive Summary - Data Table on Incremental Growth
    • Executive Summary - Chart on Company Market Positioning

2 Market Landscape

  • 2.1 Market ecosystem
    • Parent Market
    • Data Table on - Parent Market
  • 2.2 Market characteristics
    • Market characteristics analysis
  • 2.3 Value chain analysis
    • Value Chain Analysis

3 Market Sizing

  • 3.1 Market definition
    • Offerings of companies included in the market definition
  • 3.2 Market segment analysis
    • Market segments
  • 3.3 Market size 2023
    • 3.4 Market outlook: Forecast for 2023-2028
      • Chart on Global - Market size and forecast 2023-2028 ($ million)
      • Data Table on Global - Market size and forecast 2023-2028 ($ million)
      • Chart on Global Market: Year-over-year growth 2023-2028 (%)
      • Data Table on Global Market: Year-over-year growth 2023-2028 (%)

    4 Historic Market Size

    • 4.1 Global Modular Instruments Market 2018 - 2022
      • Historic Market Size - Data Table on Global Modular Instruments Market 2018 - 2022 ($ million)
    • 4.2 End-user segment analysis 2018 - 2022
      • Historic Market Size - End-user Segment 2018 - 2022 ($ million)
    • 4.3 Product segment analysis 2018 - 2022
      • Historic Market Size - Product Segment 2018 - 2022 ($ million)
    • 4.4 Geography segment analysis 2018 - 2022
      • Historic Market Size - Geography Segment 2018 - 2022 ($ million)
    • 4.5 Country segment analysis 2018 - 2022
      • Historic Market Size - Country Segment 2018 - 2022 ($ million)

    5 Five Forces Analysis

    • 5.1 Five forces summary
      • Five forces analysis - Comparison between 2023 and 2028
    • 5.2 Bargaining power of buyers
      • Bargaining power of buyers - Impact of key factors 2023 and 2028
    • 5.3 Bargaining power of suppliers
      • Bargaining power of suppliers - Impact of key factors in 2023 and 2028
    • 5.4 Threat of new entrants
      • Threat of new entrants - Impact of key factors in 2023 and 2028
    • 5.5 Threat of substitutes
      • Threat of substitutes - Impact of key factors in 2023 and 2028
    • 5.6 Threat of rivalry
      • Threat of rivalry - Impact of key factors in 2023 and 2028
    • 5.7 Market condition
      • Chart on Market condition - Five forces 2023 and 2028

    6 Market Segmentation by End-user

    • 6.1 Market segments
      • Chart on End-user - Market share 2023-2028 (%)
      • Data Table on End-user - Market share 2023-2028 (%)
    • 6.2 Comparison by End-user
      • Chart on Comparison by End-user
      • Data Table on Comparison by End-user
    • 6.3 Semiconductor and electronics - Market size and forecast 2023-2028
      • Chart on Semiconductor and electronics - Market size and forecast 2023-2028 ($ million)
      • Data Table on Semiconductor and electronics - Market size and forecast 2023-2028 ($ million)
      • Chart on Semiconductor and electronics - Year-over-year growth 2023-2028 (%)
      • Data Table on Semiconductor and electronics - Year-over-year growth 2023-2028 (%)
    • 6.4 Telecommunication - Market size and forecast 2023-2028
      • Chart on Telecommunication - Market size and forecast 2023-2028 ($ million)
      • Data Table on Telecommunication - Market size and forecast 2023-2028 ($ million)
      • Chart on Telecommunication - Year-over-year growth 2023-2028 (%)
      • Data Table on Telecommunication - Year-over-year growth 2023-2028 (%)
    • 6.5 Aerospace and defense - Market size and forecast 2023-2028
      • Chart on Aerospace and defense - Market size and forecast 2023-2028 ($ million)
      • Data Table on Aerospace and defense - Market size and forecast 2023-2028 ($ million)
      • Chart on Aerospace and defense - Year-over-year growth 2023-2028 (%)
      • Data Table on Aerospace and defense - Year-over-year growth 2023-2028 (%)
    • 6.6 Others - Market size and forecast 2023-2028
      • Chart on Others - Market size and forecast 2023-2028 ($ million)
      • Data Table on Others - Market size and forecast 2023-2028 ($ million)
      • Chart on Others - Year-over-year growth 2023-2028 (%)
      • Data Table on Others - Year-over-year growth 2023-2028 (%)
    • 6.7 Market opportunity by End-user
      • Market opportunity by End-user ($ million)
      • Data Table on Market opportunity by End-user ($ million)

    7 Market Segmentation by Product

    • 7.1 Market segments
      • Chart on Product - Market share 2023-2028 (%)
      • Data Table on Product - Market share 2023-2028 (%)
    • 7.2 Comparison by Product
      • Chart on Comparison by Product
      • Data Table on Comparison by Product
    • 7.3 PXI platform - Market size and forecast 2023-2028
      • Chart on PXI platform - Market size and forecast 2023-2028 ($ million)
      • Data Table on PXI platform - Market size and forecast 2023-2028 ($ million)
      • Chart on PXI platform - Year-over-year growth 2023-2028 (%)
      • Data Table on PXI platform - Year-over-year growth 2023-2028 (%)
    • 7.4 VXI platform - Market size and forecast 2023-2028
      • Chart on VXI platform - Market size and forecast 2023-2028 ($ million)
      • Data Table on VXI platform - Market size and forecast 2023-2028 ($ million)
      • Chart on VXI platform - Year-over-year growth 2023-2028 (%)
      • Data Table on VXI platform - Year-over-year growth 2023-2028 (%)
    • 7.5 AXIe platform - Market size and forecast 2023-2028
      • Chart on AXIe platform - Market size and forecast 2023-2028 ($ million)
      • Data Table on AXIe platform - Market size and forecast 2023-2028 ($ million)
      • Chart on AXIe platform - Year-over-year growth 2023-2028 (%)
      • Data Table on AXIe platform - Year-over-year growth 2023-2028 (%)
    • 7.6 Market opportunity by Product
      • Market opportunity by Product ($ million)
      • Data Table on Market opportunity by Product ($ million)

    8 Customer Landscape

    • 8.1 Customer landscape overview
      • Analysis of price sensitivity, lifecycle, customer purchase basket, adoption rates, and purchase criteria

    9 Geographic Landscape

    • 9.1 Geographic segmentation
      • Chart on Market share by geography 2023-2028 (%)
      • Data Table on Market share by geography 2023-2028 (%)
    • 9.2 Geographic comparison
      • Chart on Geographic comparison
      • Data Table on Geographic comparison
    • 9.3 APAC - Market size and forecast 2023-2028
      • Chart on APAC - Market size and forecast 2023-2028 ($ million)
      • Data Table on APAC - Market size and forecast 2023-2028 ($ million)
      • Chart on APAC - Year-over-year growth 2023-2028 (%)
      • Data Table on APAC - Year-over-year growth 2023-2028 (%)
    • 9.4 North America - Market size and forecast 2023-2028
      • Chart on North America - Market size and forecast 2023-2028 ($ million)
      • Data Table on North America - Market size and forecast 2023-2028 ($ million)
      • Chart on North America - Year-over-year growth 2023-2028 (%)
      • Data Table on North America - Year-over-year growth 2023-2028 (%)
    • 9.5 Europe - Market size and forecast 2023-2028
      • Chart on Europe - Market size and forecast 2023-2028 ($ million)
      • Data Table on Europe - Market size and forecast 2023-2028 ($ million)
      • Chart on Europe - Year-over-year growth 2023-2028 (%)
      • Data Table on Europe - Year-over-year growth 2023-2028 (%)
    • 9.6 South America - Market size and forecast 2023-2028
      • Chart on South America - Market size and forecast 2023-2028 ($ million)
      • Data Table on South America - Market size and forecast 2023-2028 ($ million)
      • Chart on South America - Year-over-year growth 2023-2028 (%)
      • Data Table on South America - Year-over-year growth 2023-2028 (%)
    • 9.7 Middle East and Africa - Market size and forecast 2023-2028
      • Chart on Middle East and Africa - Market size and forecast 2023-2028 ($ million)
      • Data Table on Middle East and Africa - Market size and forecast 2023-2028 ($ million)
      • Chart on Middle East and Africa - Year-over-year growth 2023-2028 (%)
      • Data Table on Middle East and Africa - Year-over-year growth 2023-2028 (%)
    • 9.8 US - Market size and forecast 2023-2028
      • Chart on US - Market size and forecast 2023-2028 ($ million)
      • Data Table on US - Market size and forecast 2023-2028 ($ million)
      • Chart on US - Year-over-year growth 2023-2028 (%)
      • Data Table on US - Year-over-year growth 2023-2028 (%)
    • 9.9 China - Market size and forecast 2023-2028
      • Chart on China - Market size and forecast 2023-2028 ($ million)
      • Data Table on China - Market size and forecast 2023-2028 ($ million)
      • Chart on China - Year-over-year growth 2023-2028 (%)
      • Data Table on China - Year-over-year growth 2023-2028 (%)
    • 9.10 Germany - Market size and forecast 2023-2028
      • Chart on Germany - Market size and forecast 2023-2028 ($ million)
      • Data Table on Germany - Market size and forecast 2023-2028 ($ million)
      • Chart on Germany - Year-over-year growth 2023-2028 (%)
      • Data Table on Germany - Year-over-year growth 2023-2028 (%)
    • 9.11 Japan - Market size and forecast 2023-2028
      • Chart on Japan - Market size and forecast 2023-2028 ($ million)
      • Data Table on Japan - Market size and forecast 2023-2028 ($ million)
      • Chart on Japan - Year-over-year growth 2023-2028 (%)
      • Data Table on Japan - Year-over-year growth 2023-2028 (%)
    • 9.12 UK - Market size and forecast 2023-2028
      • Chart on UK - Market size and forecast 2023-2028 ($ million)
      • Data Table on UK - Market size and forecast 2023-2028 ($ million)
      • Chart on UK - Year-over-year growth 2023-2028 (%)
      • Data Table on UK - Year-over-year growth 2023-2028 (%)
    • 9.13 Market opportunity by geography
      • Market opportunity by geography ($ million)
      • Data Tables on Market opportunity by geography ($ million)

    10 Drivers, Challenges, and Opportunity/Restraints

    • 10.1 Market drivers
      • 10.2 Market challenges
        • 10.3 Impact of drivers and challenges
          • Impact of drivers and challenges in 2023 and 2028
        • 10.4 Market opportunities/restraints

          11 Competitive Landscape

          • 11.1 Overview
            • 11.2 Competitive Landscape
              • Overview on criticality of inputs and factors of differentiation
            • 11.3 Landscape disruption
              • Overview on factors of disruption
            • 11.4 Industry risks
              • Impact of key risks on business

            12 Competitive Analysis

            • 12.1 Companies profiled
              • Companies covered
            • 12.2 Market positioning of companies
              • Matrix on companies position and classification
            • 12.3 ADLINK Technology Inc.
              • ADLINK Technology Inc. - Overview
              • ADLINK Technology Inc. - Business segments
              • ADLINK Technology Inc. - Key offerings
              • ADLINK Technology Inc. - Segment focus
            • 12.4 AMETEK Inc.
              • AMETEK Inc. - Overview
              • AMETEK Inc. - Business segments
              • AMETEK Inc. - Key news
              • AMETEK Inc. - Key offerings
              • AMETEK Inc. - Segment focus
            • 12.5 Astronics Corp.
              • Astronics Corp. - Overview
              • Astronics Corp. - Business segments
              • Astronics Corp. - Key offerings
              • Astronics Corp. - Segment focus
            • 12.6 Chroma ATE Inc.
              • Chroma ATE Inc. - Overview
              • Chroma ATE Inc. - Business segments
              • Chroma ATE Inc. - Key offerings
              • Chroma ATE Inc. - Segment focus
            • 12.7 Coolisys Technology Inc.
              • Coolisys Technology Inc. - Overview
              • Coolisys Technology Inc. - Product / Service
              • Coolisys Technology Inc. - Key offerings
            • 12.8 Fortive Corp.
              • Fortive Corp. - Overview
              • Fortive Corp. - Business segments
              • Fortive Corp. - Key news
              • Fortive Corp. - Key offerings
              • Fortive Corp. - Segment focus
            • 12.9 GOPEL electronic GmbH
              • GOPEL electronic GmbH - Overview
              • GOPEL electronic GmbH - Product / Service
              • GOPEL electronic GmbH - Key offerings
            • 12.10 Keysight Technologies Inc.
              • Keysight Technologies Inc. - Overview
              • Keysight Technologies Inc. - Business segments
              • Keysight Technologies Inc. - Key offerings
              • Keysight Technologies Inc. - Segment focus
            • 12.11 National Instruments Corp.
              • National Instruments Corp. - Overview
              • National Instruments Corp. - Product / Service
              • National Instruments Corp. - Key news
              • National Instruments Corp. - Key offerings
            • 12.12 Rohde and Schwarz GmbH and Co. KG
              • Rohde and Schwarz GmbH and Co. KG - Overview
              • Rohde and Schwarz GmbH and Co. KG - Product / Service
              • Rohde and Schwarz GmbH and Co. KG - Key offerings
            • 12.13 Sulzer Ltd.
              • Sulzer Ltd. - Overview
              • Sulzer Ltd. - Business segments
              • Sulzer Ltd. - Key news
              • Sulzer Ltd. - Key offerings
              • Sulzer Ltd. - Segment focus
            • 12.14 Teledyne Technologies Inc.
              • Teledyne Technologies Inc. - Overview
              • Teledyne Technologies Inc. - Business segments
              • Teledyne Technologies Inc. - Key news
              • Teledyne Technologies Inc. - Key offerings
              • Teledyne Technologies Inc. - Segment focus
            • 12.15 Teradyne Inc.
              • Teradyne Inc. - Overview
              • Teradyne Inc. - Business segments
              • Teradyne Inc. - Key news
              • Teradyne Inc. - Key offerings
              • Teradyne Inc. - Segment focus
            • 12.16 Viavi Solutions Inc.
              • Viavi Solutions Inc. - Overview
              • Viavi Solutions Inc. - Business segments
              • Viavi Solutions Inc. - Key offerings
              • Viavi Solutions Inc. - Segment focus
            • 12.17 Yokogawa Electric Corp.
              • Yokogawa Electric Corp. - Overview
              • Yokogawa Electric Corp. - Business segments
              • Yokogawa Electric Corp. - Key offerings
              • Yokogawa Electric Corp. - Segment focus

            13 Appendix

            • 13.1 Scope of the report
              • 13.2 Inclusions and exclusions checklist
                • Inclusions checklist
                • Exclusions checklist
              • 13.3 Currency conversion rates for US$
                • Currency conversion rates for US$
              • 13.4 Research methodology
                • Research methodology
              • 13.5 Data procurement
                • Information sources
              • 13.6 Data validation
                • Data validation
              • 13.7 Validation techniques employed for market sizing
                • Validation techniques employed for market sizing
              • 13.8 Data synthesis
                • Data synthesis
              • 13.9 360 degree market analysis
                • 360 degree market analysis
              • 13.10 List of abbreviations
                • List of abbreviations

              Research Methodology

              Technavio presents a detailed picture of the market by way of study, synthesis, and summation of data from multiple sources. The analysts have presented the various facets of the market with a particular focus on identifying the key industry influencers. The data thus presented is comprehensive, reliable, and the result of extensive research, both primary and secondary.

              INFORMATION SOURCES

              Primary sources

              • Manufacturers and suppliers
              • Channel partners
              • Industry experts
              • Strategic decision makers

              Secondary sources

              • Industry journals and periodicals
              • Government data
              • Financial reports of key industry players
              • Historical data
              • Press releases

              DATA ANALYSIS

              Data Synthesis

              • Collation of data
              • Estimation of key figures
              • Analysis of derived insights

              Data Validation

              • Triangulation with data models
              • Reference against proprietary databases
              • Corroboration with industry experts

              REPORT WRITING

              Qualitative

              • Market drivers
              • Market challenges
              • Market trends
              • Five forces analysis

              Quantitative

              • Market size and forecast
              • Market segmentation
              • Geographical insights
              • Competitive landscape

              Interested in this report?

              Get your sample now to see our research methodology and insights!

              Download Now

              Frequently Asked Questions

              Modular Instruments market growth will increase by $ 1499.3 mn during 2024-2028 .

              The Modular Instruments market is expected to grow at a CAGR of 11.74% during 2024-2028 .

              Modular Instruments market is segmented by End-user( Semiconductor and electronics, Telecommunication, Aerospace and defense, Others) Product( PXI platform, VXI platform, AXIe platform, MEA, South America)

              ADLINK Technology Inc., AMETEK Inc., Aplab Ltd, Astronics Corp., Chroma ATE Inc., Coolisys Technology Inc., EXFO Inc., Fortive Corp., GOPEL electronic GmbH, Guzik Technical Enterprises, Keysight Technologies Inc., National Instruments Corp., Pickering Interfaces Ltd., Rohde and Schwarz GmbH and Co. KG, Sulzer Ltd., Teledyne Technologies Inc., Teradyne Inc., The Marvin Group, Viavi Solutions Inc., Yokogawa Electric Corp. are a few of the key vendors in the Modular Instruments market.

              APAC will register the highest growth rate of 46% among the other regions. Therefore, the Modular Instruments market in APAC is expected to garner significant business opportunities for the vendors during the forecast period.

              US, China, Germany, Japan, UK

              • Growth in communication sector in APACCommunication T and M solutions are being adopted widely by end-users is the driving factor this market.
              • such as telecommunication service providers is the driving factor this market.
              • mobile device manufacturers is the driving factor this market.
              • network equipment manufacturers is the driving factor this market.
              • and telecommunication service providers is the driving factor this market.
              • which have led to the growth of the modular instruments market worldwide. Telecommunication service providers are expected to dominate the communication modular instruments market and contribute the highest market share during the forecast period. APAC offers significant growth opportunities for modular communication equipment as end-users is the driving factor this market.
              • such as mobile device manufacturers and enterprises is the driving factor this market.
              • are turning to modular communication instruments to offer their customers high-quality and high-performing services.APAC is the fastest-growing market in the global communication sector is the driving factor this market.
              • and China accounts for the largest market share globally is the driving factor this market.
              • as well as in APAC. The growth in Internet traffic in APAC is attributed to the increase in the sales of smartphones is the driving factor this market.
              • coupled with the rise in the number of mobile Internet subscribers in the region. This factor is expected to create demand for capacity expansion and faster Internet (4G) networks. These factors are expected to create demand in the communication modular instruments market in APAC during the forecast period. is the driving factor this market.

              The Modular Instruments market vendors should focus on grabbing business opportunities from the Semiconductor and electronics segment as it accounted for the largest market share in the base year.