
US Moving Services Market Size 2026-2030
The us moving services market size is valued to increase by USD 4.78 billion, at a CAGR of 4% from 2025 to 2030. Resurgence of residential real estate mobility and demographic shifts will drive the us moving services market.
Major Market Trends & Insights
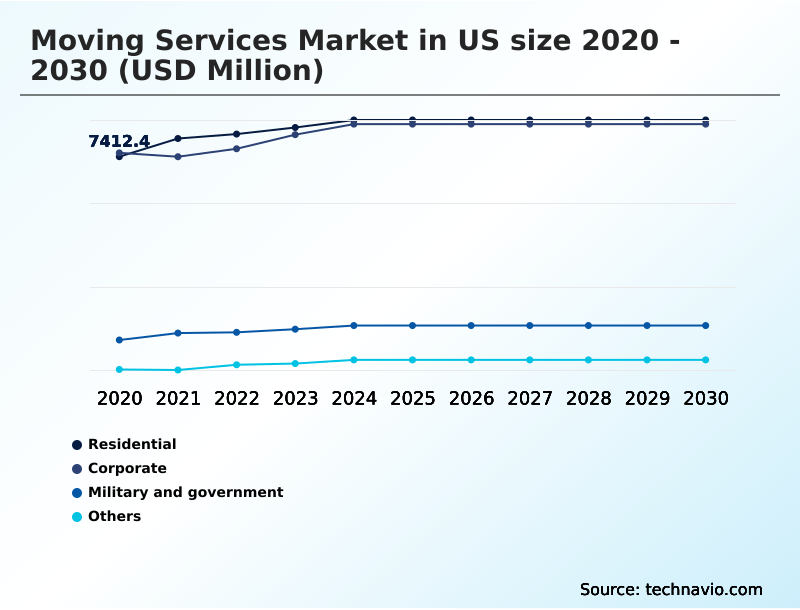
- By End-user - Residential segment was valued at USD 8.43 billion in 2024
- By Type - Full-service moving segment accounted for the largest market revenue share in 2024
Market Size & Forecast
- Market Opportunities: USD 8.08 billion
- Market Future Opportunities: USD 4.78 billion
- CAGR from 2025 to 2030 : 4%
Market Summary
- The moving services market in us is undergoing a significant transformation, shifting from a traditionally labor-intensive industry to a technology-driven sector. This evolution is propelled by changing consumer expectations for transparency and efficiency, alongside the lasting impacts of hybrid work models on relocation patterns. The demand for flexible solutions, ranging from full-service moving to partial-service moving, has intensified.
- For instance, a mid-sized corporation planning a commercial office relocation now leverages move management software to coordinate logistics, track assets via real-time shipment tracking, and ensure minimal operational downtime. This scenario highlights the industry's pivot toward digital integration, where route optimization software and automated scheduling systems are becoming standard.
- While corporate relocation provides stable revenue, the high-volume residential sector remains competitive, pushing firms to adopt technologies like virtual surveying and digital inventory management to improve quoting accuracy and customer satisfaction. The necessity of navigating complex logistics solutions while managing costs defines the current operational landscape.
What will be the Size of the US Moving Services Market during the forecast period?

Get Key Insights on Market Forecast (PDF) Get Free Sample
How is the US Moving Services Market Segmented?
The us moving services industry research report provides comprehensive data (region-wise segment analysis), with forecasts and estimates in "USD million" for the period 2026-2030, as well as historical data from 2020-2024 for the following segments.
- End-user
- Residential
- Corporate
- Military and government
- Others
- Type
- Full-service moving
- Partial-service moving
- Mode of booking
- Offline
- Online
- Area
- Local
- Long distance
- International
- Geography
- North America
- US
- North America
By End-user Insights
The residential segment is estimated to witness significant growth during the forecast period.
The residential segment, a cornerstone of the moving services market in us, is driven by life-stage transitions and real estate dynamics. This category encompasses everything from a simple local move to a complex residential relocation across state lines.
Demand is often met through full-service moving packages that include professional packing services, although a growing number of consumers opt for a do-it-yourself (DIY) moving approach using portable storage containers.
Companies in this space are differentiated by their digital inventory management capabilities and adherence to federal motor carrier safety administration (FMCSA) regulations.
Success hinges on managing the high price sensitivity of customers, who now use online tools for service comparisons, pushing providers to improve operational efficiency, which has been seen to enhance scheduling accuracy by up to 15%.
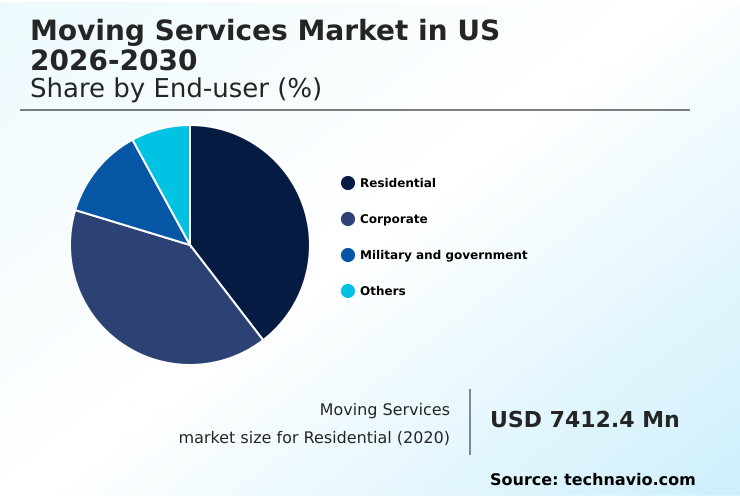
The Residential segment was valued at USD 8.43 billion in 2024 and showed a gradual increase during the forecast period.
Market Dynamics
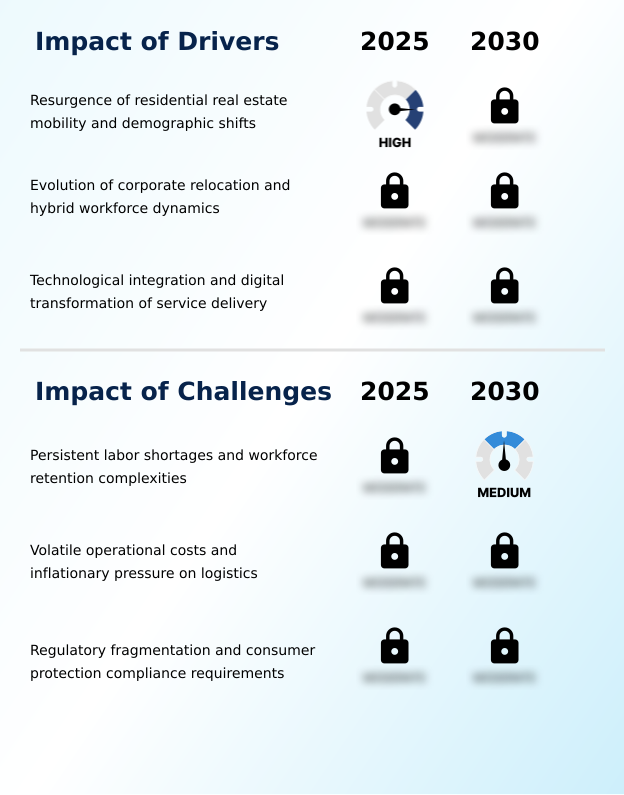
Our researchers analyzed the data with 2025 as the base year, along with the key drivers, trends, and challenges. A holistic analysis of drivers will help companies refine their marketing strategies to gain a competitive advantage.
- Strategic planning in the moving services market in us is increasingly data-driven, focusing on optimizing every facet of operations. A key discussion revolves around the cost comparison of full-service vs. partial-service moving, as companies aim to capture a wider customer base with modular offerings.
- Internally, the benefits of virtual surveying for moving estimates are undeniable, reducing sales-related travel costs and accelerating the quoting process. Forward-thinking firms are integrating saas solutions for moving company operations to unify customer relationship management, scheduling, and dispatch. This digital transformation is vital for managing the persistent impact of driver shortages on long-distance moving.
- Concurrently, there is a strong push toward adopting sustainable packing materials for residential moves. Operationally, the focus is on technology for optimizing commercial office relocations to minimize business disruption for clients. Firms are also navigating complex liability coverage requirements for interstate movers to ensure compliance.
- For high-value segments, managing employee relocation with mobility providers and implementing senior downsizing and relocation service best practices are becoming key differentiators. These initiatives are being undertaken while also addressing the unique challenges of military pcs moves for families, which require specialized handling and adherence to strict timelines.
What are the key market drivers leading to the rise in the adoption of US Moving Services Industry?
- A resurgence of residential real estate mobility, coupled with significant demographic shifts, serves as a key driver for market growth.
- Technological integration remains a primary driver, fundamentally altering service delivery and customer interaction. The adoption of artificial intelligence for logistics planning is enabling companies to enhance efficiency, with optimized routing reducing fuel consumption by an average of 15%.
- Digital platforms for virtual surveying have accelerated the sales cycle, cutting the time to generate a quote by up to 40%.
- The proliferation of SaaS solutions is democratizing access to advanced tools like automated lead generation and customer relationship management, allowing smaller enterprises to compete more effectively with national brands.
- Real-time GPS tracking has become a standard expectation, providing transparency and improving the customer experience for both household goods moving and freight transportation services.
What are the market trends shaping the US Moving Services Industry?
- An accelerating adoption of sustainable operations and eco-conscious logistics is emerging as a significant trend. This shift is reshaping operational strategies and consumer expectations within the industry.
- The market is witnessing a significant trend toward hyper-specialization and sustainability, reshaping service offerings. The expansion of white-glove concierge services and high-value asset relocation is creating new, high-margin revenue streams that cater to discerning clients. This diversification helps companies differentiate in a crowded market.
- Simultaneously, the push for sustainable logistics is compelling operators to invest in fleet electrification and adopt circular economy programs, with some companies reporting a 25% reduction in landfill waste by using reusable packing crates. This focus on eco-friendly practices is increasingly a factor in procurement, especially for corporate clients.
- Furthermore, the integration of carbon offset programs offers a competitive edge, appealing to environmentally conscious consumers and businesses.
What challenges does the US Moving Services Industry face during its growth?
- Persistent labor shortages and complexities in workforce retention present a key challenge affecting industry growth.
- Operational viability in the market is significantly challenged by workforce dynamics and regulatory complexities. The persistent shortage of skilled labor, particularly drivers with commercial licenses, creates a bottleneck that limits growth and impacts service quality. This issue is compounded by the high costs of recruitment and training, which can compress profit margins by as much as 5%.
- Furthermore, navigating the fragmented regulatory landscape, which includes varying state-level tariff filing requirements and federal oversight, poses a substantial administrative burden. The prevalence of unauthorized operators who bypass these regulations creates unfair competition and erodes consumer trust, forcing legitimate businesses to invest heavily in compliance and differentiation strategies.
Exclusive Technavio Analysis on Customer Landscape
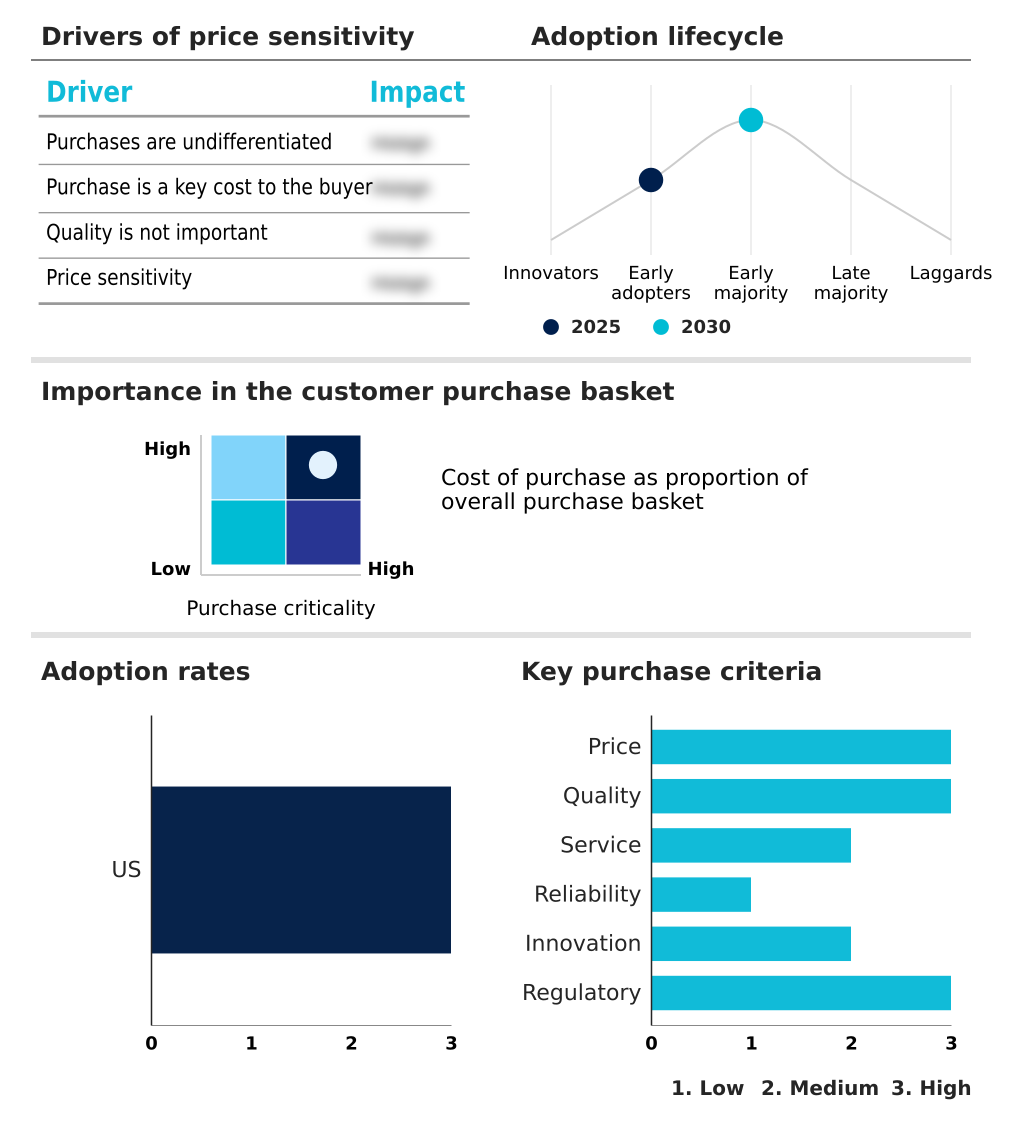
The us moving services market forecasting report includes the adoption lifecycle of the market, covering from the innovator’s stage to the laggard’s stage. It focuses on adoption rates in different regions based on penetration. Furthermore, the us moving services market report also includes key purchase criteria and drivers of price sensitivity to help companies evaluate and develop their market growth analysis strategies.
Customer Landscape of US Moving Services Industry
Competitive Landscape
Companies are implementing various strategies, such as strategic alliances, us moving services market forecast, partnerships, mergers and acquisitions, geographical expansion, and product/service launches, to enhance their presence in the industry.
Allied Van Lines Inc. - Offerings span a spectrum of relocation and logistics services, including full-service residential moves, complex corporate transfers, and specialized freight transportation to accommodate diverse client requirements.
The industry research and growth report includes detailed analyses of the competitive landscape of the market and information about key companies, including:
- Allied Van Lines Inc.
- Arpin Van Lines
- Atlas Van Lines
- Bekins Van Lines
- Budget Truck Rental
- Gentle Giant Moving Company
- HaulCo
- Mayflower Transit
- North American Van Lines
- Old Dominion Freight Line
- PACK RAT Portable Storage
- Penske Corp.
- SIRVA Worldwide Inc.
- Two Men and a Truck
- United Van Lines
- UPack
- Wheaton World Wide Moving
- XPO Inc.
Qualitative and quantitative analysis of companies has been conducted to help clients understand the wider business environment as well as the strengths and weaknesses of key industry players. Data is qualitatively analyzed to categorize companies as pure play, category-focused, industry-focused, and diversified; it is quantitatively analyzed to categorize companies as dominant, leading, strong, tentative, and weak.
Recent Development and News in Us moving services market
- In September 2024, the Federal Motor Carrier Safety Administration (FMCSA) announced an overhaul of the industry's identification framework, positioning the USDOT number as the sole federal identifier to streamline regulatory compliance and combat fraud.
- In November 2024, leading national moving companies established sustainability partnerships with recycling organizations, launching nationwide take-back programs for unwanted goods and packing materials to promote circular economy principles.
- In January 2025, Allied Van Lines Inc. completed a strategic acquisition of a prominent regional moving entity in the Southeast, expanding its operational footprint and increasing its fleet capacity in the region.
- In April 2025, UPack and Penske Corp. both launched advanced comparative pricing tools and flexible equipment options, targeting the growing demand for affordable cross-country relocations for smaller households.
Dive into Technavio’s robust research methodology, blending expert interviews, extensive data synthesis, and validated models for unparalleled US Moving Services Market insights. See full methodology.
| Market Scope | |
|---|---|
| Page number | 194 |
| Base year | 2025 |
| Historic period | 2020-2024 |
| Forecast period | 2026-2030 |
| Growth momentum & CAGR | Accelerate at a CAGR of 4% |
| Market growth 2026-2030 | USD 4782.2 million |
| Market structure | Fragmented |
| YoY growth 2025-2026(%) | 3.9% |
| Key countries | US |
| Competitive landscape | Leading Companies, Market Positioning of Companies, Competitive Strategies, and Industry Risks |
Research Analyst Overview
- The moving services market in us is undergoing a foundational shift, driven by technological integration and evolving logistical demands. Core operations, once manually intensive, are now being streamlined through the adoption of move management software and automated scheduling systems.
- The competitive landscape compels providers to offer a diverse portfolio, from residential relocation and corporate relocation to specialized less-than-truckload (LTL) services and last mile delivery. Success is increasingly tied to the effective use of route optimization software and real-time shipment tracking, which enhance transparency and efficiency. Firms are also investing in climate-controlled transportation and custom crating solutions to capture high-value segments.
- The entire service lifecycle, from virtual surveying and digital inventory management to professional packing services and claims management solutions, is being digitized. This transition toward sophisticated logistics solutions is critical for navigating the complexities of long-distance moving, international relocation, and commercial office relocation, forcing even traditional players to innovate.
What are the Key Data Covered in this US Moving Services Market Research and Growth Report?
-
What is the expected growth of the US Moving Services Market between 2026 and 2030?
-
USD 4.78 billion, at a CAGR of 4%
-
-
What segmentation does the market report cover?
-
The report is segmented by End-user (Residential, Corporate, Military and government, and Others), Type (Full-service moving, and Partial-service moving), Mode of Booking (Offline, and Online), Area (Local, Long distance, and International) and Geography (North America)
-
-
Which regions are analyzed in the report?
-
North America
-
-
What are the key growth drivers and market challenges?
-
Resurgence of residential real estate mobility and demographic shifts, Persistent labor shortages and workforce retention complexities
-
-
Who are the major players in the US Moving Services Market?
-
Allied Van Lines Inc., Arpin Van Lines, Atlas Van Lines, Bekins Van Lines, Budget Truck Rental, Gentle Giant Moving Company, HaulCo, Mayflower Transit, North American Van Lines, Old Dominion Freight Line, PACK RAT Portable Storage, Penske Corp., SIRVA Worldwide Inc., Two Men and a Truck, United Van Lines, UPack, Wheaton World Wide Moving and XPO Inc.
-
Market Research Insights
- Market dynamics are increasingly shaped by the pursuit of operational efficiency and customer-centric service delivery. The adoption of advanced technology is no longer optional; for example, firms utilizing route optimization software have reported up to a 12% reduction in fuel costs. Concurrently, the use of automated scheduling systems has improved on-time performance by over 20% for leading providers.
- These data points underscore a competitive environment where investment in technology, such as claims management solutions and digital inventory management, directly translates into market advantage and improved profit margins. As a result, the ability to integrate these systems effectively is becoming a primary differentiator among service providers.
We can help! Our analysts can customize this us moving services market research report to meet your requirements.
 RIA -
RIA - 
