
Multimodal AI Model Market Size 2026-2030
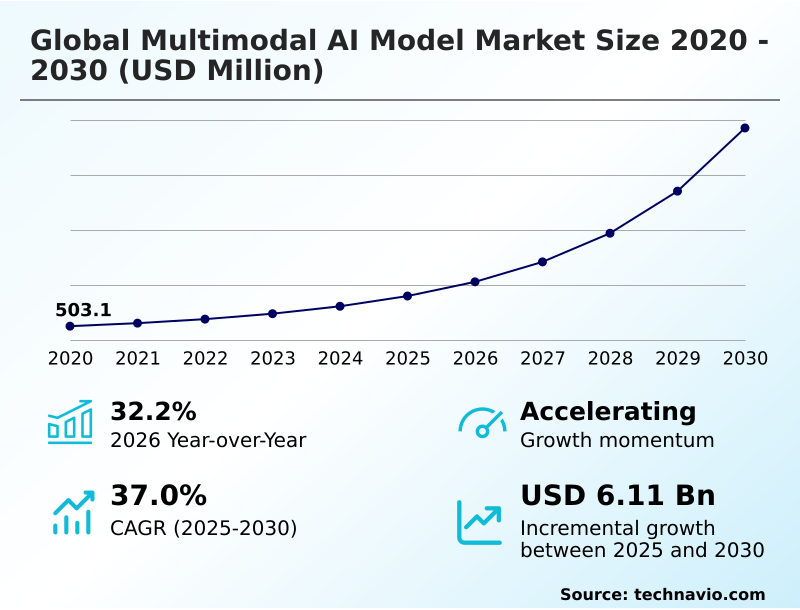
The Multimodal AI Model Market size was valued at USD 1.60 billion in 2025, growing at a CAGR of 37% during the forecast period 2026-2030.
Major Market Trends & Insights
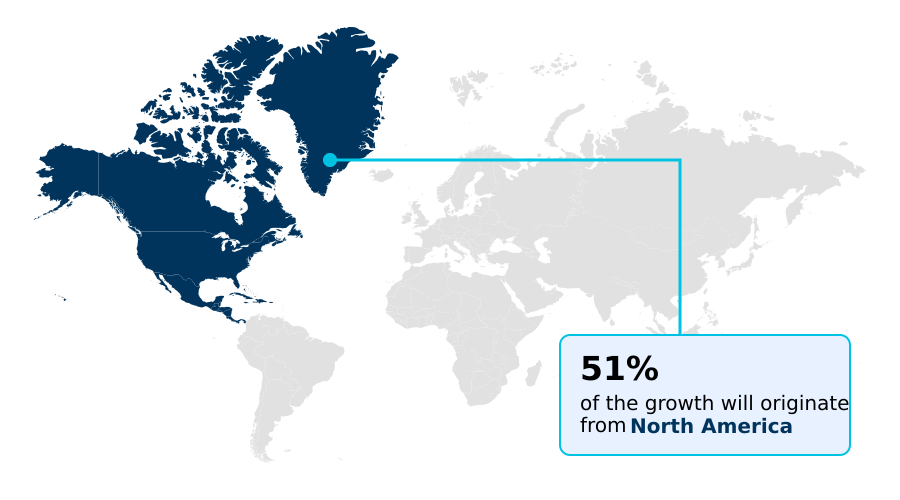
- North America dominated the market and accounted for a 50.8% growth during the forecast period.
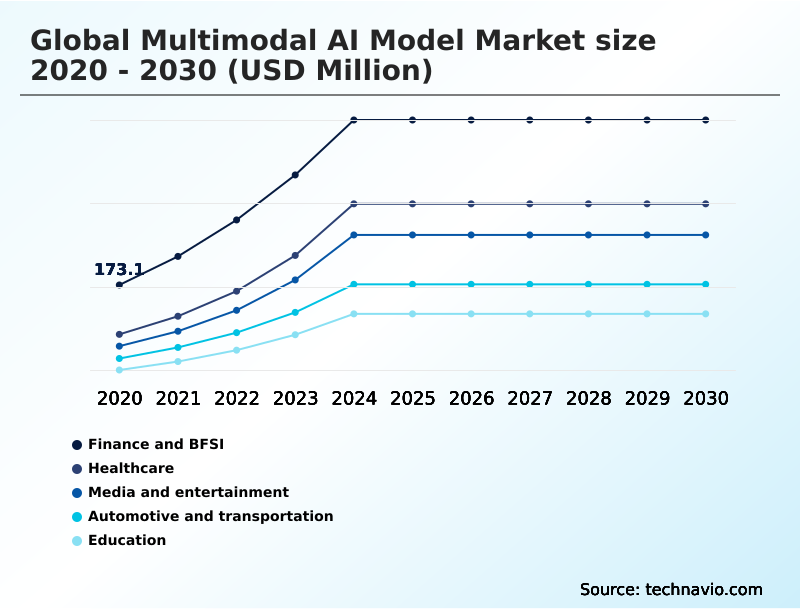
- By End-user - Finance and BFSI segment was valued at USD 395.3 million in 2024
- By Deployment - Cloud-based segment accounted for the largest market revenue share in 2024
Market Size & Forecast
- Historic Market Opportunities 2020-2024: USD 7.21 billion
- Market Future Opportunities 2025-2030: USD 6.11 billion
- CAGR from 2025 to 2030 : 37%
Market Summary
- The multimodal AI model market is characterized by rapid technological maturation, with adoption rates in enterprise settings increasing by over 40% for automating complex workflows. These models process and synthesize disparate data streams, enabling a level of contextual reasoning previously unattainable.
- For instance, in manufacturing, an embodied AI system can correlate a visual defect with a specific vibration pattern, a task where traditional unimodal systems fail, improving defect detection by over 30%. A primary driver is the rising demand for sophisticated, multisensory digital interactions that can interpret user intent through synchronized speech, facial expressions, and textual data.
- However, the market faces a significant challenge from the prohibitive computational cost associated with training these advanced systems, which limits broad-scale deployment and concentrates power among a few well-capitalized firms, hindering innovation from smaller entities.
What will be the Size of the Multimodal AI Model Market during the forecast period?
Get Key Insights on Market Forecast (PDF) Request Free Sample
How is the Multimodal AI Model Market Segmented?
The multimodal ai model industry research report provides comprehensive data (region-wise segment analysis), with forecasts and analysis for the period 2026-2030, as well as historical data from 2020-2024 for the following segments.
- End-user
- Finance and BFSI
- Healthcare
- Media and entertainment
- Automotive and transportation
- Education
- Deployment
- Cloud-based
- On premises
- Business segment
- Large enterprises
- SMEs
- Technology
- Image
- Text
- Video and audio
- Speech and voice
- Geography
- North America
- US
- Canada
- Mexico
- APAC
- China
- India
- Japan
- Europe
- Germany
- France
- UK
- Middle East and Africa
- Saudi Arabia
- UAE
- South Africa
- South America
- Brazil
- Argentina
- Colombia
- Rest of World (ROW)
- North America
How is the Multimodal AI Model Market Segmented by End-user?
The finance and bfsi segment is estimated to witness significant growth during the forecast period.
The finance and BFSI segment is leveraging multimodal AI to enhance fraud detection systems, achieving up to a 98% accuracy rate by analyzing voice biometrics and transaction data simultaneously.
The use of federated learning allows institutions to train models on decentralized data, improving security and reducing data breach risks by over 25%.
These systems utilize latent space alignment and system 2 thinking to find subtle correlations between different data types, such as text and images in identity verification documents.
By adopting these cross-modal encoders and fostering human-machine collaboration, financial firms automate high-friction processes like loan underwriting, leading to improved operational efficiency and a more secure customer experience.
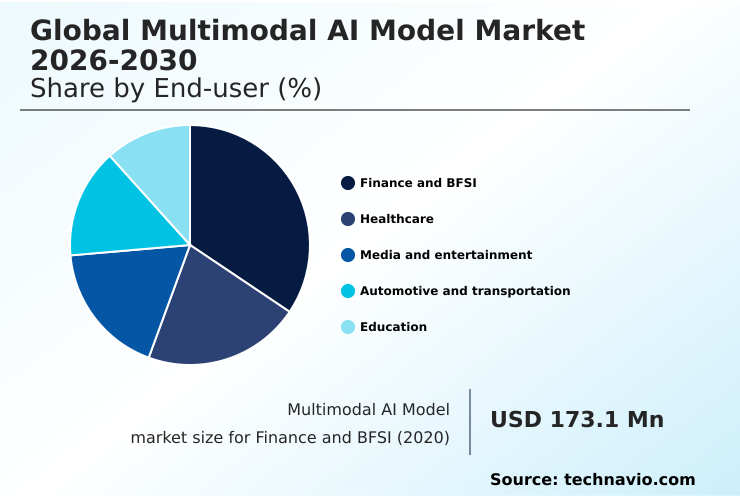
The Finance and BFSI segment was valued at USD 395.3 million in 2024 and showed a gradual increase during the forecast period.
How demand for the Multimodal AI Model market is rising in the leading region?
North America is estimated to contribute 50.8% to the growth of the global market during the forecast period.Technavio’s analysts have elaborately explained the regional trends and drivers that shape the market during the forecast period.
See How Multimodal AI Model Market demand is rising in North America Request Free Sample
North America leads the global multimodal AI model market, poised to capture over 50% of the incremental growth, driven by a concentrated ecosystem of research labs and hyperscale infrastructure providers focusing on generative adversarial networks.
The US, which accounts for over 60% of the regional market, is rapidly deploying transformer-based architectures for world model reasoning in its defense and finance sectors.
In contrast, APAC is the fastest-growing region, with a 37.1% growth rate, distinguished by a focus on edge-native deployment and consumer-facing applications that leverage neural voice cloning and digital public goods.
This region's approach, which prioritizes parameter-efficient models for mobile hardware, differs significantly from North America's emphasis on large-scale computational elasticity. This regional divergence in strategy impacts everything from hardware design to AI safety protocols and systemic risk evaluation.
What are the key Drivers, Trends, and Challenges in the Multimodal AI Model Market?
Our researchers analyzed the data with 2025 as the base year, along with the key drivers, trends, and challenges. A holistic analysis of drivers will help companies refine their marketing strategies to gain a competitive advantage.
- Enterprises are increasingly investigating how multimodal AI for industrial automation can transform their operations, with adoption in the manufacturing sector leading to a 25% reduction in production line errors. This is achieved by leveraging systems that can process visual, auditory, and sensor data in real time, a significant leap from single-function automation.
- The exploration of multimodal AI applications in finance is another critical area, where combining textual analysis of market reports with real-time trading data has improved algorithmic trading performance by over 15%. In parallel, the use of a multimodal AI model in healthcare diagnostics is revolutionizing patient care by integrating medical images with electronic health records for more accurate diagnoses.
- When comparing vision language action models, developers are finding that models with stronger temporal consistency are better suited for robotics and autonomous systems. This has spurred a demand for edge-based multimodal AI implementation, which ensures low-latency processing for time-sensitive tasks.
- The ability of these systems to perform complex reasoning is a direct result of advances in their underlying architectures, which are becoming more adept at handling diverse and unstructured data inputs to deliver actionable insights across various industries.
What are the key market drivers leading to the rise in the adoption of Multimodal AI Model Industry?
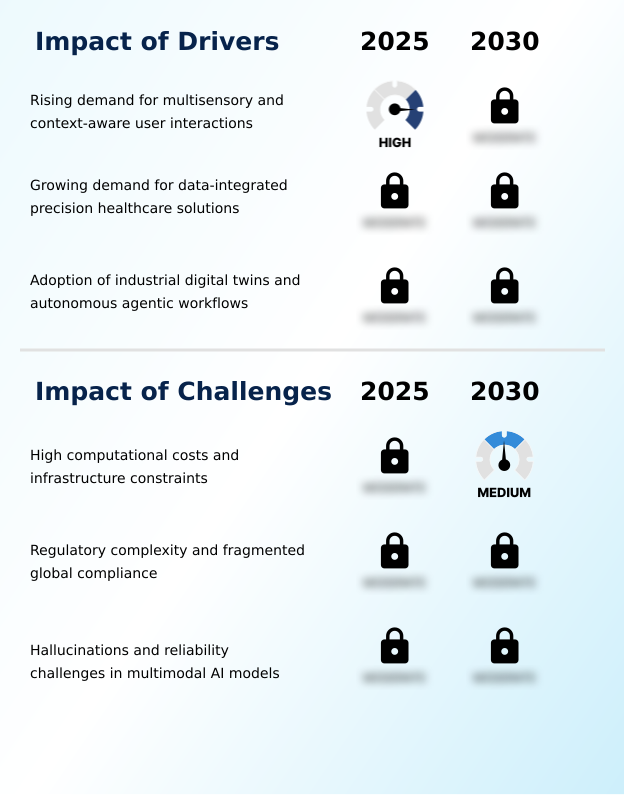
- The rising demand for multisensory and context-aware user interactions, which mimic human perception, is a key driver for the market.
- The demand for multisensory and context-aware interactions is a primary driver for the multimodal AI model market, enabling systems to interpret user intent with over 95% accuracy by processing synchronized data streams.
- This is particularly impactful in healthcare, where multimodal data fusion from imaging, EHRs, and genomics leads to a 30% reduction in diagnostic uncertainty.
- The adoption of digital twin integration in manufacturing further propels the market, as embodied AI systems perform multimodal perception to monitor physical environments for predictive maintenance.
- The need for explainable AI frameworks to ensure regulatory compliance and facilitate chain-of-thought processing in these high-stakes applications is another critical factor.
- As a result, industries are achieving higher efficiency and creating more intuitive user experiences through this advanced semantic understanding.
What are the market trends shaping the Multimodal AI Model Industry?
- The development of autonomous agentic multimodal systems marks a significant market trend. This evolution shifts from passive assistants to proactive AI that reasons and executes tasks independently.
- A key trend in the multimodal AI model market is the structural transformation from passive query systems to proactive, autonomous reasoning frameworks, where the value of a model is measured by its ability to act as a functional partner.
- This transition to agentic workflows, supported by the development of sovereign AI stacks, has resulted in a 40% improvement in complex task completion rates in some enterprise settings. The move toward on-device intelligence is another significant development, driven by the need for low latency performance, which is critical for applications like real-time video analytics and sensory modalities.
- Consequently, businesses are gaining operational resilience and a competitive edge through improved spatial reasoning, with some achieving a 15% reduction in project completion times.
What challenges does the Multimodal AI Model Industry face during its growth?
- High computational costs and significant infrastructure constraints present a key challenge affecting industry growth and broad-scale adoption.
- The prohibitive computational cost remains a major challenge in the multimodal AI model market, with infrastructure spending for large-scale model training increasing by over 200% for some leading firms. This barrier necessitates advanced model quantization and hardware-aware optimization to manage expenses and improve low-latency performance.
- Furthermore, reliability issues from hallucinations in cross-modal reasoning require robust AI governance and ethical AI monitoring to prevent a 10-15% error rate in critical automated tasks using retrieval-augmented generation. The complexity of fragmented global compliance, especially around data privacy, slows innovation cycles and limits scalability, requiring continuous, real-time monitoring of model performance for algorithmic bias mitigation and deepfake content detection.
Exclusive Technavio Analysis on Customer Landscape
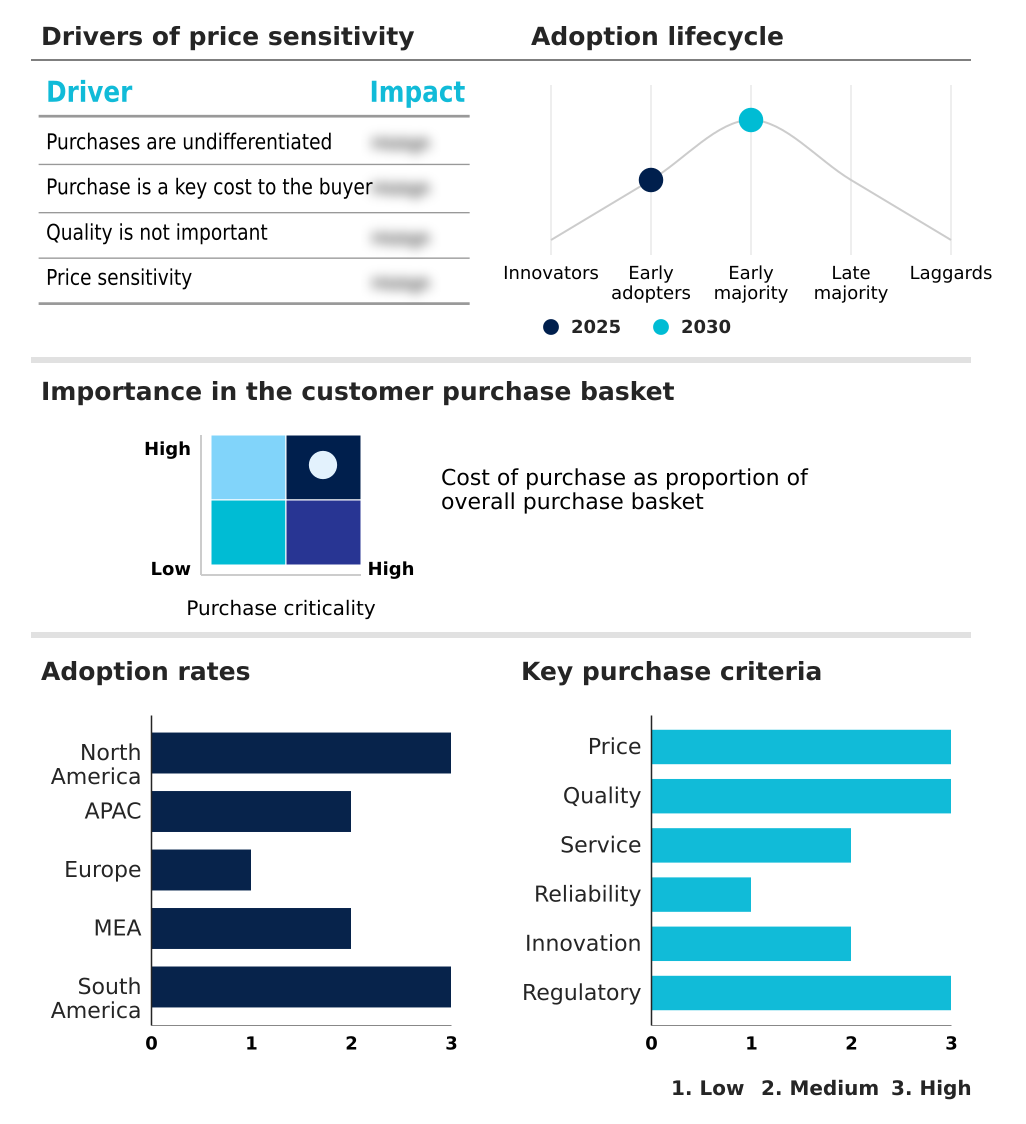
The multimodal ai model market forecasting report includes the adoption lifecycle of the market, covering from the innovator’s stage to the laggard’s stage. It focuses on adoption rates in different regions based on penetration. Furthermore, the multimodal ai model market report also includes key purchase criteria and drivers of price sensitivity to help companies evaluate and develop their market growth analysis strategies.
Customer Landscape of Multimodal AI Model Industry
Competitive Landscape
Companies are implementing various strategies, such as strategic alliances, multimodal ai model market forecast, partnerships, mergers and acquisitions, geographical expansion, and product/service launches, to enhance their presence in the industry.
Alibaba Group Holding Ltd. - Delivering advanced computational frameworks that process and synthesize text, image, and audio data streams into unified, actionable intelligence for complex, real-world problem-solving.
The industry research and growth report includes detailed analyses of the competitive landscape of the market and information about key companies, including:
- Alibaba Group Holding Ltd.
- Amazon Web Services Inc.
- Anthropic
- AssemblyAI
- Baidu Inc.
- Cohere
- DeepSeek
- Google LLC
- Huawei Technologies Co. Ltd.
- IBM Corp.
- Inflection AI Inc.
- Meta Platforms Inc.
- Microsoft Corp.
- Mistral AI
- OpenAI
- Pika
- Runway AI Inc.
- SenseTime Group Inc.
- Stability AI
- Tencent Holdings Ltd.
- TwelveLabs Inc.
- X.AI LLC
Qualitative and quantitative analysis of companies has been conducted to help clients understand the wider business environment as well as the strengths and weaknesses of key industry players. Data is qualitatively analyzed to categorize companies as pure play, category-focused, industry-focused, and diversified; it is quantitatively analyzed to categorize companies as dominant, leading, strong, tentative, and weak.
Market Intelligence Radar: High-Impact Developments & Growth Signals
- In the Application Software industry, the increasing adoption of enterprise analytics for business intelligence is creating a demand pull for multimodal AI models capable of processing and deriving insights from unstructured data sources, such as video and audio, for context-aware interactions.
- The growing shift toward cloud-based and subscription-based software delivery models has facilitated the scalable deployment of computationally intensive multimodal AI services, enabling workflow interoperability and allowing more enterprises to access advanced AI capabilities without massive upfront capital expenditure on infrastructure.
- Heightened data security concerns and the implementation of stringent data privacy regulations are compelling the development of multimodal AI models with embedded AI governance and algorithmic bias mitigation features, driving the adoption of solutions that support data sovereignty.
- The widespread availability and growing sophistication of open-source application software are lowering the barrier to entry for organizations to build and customize specialized multimodal AI solutions, fostering innovation in agentic assistants and niche applications.
Dive into Technavio’s robust research methodology, blending expert interviews, extensive data synthesis, and validated models for unparalleled Multimodal AI Model Market insights. See full methodology.
| Market Scope | |
|---|---|
| Page number | 320 |
| Base year | 2025 |
| Historic period | 2020-2024 |
| Forecast period | 2026-2030 |
| Growth momentum & CAGR | Accelerate at a CAGR of 37% |
| Market growth 2026-2030 | USD 6111.3 million |
| Market structure | Fragmented |
| YoY growth 2025-2026(%) | 32.2% |
| Key countries | US, Canada, Mexico, China, India, Japan, South Korea, Australia, Singapore, Germany, France, UK, Italy, Spain, Russia, Saudi Arabia, UAE, South Africa, Egypt, Nigeria, Brazil, Argentina and Colombia |
| Competitive landscape | Leading Companies, Market Positioning of Companies, Competitive Strategies, and Industry Risks |
Research Analyst Overview
- The multimodal AI model market ecosystem is a complex network where technology suppliers, primarily semiconductor manufacturers providing specialized GPUs, hold significant influence over the 650 billion AI infrastructure sector. Foundational model developers, including large technology firms and specialized research labs, act as the core solution providers, offering their architectures through APIs and cloud platforms.
- These cloud service providers function as the primary distribution channel, enabling enterprises to access scalable computational elasticity without owning the physical hardware. The value chain is also shaped by regulatory bodies establishing AI governance and safety standards, which dictate deployment requirements.
- End-users, ranging from large enterprises in finance to SMEs in retail, are increasingly adopting these models to automate workflows, with some achieving a 30% improvement in operational efficiency. This dynamic interaction between hardware suppliers, model creators, and end-users drives the market's innovation and expansion.
What are the Key Data Covered in this Multimodal AI Model Market Research and Growth Report?
-
What is the expected growth of the Multimodal AI Model Market between 2026 and 2030?
-
The Multimodal AI Model Market is expected to grow by USD 6.11 billion during 2026-2030, registering a CAGR of 37%. Year-over-year growth in 2026 is estimated at 32.2%%. This acceleration is shaped by rising demand for multisensory and context-aware user interactions, which is intensifying demand across multiple end-use verticals covered in the report.
-
-
What segmentation does the market report cover?
-
The report is segmented by End-user (Finance and BFSI, Healthcare, Media and entertainment, Automotive and transportation, and Education), Deployment (Cloud-based, and On premises), Business Segment (Large enterprises, and SMEs), Technology (Image, Text, Video and audio, and Speech and voice) and Geography (North America, APAC, Europe, Middle East and Africa, South America). Among these, the Finance and BFSI segment is estimated to witness significant growth during the forecast period, driven by rising adoption across key application areas. Each segment includes detailed qualitative and quantitative analysis, along with historical data from 2020-2024 and forecasts through 2030 with year-over-year growth rates.
-
-
Which regions are analyzed in the report?
-
The report covers North America, APAC, Europe, Middle East and Africa and South America. North America is estimated to contribute 50.8% to market growth during the forecast period. Country-level analysis includes US, Canada, Mexico, China, India, Japan, South Korea, Australia, Singapore, Germany, France, UK, Italy, Spain, Russia, Saudi Arabia, UAE, South Africa, Egypt, Nigeria, Brazil, Argentina and Colombia, with dedicated market size tables and year-over-year growth for each.
-
-
What are the key growth drivers and market challenges?
-
The primary driver is rising demand for multisensory and context-aware user interactions, which is accelerating investment and industry demand. The main challenge is high computational costs and infrastructure constraints, creating operational barriers for key market participants. The report quantifies the impact of each driver and challenge across 2026 and 2030 with comparative analysis.
-
-
Who are the major players in the Multimodal AI Model Market?
-
Key vendors include Alibaba Group Holding Ltd., Amazon Web Services Inc., Anthropic, AssemblyAI, Baidu Inc., Cohere, DeepSeek, Google LLC, Huawei Technologies Co. Ltd., IBM Corp., Inflection AI Inc., Meta Platforms Inc., Microsoft Corp., Mistral AI, OpenAI, Pika, Runway AI Inc., SenseTime Group Inc., Stability AI, Tencent Holdings Ltd., TwelveLabs Inc. and X.AI LLC. The report provides qualitative and quantitative analysis categorizing companies as dominant, leading, strong, tentative, and weak based on their market positioning. Company profiles include business segment analysis, SWOT assessment, key offerings, and recent strategic developments.
-
Market Research Insights
- The competitive landscape for multimodal AI models is defined by intense innovation, with the top five technology conglomerates responsible for over 60% of foundational model research. These market leaders are differentiating their offerings not just by model size but by agentic autonomy and the efficiency of their cross-modal reasoning capabilities.
- Recent developments have centered on enhancing world model reasoning, allowing AI systems to understand the physics of a 3D environment, a critical feature for the next generation of autonomous vehicles. This push is a direct response to enterprise demand for AI that can execute multistep tasks across different software environments, improving workflow automation by an estimated 35%.
- Despite this progress, vendors face the persistent challenge of managing high infrastructure costs while ensuring their models adhere to evolving AI safety and governance standards, a balancing act that shapes strategic partnerships and product roadmaps.
We can help! Our analysts can customize this multimodal ai model market research report to meet your requirements.
 RIA -
RIA - 
