NATO Ammunition Market Analysis, Size, and Forecast 2026-2030: North America (US, Canada, and Mexico), Europe (UK, Germany, and France), APAC (South Korea, Japan, and India), Middle East and Africa (Turkey, Saudi Arabia, and UAE), South America (Brazil and Colombia), and Rest of World (ROW)

NATO Ammunition Market Analysis, Size, and Forecast 2026-2030:
North America (US, Canada, and Mexico), Europe (UK, Germany, and France), APAC (South Korea, Japan, and India), Middle East and Africa (Turkey, Saudi Arabia, and UAE), South America (Brazil and Colombia), and Rest of World (ROW)

Published: Jan 2026 285 Pages SKU: IRTNTR72699

Market Overview at a Glance

$2.23 B
Market Opportunity
4.7%
CAGR 2025 - 2030
54%
North America Growth
$3.95 B
Small caliber segment 2024

NATO Ammunition Market Size 2026-2030

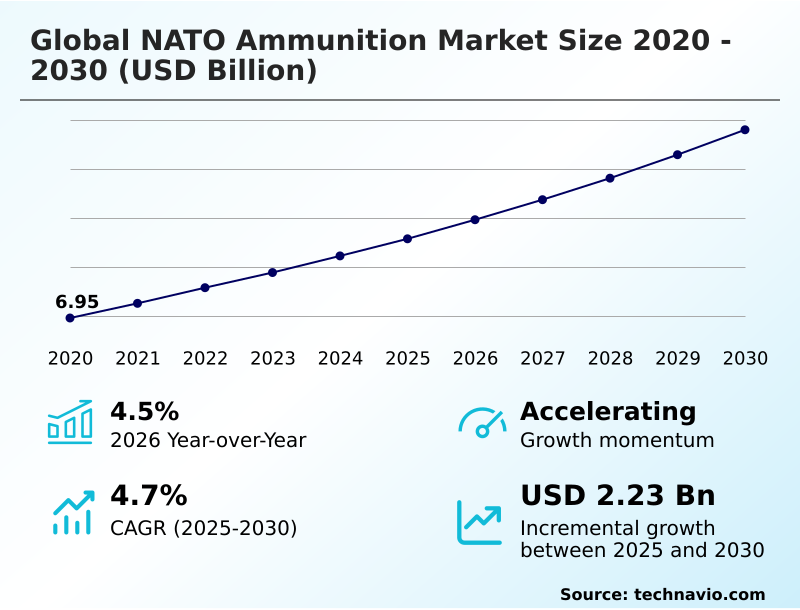
The nato ammunition market size is valued to increase by USD 2.23 billion, at a CAGR of 4.7% from 2025 to 2030. Increasing in defense spending globally will drive the nato ammunition market.

Major Market Trends & Insights

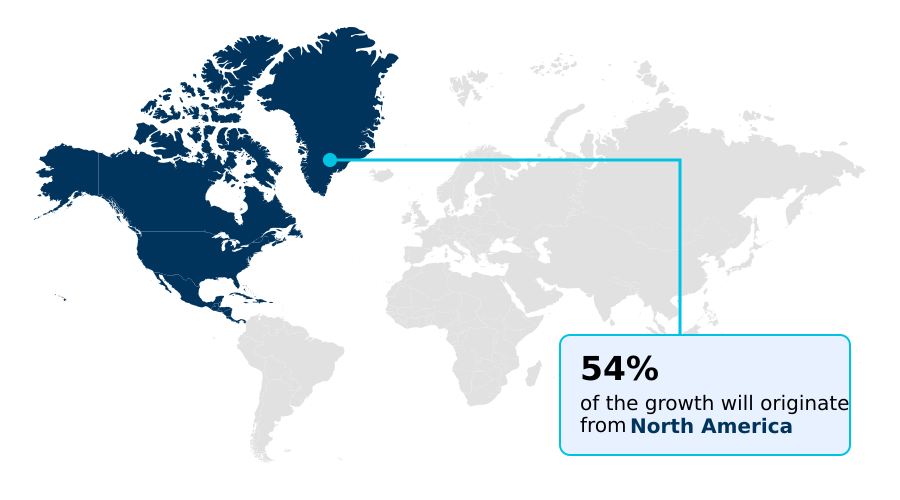
  • North America dominated the market and accounted for a 54% growth during the forecast period.
  • By Product - Small caliber segment was valued at USD 3.95 billion in 2024
  • By Type - Ground segment accounted for the largest market revenue share in 2024

Market Size & Forecast

  • Market Opportunities: USD 3.85 billion
  • Market Future Opportunities: USD 2.23 billion
  • CAGR from 2025 to 2030 : 4.7%

Market Summary

  • The NATO ammunition market is undergoing a significant transformation, driven by heightened geopolitical tensions and a renewed focus on industrial readiness. Nations are moving beyond simple procurement to actively fostering sovereign production capabilities and enhancing ammunition supply chain resilience.
  • This involves substantial investments in both expanding existing facilities and constructing new ones to ensure a steady supply of conventional munitions and advanced systems. Modernization efforts are a key aspect, with a clear shift towards developing and acquiring more effective ordnance.
  • The development of precision guided artillery shells, extended range projectiles, and specialized armor piercing projectiles reflects a strategic imperative to gain a qualitative advantage.
  • For defense planners, a key business challenge is balancing the urgent need for ammunition stockpile replenishment with long-term investments in next generation squad weapon ammunition technology, all while ensuring strict ITAR compliance and managing the complex logistics of critical raw material sourcing for materials like nitrocellulose.

What will be the Size of the NATO Ammunition Market during the forecast period?

Get Key Insights on Market Forecast (PDF) Request Free Sample

How is the NATO Ammunition Market Segmented?

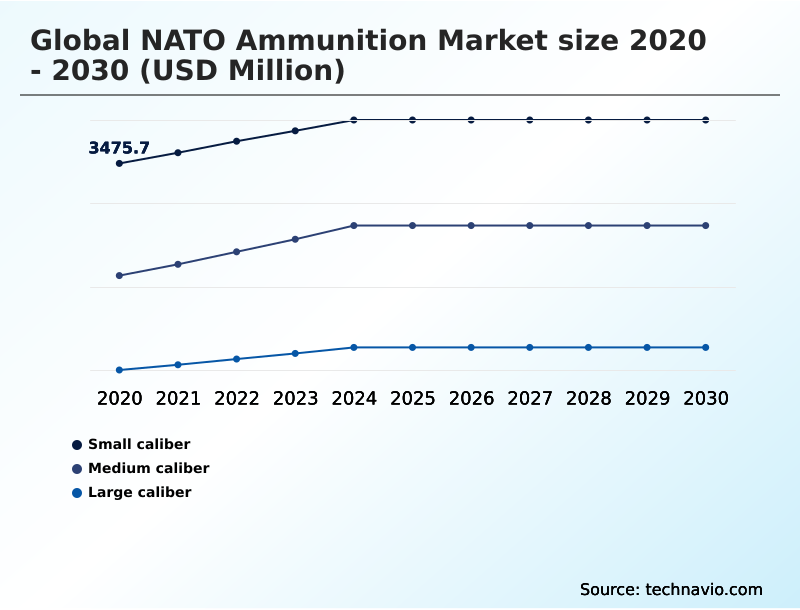
The nato ammunition industry research report provides comprehensive data (region-wise segment analysis), with forecasts and estimates in "USD million" for the period 2026-2030, as well as historical data from 2020-2024 for the following segments.

  • Product
    • Small caliber
    • Medium caliber
    • Large caliber
  • Type
    • Ground
    • Aerial
    • Naval
  • End-user
    • Military and defense forces
    • Homeland security
    • Others
  • Geography
    • North America
      • US
      • Canada
      • Mexico
    • Europe
      • UK
      • Germany
      • France
    • APAC
      • South Korea
      • Japan
      • India
    • Middle East and Africa
      • Turkey
      • Saudi Arabia
      • UAE
    • South America
      • Brazil
      • Colombia
    • Rest of World (ROW)

By Product Insights

The small caliber segment is estimated to witness significant growth during the forecast period.

The small caliber ammunition segment is shaped by high-volume consumption for training and operations, with a strong focus on STANAG compliance for interoperability.

Current military modernization programs are driving demand for advanced rounds, including the new hybrid cased ammunition for the next generation squad weapon.

These innovations aim to improve infantry operational stamina and battlefield logistics efficiency by significantly reducing combat load, with some lightweight designs achieving up to a 30% reduction in carried weight.

The segment's evolution is closely tied to ammunition stockpile replenishment strategies and the integration of advanced rounds with digital battle management systems, ensuring forces maintain a decisive edge.

Request Free Sample

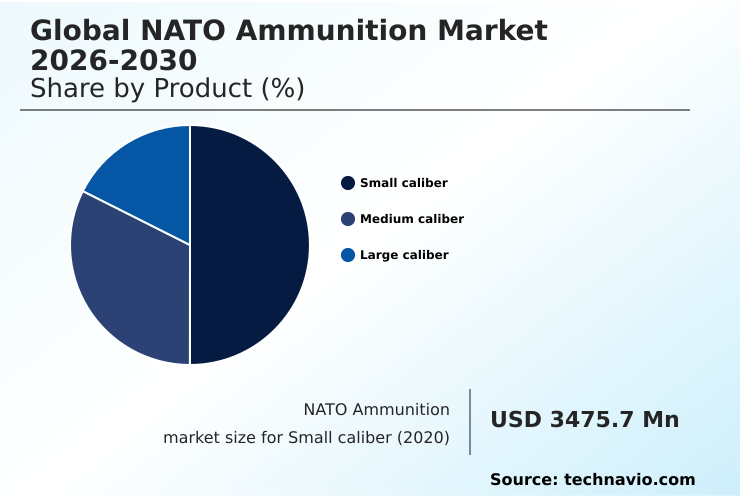
The Small caliber segment was valued at USD 3.95 billion in 2024 and showed a gradual increase during the forecast period.

Request Free Sample

Regional Analysis

North America is estimated to contribute 54% to the growth of the global market during the forecast period.Technavio’s analysts have elaborately explained the regional trends and drivers that shape the market during the forecast period.

See How NATO Ammunition Market Demand is Rising in North America Request Free Sample

The geographic landscape is dominated by North America, which commands over 50% of the market share, driven by large-scale modernization and ammunition stockpile replenishment programs.

However, Europe is exhibiting a higher growth rate of 5.2%, spurred by efforts to enhance sovereign production capability for high-intensity conflict readiness. This includes expanding facilities for medium caliber systems and precision guided artillery shells.

Across all regions, NATO ammunition interoperability is a critical requirement, influencing everything from C4ISR systems integration to foreign military sales.

This standardization ensures that allied forces can seamlessly support each other during joint tactical ISR missions and electronic warfare systems operations.

Market Dynamics

Our researchers analyzed the data with 2025 as the base year, along with the key drivers, trends, and challenges. A holistic analysis of drivers will help companies refine their marketing strategies to gain a competitive advantage.

  • The strategic focus across the industry is currently on improving 155mm artillery shell production to meet the demands of modern attrition-based warfare. This has highlighted significant challenges in the nitrocellulose supply chain, prompting a re-evaluation of sourcing and domestic manufacturing capabilities.
  • In parallel, there is a strong push toward technological advancement in smaller calibers, particularly concerning the standardization of 5.56x45mm rounds for greater interoperability. A key area of innovation is the next generation squad weapon ammunition technology, which explores novel materials and designs to enhance performance.
  • The impact of polymer casings on ammunition weight is a critical consideration in this field, as it directly influences soldier mobility and logistical footprints. Logistical analysis shows that adopting such lightweight designs can reduce transportation and handling costs by up to 15% for an equivalent number of rounds.
  • Furthermore, the cost-benefit of precision guided artillery shells continues to be a central topic for procurement decision-makers, who must balance the higher upfront expense against the significant increase in first-round accuracy and effectiveness.

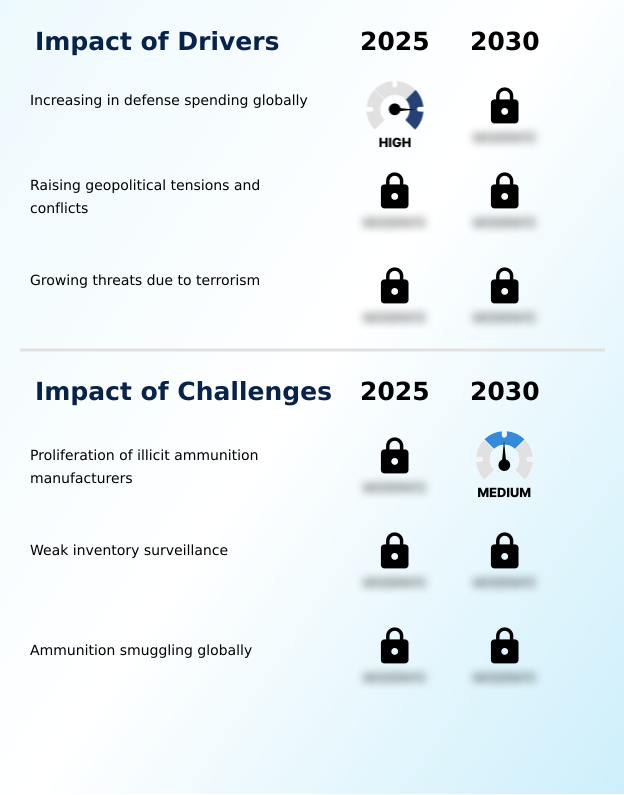
What are the key market drivers leading to the rise in the adoption of NATO Ammunition Industry?

  • The primary market driver is the significant global increase in defense spending among NATO member nations.

  • A primary driver for the market is a significant shift in national defense policies, leading to increased defense budget allocation for weapon systems modernization. Many nations have raised defense spending by over 18% to support collective defense strategies.
  • This funding directly fuels defense industrial base expansion, with munitions procurement strategies now prioritizing large caliber artillery.
  • There is an unprecedented focus on increasing the output of the 155mm artillery projectile, with some facilities aiming to raise production by 200% to meet new stockpile targets.
  • Similarly, investments are flowing into the manufacturing of rocket artillery components to bolster long-range strike capabilities.

What are the market trends shaping the NATO Ammunition Industry?

  • A prominent modernization trend centers on reducing ammunition weight. This strategic shift is driven by the operational need for improved soldier mobility and greater logistical efficiency.

  • Evolving geopolitical security imperatives are accelerating trends in the market, moving beyond conventional munitions. The focus is on adopting polymer casings and advanced composite materials through lightweight ammunition development, which can reduce a soldier's load by over 15% while contributing to combat readiness enhancement.
  • Another key trend involves developing extended range projectiles that can increase artillery reach by more than 25% without requiring new launch platforms. These advancements, however, introduce challenges in critical raw material sourcing for specialized components, compelling a re-evaluation of supply chain dependencies to sustain momentum.

What challenges does the NATO Ammunition Industry face during its growth?

  • The proliferation of illicit ammunition manufacturing and trafficking presents a significant challenge to market stability and global security.

  • A major market challenge is ensuring ammunition supply chain resilience against the threats of illicit ammunition trafficking and state-sponsored diversion. With over 80% of global ammunition trade remaining outside official data, arms embargo monitoring becomes exceedingly difficult. The scarcity of critical materials like nitrocellulose and gun cotton adds another layer of complexity.
  • Furthermore, stringent ITAR compliance and the high capital cost of certified explosive handling facilities create significant barriers. Poorly managed national stockpiles, accounting for an estimated 12% of weapons diversion, undermine security and highlight the urgent need for improved accountability.

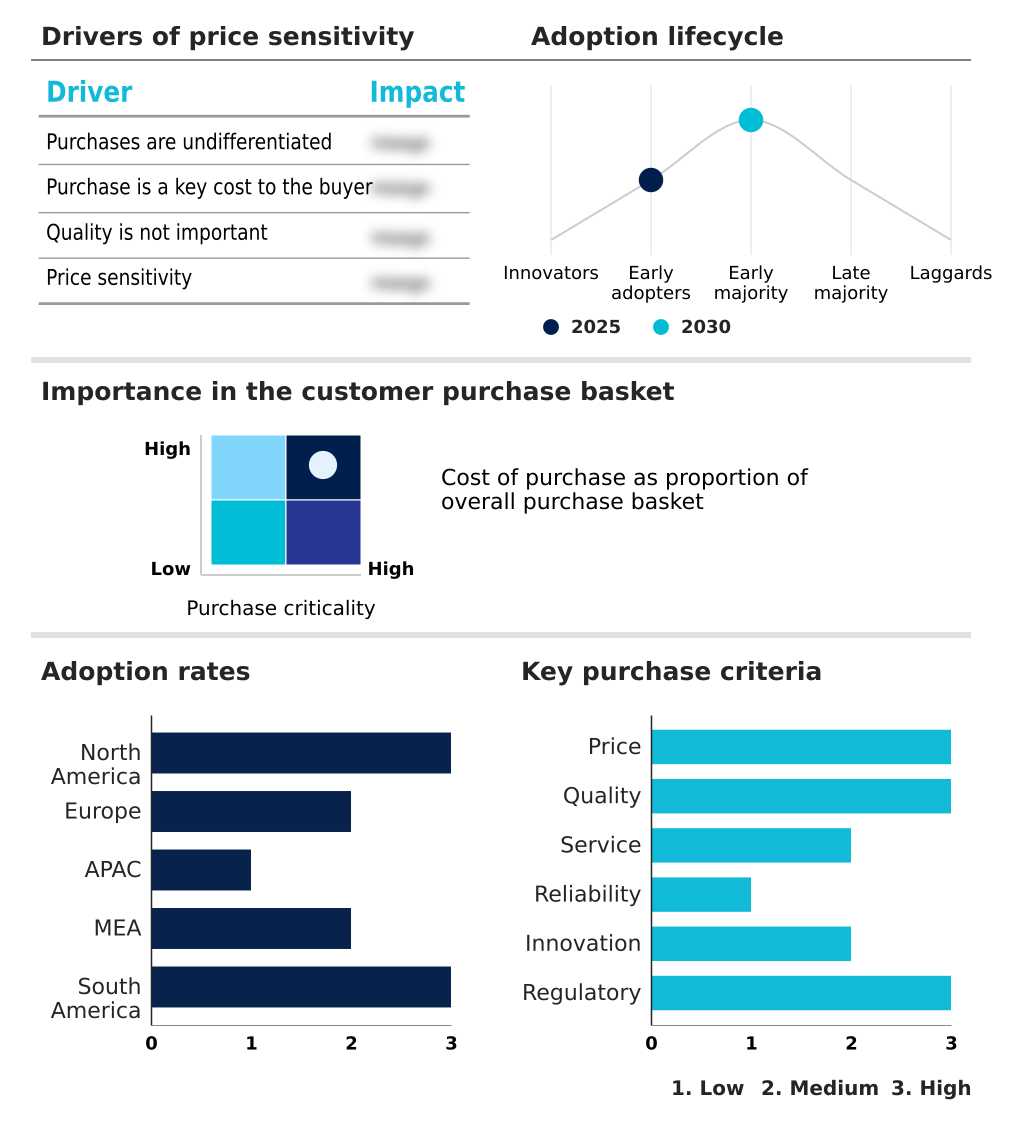
Exclusive Technavio Analysis on Customer Landscape

The nato ammunition market forecasting report includes the adoption lifecycle of the market, covering from the innovator’s stage to the laggard’s stage. It focuses on adoption rates in different regions based on penetration. Furthermore, the nato ammunition market report also includes key purchase criteria and drivers of price sensitivity to help companies evaluate and develop their market growth analysis strategies.

Customer Landscape of NATO Ammunition Industry

Competitive Landscape

Companies are implementing various strategies, such as strategic alliances, nato ammunition market forecast, partnerships, mergers and acquisitions, geographical expansion, and product/service launches, to enhance their presence in the industry.

ARSENAL JS Co. - Offers a diverse portfolio of NATO-compliant ammunition for military and commercial defense, leveraging multiple specialized product lines for broad market coverage.

The industry research and growth report includes detailed analyses of the competitive landscape of the market and information about key companies, including:

  • ARSENAL JS Co.
  • BAE Systems Plc
  • CBC Global Ammunition
  • Diehl Stiftung and Co. KG
  • FN Herstal SA
  • General Dynamics Corp.
  • Global Ordnance LLC
  • KNDS N.V.
  • Nammo AS
  • Northrop Grumman Corp.
  • Olin Corp.
  • Polska Grupa Zbrojeniowa SA
  • Poongsan Corp.
  • Rheinmetall AG
  • Thales Group

Qualitative and quantitative analysis of companies has been conducted to help clients understand the wider business environment as well as the strengths and weaknesses of key industry players. Data is qualitatively analyzed to categorize companies as pure play, category-focused, industry-focused, and diversified; it is quantitatively analyzed to categorize companies as dominant, leading, strong, tentative, and weak.

Recent Development and News in Nato ammunition market

  • In September 2024, Sig Sauer entered into a joint venture agreement with an Indian defense manufacturing facility to bolster India military capabilities amid rising global defense expenditures.
  • In November 2024, Rheinmetall AG announced the completion of its capacity expansion project at the Varpalota facility in Hungary, significantly boosting the production of 155mm artillery projectiles for NATO partners.
  • In March 2025, the German government, in partnership with Rheinmetall AG, announced a landmark initiative to construct a new, state-of-the-art small caliber ammunition plant in Lower Saxony to ensure sovereign production capability.
  • In May 2025, Nammo AS announced a strategic partnership with a consortium of Nordic chemical suppliers to domesticate the production of nitrocellulose, aiming to reduce dependency on non-NATO raw material sources.

Dive into Technavio’s robust research methodology, blending expert interviews, extensive data synthesis, and validated models for unparalleled NATO Ammunition Market insights. See full methodology.

Market Scope
Page number 285
Base year 2025
Historic period 2020-2024
Forecast period 2026-2030
Growth momentum & CAGR Accelerate at a CAGR of 4.7%
Market growth 2026-2030 USD 2226.8 million
Market structure Fragmented
YoY growth 2025-2026(%) 4.5%
Key countries US, Canada, Mexico, UK, Germany, France, Italy, Poland, Spain, South Korea, Japan, India, Australia, Indonesia, Thailand, Turkey, Saudi Arabia, UAE, Egypt, Algeria, Brazil, Colombia and Chile
Competitive landscape Leading Companies, Market Positioning of Companies, Competitive Strategies, and Industry Risks

Request Free Sample

Research Analyst Overview

  • The NATO ammunition market is experiencing a period of intense strategic realignment, forcing a reconsideration of long-held production and procurement models. A core boardroom-level decision revolves around weapon systems modernization, specifically balancing investment in advanced platforms like loitering munitions and hypersonic weapons against the urgent need to mass-produce conventional munitions.
  • The adoption of new technologies, such as polymer casings and advanced composite materials for small caliber ammunition and medium caliber systems, requires significant capital expenditure in new explosive handling facilities. Executives must weigh the long-term benefits of lightweight ammunition, including enhanced soldier effectiveness and reduced logistical strain, against the high costs of retooling.
  • This is particularly relevant as procurement analysis indicates that while price remains a key factor, mission-critical attributes like the effectiveness of armor piercing projectiles and extended range projectiles now account for over 40% of the decision-making criteria, signaling a shift from cost-centric to capability-focused acquisition strategies that align with modern C4ISR systems and battle management systems.

What are the Key Data Covered in this NATO Ammunition Market Research and Growth Report?

  • What is the expected growth of the NATO Ammunition Market between 2026 and 2030?

    • USD 2.23 billion, at a CAGR of 4.7%

  • What segmentation does the market report cover?

    • The report is segmented by Product (Small caliber, Medium caliber, and Large caliber), Type (Ground, Aerial, and Naval), End-user (Military and defense forces, Homeland security, and Others) and Geography (North America, Europe, APAC, Middle East and Africa, South America)

  • Which regions are analyzed in the report?

    • North America, Europe, APAC, Middle East and Africa and South America

  • What are the key growth drivers and market challenges?

    • Increasing in defense spending globally, Proliferation of illicit ammunition manufacturers

  • Who are the major players in the NATO Ammunition Market?

    • ARSENAL JS Co., BAE Systems Plc, CBC Global Ammunition, Diehl Stiftung and Co. KG, FN Herstal SA, General Dynamics Corp., Global Ordnance LLC, KNDS N.V., Nammo AS, Northrop Grumman Corp., Olin Corp., Polska Grupa Zbrojeniowa SA, Poongsan Corp., Rheinmetall AG and Thales Group

Market Research Insights

  • Market dynamics are increasingly shaped by geopolitical security imperatives that are accelerating munitions procurement strategies and driving defense industrial base expansion. Strategic investments in sovereign production capability have already led to a 20% reduction in reliance on foreign sourcing for certain critical components.
  • Simultaneously, the focus on combat readiness enhancement is fueling lightweight ammunition development, which has been shown to improve infantry operational stamina by over 15% during extended missions. These shifts reflect new national defense policies that prioritize high-intensity conflict readiness and battlefield logistics efficiency.
  • As a result, long-term contracts are being awarded to ensure ammunition stockpile replenishment and support sustained military modernization programs.

We can help! Our analysts can customize this nato ammunition market research report to meet your requirements.

Get in touch

1. Executive Summary

1.1 Market overview

Executive Summary - Chart on Market Overview
Executive Summary - Data Table on Market Overview
Executive Summary - Chart on Global Market Characteristics
Executive Summary - Chart on Market by Geography
Executive Summary - Chart on Market Segmentation by Product
Executive Summary - Chart on Market Segmentation by Type
Executive Summary - Chart on Market Segmentation by End-user
Executive Summary - Chart on Incremental Growth
Executive Summary - Data Table on Incremental Growth
Executive Summary - Chart on Company Market Positioning

2. Technavio Analysis

2.1 Analysis of price sensitivity, lifecycle, customer purchase basket, adoption rates, and purchase criteria

2.2 Criticality of inputs and Factors of differentiation

Chart on Overview on criticality of inputs and factors of differentiation

2.3 Factors of disruption

Chart on Overview on factors of disruption

2.4 Impact of drivers and challenges

Chart on Impact of drivers and challenges in 2025 and 2030

3. Market Landscape

3.1 Market ecosystem

Chart on Parent Market
Data Table on - Parent Market

3.2 Market characteristics

Chart on Market characteristics analysis

3.3 Value chain analysis

Chart on Value chain analysis

4. Market Sizing

4.1 Market definition

Data Table on Offerings of companies included in the market definition

4.2 Market segment analysis

Market segments

4.3 Market size 2025

4.4 Market outlook: Forecast for 2025-2030

Chart on Global - Market size and forecast 2025-2030 ($ million)
Data Table on Global - Market size and forecast 2025-2030 ($ million)
Chart on Global Market: Year-over-year growth 2025-2030 (%)
Data Table on Global Market: Year-over-year growth 2025-2030 (%)

5. Historic Market Size

5.1 Global NATO Ammunition Market 2020 - 2024

Historic Market Size - Data Table on Global NATO Ammunition Market 2020 - 2024 ($ million)

5.2 Product segment analysis 2020 - 2024

Historic Market Size - Product Segment 2020 - 2024 ($ million)

5.3 Type segment analysis 2020 - 2024

Historic Market Size - Type Segment 2020 - 2024 ($ million)

5.4 End-user segment analysis 2020 - 2024

Historic Market Size - End-user Segment 2020 - 2024 ($ million)

5.5 Geography segment analysis 2020 - 2024

Historic Market Size - Geography Segment 2020 - 2024 ($ million)

5.6 Country segment analysis 2020 - 2024

Historic Market Size - Country Segment 2020 - 2024 ($ million)

6. Qualitative Analysis

6.1 The AI impact on Global NATO Ammunition Market

7. Five Forces Analysis

7.1 Five forces summary

Five forces analysis - Comparison between 2025 and 2030

7.2 Bargaining power of buyers

Bargaining power of buyers - Impact of key factors 2025 and 2030

7.3 Bargaining power of suppliers

Bargaining power of suppliers - Impact of key factors in 2025 and 2030

7.4 Threat of new entrants

Threat of new entrants - Impact of key factors in 2025 and 2030

7.5 Threat of substitutes

Threat of substitutes - Impact of key factors in 2025 and 2030

7.6 Threat of rivalry

Threat of rivalry - Impact of key factors in 2025 and 2030

7.7 Market condition

Chart on Market condition - Five forces 2025 and 2030

8. Market Segmentation by Product

8.1 Market segments

Chart on Product - Market share 2025-2030 (%)
Data Table on Product - Market share 2025-2030 (%)

8.2 Comparison by Product

Chart on Comparison by Product
Data Table on Comparison by Product

8.3 Small caliber - Market size and forecast 2025-2030

Chart on Small caliber - Market size and forecast 2025-2030 ($ million)
Data Table on Small caliber - Market size and forecast 2025-2030 ($ million)
Chart on Small caliber - Year-over-year growth 2025-2030 (%)
Data Table on Small caliber - Year-over-year growth 2025-2030 (%)

8.4 Medium caliber - Market size and forecast 2025-2030

Chart on Medium caliber - Market size and forecast 2025-2030 ($ million)
Data Table on Medium caliber - Market size and forecast 2025-2030 ($ million)
Chart on Medium caliber - Year-over-year growth 2025-2030 (%)
Data Table on Medium caliber - Year-over-year growth 2025-2030 (%)

8.5 Large caliber - Market size and forecast 2025-2030

Chart on Large caliber - Market size and forecast 2025-2030 ($ million)
Data Table on Large caliber - Market size and forecast 2025-2030 ($ million)
Chart on Large caliber - Year-over-year growth 2025-2030 (%)
Data Table on Large caliber - Year-over-year growth 2025-2030 (%)

8.6 Market opportunity by Product

Market opportunity by Product ($ million)
Data Table on Market opportunity by Product ($ million)

9. Market Segmentation by Type

9.1 Market segments

Chart on Type - Market share 2025-2030 (%)
Data Table on Type - Market share 2025-2030 (%)

9.2 Comparison by Type

Chart on Comparison by Type
Data Table on Comparison by Type

9.3 Ground - Market size and forecast 2025-2030

Chart on Ground - Market size and forecast 2025-2030 ($ million)
Data Table on Ground - Market size and forecast 2025-2030 ($ million)
Chart on Ground - Year-over-year growth 2025-2030 (%)
Data Table on Ground - Year-over-year growth 2025-2030 (%)

9.4 Aerial - Market size and forecast 2025-2030

Chart on Aerial - Market size and forecast 2025-2030 ($ million)
Data Table on Aerial - Market size and forecast 2025-2030 ($ million)
Chart on Aerial - Year-over-year growth 2025-2030 (%)
Data Table on Aerial - Year-over-year growth 2025-2030 (%)

9.5 Naval - Market size and forecast 2025-2030

Chart on Naval - Market size and forecast 2025-2030 ($ million)
Data Table on Naval - Market size and forecast 2025-2030 ($ million)
Chart on Naval - Year-over-year growth 2025-2030 (%)
Data Table on Naval - Year-over-year growth 2025-2030 (%)

9.6 Market opportunity by Type

Market opportunity by Type ($ million)
Data Table on Market opportunity by Type ($ million)

10. Market Segmentation by End-user

10.1 Market segments

Chart on End-user - Market share 2025-2030 (%)
Data Table on End-user - Market share 2025-2030 (%)

10.2 Comparison by End-user

Chart on Comparison by End-user
Data Table on Comparison by End-user

10.3 Military and defense forces - Market size and forecast 2025-2030

Chart on Military and defense forces - Market size and forecast 2025-2030 ($ million)
Data Table on Military and defense forces - Market size and forecast 2025-2030 ($ million)
Chart on Military and defense forces - Year-over-year growth 2025-2030 (%)
Data Table on Military and defense forces - Year-over-year growth 2025-2030 (%)

10.4 Homeland security - Market size and forecast 2025-2030

Chart on Homeland security - Market size and forecast 2025-2030 ($ million)
Data Table on Homeland security - Market size and forecast 2025-2030 ($ million)
Chart on Homeland security - Year-over-year growth 2025-2030 (%)
Data Table on Homeland security - Year-over-year growth 2025-2030 (%)

10.5 Others - Market size and forecast 2025-2030

Chart on Others - Market size and forecast 2025-2030 ($ million)
Data Table on Others - Market size and forecast 2025-2030 ($ million)
Chart on Others - Year-over-year growth 2025-2030 (%)
Data Table on Others - Year-over-year growth 2025-2030 (%)

10.6 Market opportunity by End-user

Market opportunity by End-user ($ million)
Data Table on Market opportunity by End-user ($ million)

11. Customer Landscape

11.1 Customer landscape overview

Analysis of price sensitivity, lifecycle, customer purchase basket, adoption rates, and purchase criteria

12. Geographic Landscape

12.1 Geographic segmentation

Chart on Market share by geography 2025-2030 (%)
Data Table on Market share by geography 2025-2030 (%)

12.2 Geographic comparison

Chart on Geographic comparison
Data Table on Geographic comparison

12.3 North America - Market size and forecast 2025-2030

Chart on North America - Market size and forecast 2025-2030 ($ million)
Data Table on North America - Market size and forecast 2025-2030 ($ million)
Chart on North America - Year-over-year growth 2025-2030 (%)
Data Table on North America - Year-over-year growth 2025-2030 (%)
Chart on Regional Comparison - North America
Data Table on Regional Comparison - North America

12.3.1 US - Market size and forecast 2025-2030

Chart on US - Market size and forecast 2025-2030 ($ million)
Data Table on US - Market size and forecast 2025-2030 ($ million)
Chart on US - Year-over-year growth 2025-2030 (%)
Data Table on US - Year-over-year growth 2025-2030 (%)

12.3.2 Canada - Market size and forecast 2025-2030

Chart on Canada - Market size and forecast 2025-2030 ($ million)
Data Table on Canada - Market size and forecast 2025-2030 ($ million)
Chart on Canada - Year-over-year growth 2025-2030 (%)
Data Table on Canada - Year-over-year growth 2025-2030 (%)

12.3.3 Mexico - Market size and forecast 2025-2030

Chart on Mexico - Market size and forecast 2025-2030 ($ million)
Data Table on Mexico - Market size and forecast 2025-2030 ($ million)
Chart on Mexico - Year-over-year growth 2025-2030 (%)
Data Table on Mexico - Year-over-year growth 2025-2030 (%)

12.4 Europe - Market size and forecast 2025-2030

Chart on Europe - Market size and forecast 2025-2030 ($ million)
Data Table on Europe - Market size and forecast 2025-2030 ($ million)
Chart on Europe - Year-over-year growth 2025-2030 (%)
Data Table on Europe - Year-over-year growth 2025-2030 (%)
Chart on Regional Comparison - Europe
Data Table on Regional Comparison - Europe

12.4.1 UK - Market size and forecast 2025-2030

Chart on UK - Market size and forecast 2025-2030 ($ million)
Data Table on UK - Market size and forecast 2025-2030 ($ million)
Chart on UK - Year-over-year growth 2025-2030 (%)
Data Table on UK - Year-over-year growth 2025-2030 (%)

12.4.2 Germany - Market size and forecast 2025-2030

Chart on Germany - Market size and forecast 2025-2030 ($ million)
Data Table on Germany - Market size and forecast 2025-2030 ($ million)
Chart on Germany - Year-over-year growth 2025-2030 (%)
Data Table on Germany - Year-over-year growth 2025-2030 (%)

12.4.3 France - Market size and forecast 2025-2030

Chart on France - Market size and forecast 2025-2030 ($ million)
Data Table on France - Market size and forecast 2025-2030 ($ million)
Chart on France - Year-over-year growth 2025-2030 (%)
Data Table on France - Year-over-year growth 2025-2030 (%)

12.4.4 Italy - Market size and forecast 2025-2030

Chart on Italy - Market size and forecast 2025-2030 ($ million)
Data Table on Italy - Market size and forecast 2025-2030 ($ million)
Chart on Italy - Year-over-year growth 2025-2030 (%)
Data Table on Italy - Year-over-year growth 2025-2030 (%)

12.4.5 Poland - Market size and forecast 2025-2030

Chart on Poland - Market size and forecast 2025-2030 ($ million)
Data Table on Poland - Market size and forecast 2025-2030 ($ million)
Chart on Poland - Year-over-year growth 2025-2030 (%)
Data Table on Poland - Year-over-year growth 2025-2030 (%)

12.4.6 Spain - Market size and forecast 2025-2030

Chart on Spain - Market size and forecast 2025-2030 ($ million)
Data Table on Spain - Market size and forecast 2025-2030 ($ million)
Chart on Spain - Year-over-year growth 2025-2030 (%)
Data Table on Spain - Year-over-year growth 2025-2030 (%)

12.5 APAC - Market size and forecast 2025-2030

Chart on APAC - Market size and forecast 2025-2030 ($ million)
Data Table on APAC - Market size and forecast 2025-2030 ($ million)
Chart on APAC - Year-over-year growth 2025-2030 (%)
Data Table on APAC - Year-over-year growth 2025-2030 (%)
Chart on Regional Comparison - APAC
Data Table on Regional Comparison - APAC

12.5.1 South Korea - Market size and forecast 2025-2030

Chart on South Korea - Market size and forecast 2025-2030 ($ million)
Data Table on South Korea - Market size and forecast 2025-2030 ($ million)
Chart on South Korea - Year-over-year growth 2025-2030 (%)
Data Table on South Korea - Year-over-year growth 2025-2030 (%)

12.5.2 Japan - Market size and forecast 2025-2030

Chart on Japan - Market size and forecast 2025-2030 ($ million)
Data Table on Japan - Market size and forecast 2025-2030 ($ million)
Chart on Japan - Year-over-year growth 2025-2030 (%)
Data Table on Japan - Year-over-year growth 2025-2030 (%)

12.5.3 India - Market size and forecast 2025-2030

Chart on India - Market size and forecast 2025-2030 ($ million)
Data Table on India - Market size and forecast 2025-2030 ($ million)
Chart on India - Year-over-year growth 2025-2030 (%)
Data Table on India - Year-over-year growth 2025-2030 (%)

12.5.4 Australia - Market size and forecast 2025-2030

Chart on Australia - Market size and forecast 2025-2030 ($ million)
Data Table on Australia - Market size and forecast 2025-2030 ($ million)
Chart on Australia - Year-over-year growth 2025-2030 (%)
Data Table on Australia - Year-over-year growth 2025-2030 (%)

12.5.5 Indonesia - Market size and forecast 2025-2030

Chart on Indonesia - Market size and forecast 2025-2030 ($ million)
Data Table on Indonesia - Market size and forecast 2025-2030 ($ million)
Chart on Indonesia - Year-over-year growth 2025-2030 (%)
Data Table on Indonesia - Year-over-year growth 2025-2030 (%)

12.5.6 Thailand - Market size and forecast 2025-2030

Chart on Thailand - Market size and forecast 2025-2030 ($ million)
Data Table on Thailand - Market size and forecast 2025-2030 ($ million)
Chart on Thailand - Year-over-year growth 2025-2030 (%)
Data Table on Thailand - Year-over-year growth 2025-2030 (%)

12.6 Middle East and Africa - Market size and forecast 2025-2030

Chart on Middle East and Africa - Market size and forecast 2025-2030 ($ million)
Data Table on Middle East and Africa - Market size and forecast 2025-2030 ($ million)
Chart on Middle East and Africa - Year-over-year growth 2025-2030 (%)
Data Table on Middle East and Africa - Year-over-year growth 2025-2030 (%)
Chart on Regional Comparison - Middle East and Africa
Data Table on Regional Comparison - Middle East and Africa

12.6.1 Turkey - Market size and forecast 2025-2030

Chart on Turkey - Market size and forecast 2025-2030 ($ million)
Data Table on Turkey - Market size and forecast 2025-2030 ($ million)
Chart on Turkey - Year-over-year growth 2025-2030 (%)
Data Table on Turkey - Year-over-year growth 2025-2030 (%)

12.6.2 Saudi Arabia - Market size and forecast 2025-2030

Chart on Saudi Arabia - Market size and forecast 2025-2030 ($ million)
Data Table on Saudi Arabia - Market size and forecast 2025-2030 ($ million)
Chart on Saudi Arabia - Year-over-year growth 2025-2030 (%)
Data Table on Saudi Arabia - Year-over-year growth 2025-2030 (%)

12.6.3 UAE - Market size and forecast 2025-2030

Chart on UAE - Market size and forecast 2025-2030 ($ million)
Data Table on UAE - Market size and forecast 2025-2030 ($ million)
Chart on UAE - Year-over-year growth 2025-2030 (%)
Data Table on UAE - Year-over-year growth 2025-2030 (%)

12.6.4 Egypt - Market size and forecast 2025-2030

Chart on Egypt - Market size and forecast 2025-2030 ($ million)
Data Table on Egypt - Market size and forecast 2025-2030 ($ million)
Chart on Egypt - Year-over-year growth 2025-2030 (%)
Data Table on Egypt - Year-over-year growth 2025-2030 (%)

12.6.5 Algeria - Market size and forecast 2025-2030

Chart on Algeria - Market size and forecast 2025-2030 ($ million)
Data Table on Algeria - Market size and forecast 2025-2030 ($ million)
Chart on Algeria - Year-over-year growth 2025-2030 (%)
Data Table on Algeria - Year-over-year growth 2025-2030 (%)

12.7 South America - Market size and forecast 2025-2030

Chart on South America - Market size and forecast 2025-2030 ($ million)
Data Table on South America - Market size and forecast 2025-2030 ($ million)
Chart on South America - Year-over-year growth 2025-2030 (%)
Data Table on South America - Year-over-year growth 2025-2030 (%)
Chart on Regional Comparison - South America
Data Table on Regional Comparison - South America

12.7.1 Brazil - Market size and forecast 2025-2030

Chart on Brazil - Market size and forecast 2025-2030 ($ million)
Data Table on Brazil - Market size and forecast 2025-2030 ($ million)
Chart on Brazil - Year-over-year growth 2025-2030 (%)
Data Table on Brazil - Year-over-year growth 2025-2030 (%)

12.7.2 Colombia - Market size and forecast 2025-2030

Chart on Colombia - Market size and forecast 2025-2030 ($ million)
Data Table on Colombia - Market size and forecast 2025-2030 ($ million)
Chart on Colombia - Year-over-year growth 2025-2030 (%)
Data Table on Colombia - Year-over-year growth 2025-2030 (%)

12.7.3 Chile - Market size and forecast 2025-2030

Chart on Chile - Market size and forecast 2025-2030 ($ million)
Data Table on Chile - Market size and forecast 2025-2030 ($ million)
Chart on Chile - Year-over-year growth 2025-2030 (%)
Data Table on Chile - Year-over-year growth 2025-2030 (%)

12.8 Market opportunity by geography

Market opportunity by geography ($ million)
Data Tables on Market opportunity by geography ($ million)

13. Drivers, Challenges, and Opportunity

13.1 Market drivers

Increasing in defense spending globally
Raising geopolitical tensions and conflicts
Growing threats due to terrorism

13.2 Market challenges

Proliferation of illicit ammunition manufacturers
Weak inventory surveillance
Ammunition smuggling globally

13.3 Impact of drivers and challenges

Impact of drivers and challenges in 2025 and 2030

13.4 Market opportunities

Reduction in weight of ammunition
Growing demand for environment friendly bullets to boost green ammunition
Development of advance ammunition

14. Competitive Landscape

14.1 Overview

14.2

Overview on criticality of inputs and factors of differentiation

14.3 Landscape disruption

Overview on factors of disruption

14.4 Industry risks

Impact of key risks on business

15. Competitive Analysis

15.1 Companies profiled

Companies covered

15.2 Company ranking index

15.3 Market positioning of companies

Matrix on companies position and classification

15.4 ARSENAL JS Co.

ARSENAL JS Co. - Overview
ARSENAL JS Co. - Product / Service
ARSENAL JS Co. - Key offerings
SWOT

15.5 BAE Systems Plc

BAE Systems Plc - Overview
BAE Systems Plc - Business segments
BAE Systems Plc - Key news
BAE Systems Plc - Key offerings
BAE Systems Plc - Segment focus
SWOT

15.6 CBC Global Ammunition

CBC Global Ammunition - Overview
CBC Global Ammunition - Product / Service
CBC Global Ammunition - Key offerings
SWOT

15.7 Diehl Stiftung and Co. KG

Diehl Stiftung and Co. KG - Overview
Diehl Stiftung and Co. KG - Product / Service
Diehl Stiftung and Co. KG - Key news
Diehl Stiftung and Co. KG - Key offerings
SWOT

15.8 FN Herstal SA

FN Herstal SA - Overview
FN Herstal SA - Product / Service
FN Herstal SA - Key offerings
SWOT

15.9 General Dynamics Corp.

General Dynamics Corp. - Overview
General Dynamics Corp. - Business segments
General Dynamics Corp. - Key news
General Dynamics Corp. - Key offerings
General Dynamics Corp. - Segment focus
SWOT

15.10 Global Ordnance LLC

Global Ordnance LLC - Overview
Global Ordnance LLC - Product / Service
Global Ordnance LLC - Key offerings
SWOT

15.11 KNDS N.V.

KNDS N.V. - Overview
KNDS N.V. - Product / Service
KNDS N.V. - Key offerings
SWOT

15.12 Nammo AS

Nammo AS - Overview
Nammo AS - Product / Service
Nammo AS - Key offerings
SWOT

15.13 Northrop Grumman Corp.

Northrop Grumman Corp. - Overview
Northrop Grumman Corp. - Business segments
Northrop Grumman Corp. - Key news
Northrop Grumman Corp. - Key offerings
Northrop Grumman Corp. - Segment focus
SWOT

15.14 Olin Corp.

Olin Corp. - Overview
Olin Corp. - Business segments
Olin Corp. - Key offerings
Olin Corp. - Segment focus
SWOT

15.15 Polska Grupa Zbrojeniowa SA

Polska Grupa Zbrojeniowa SA - Overview
Polska Grupa Zbrojeniowa SA - Product / Service
Polska Grupa Zbrojeniowa SA - Key offerings
SWOT

15.16 Poongsan Corp.

Poongsan Corp. - Overview
Poongsan Corp. - Product / Service
Poongsan Corp. - Key offerings
SWOT

15.17 Rheinmetall AG

Rheinmetall AG - Overview
Rheinmetall AG - Business segments
Rheinmetall AG - Key offerings
Rheinmetall AG - Segment focus
SWOT

15.18 Thales Group

Thales Group - Overview
Thales Group - Business segments
Thales Group - Key news
Thales Group - Key offerings
Thales Group - Segment focus
SWOT

16. Appendix

16.1 Scope of the report

Market definition
Objectives
Notes and caveats

16.2 Inclusions and exclusions checklist

Inclusions checklist
Exclusions checklist

16.3 Currency conversion rates for US$

16.4 Research methodology

16.5 Data procurement

Information sources

16.6 Data validation

16.7 Validation techniques employed for market sizing

16.8 Data synthesis

16.9 360 degree market analysis

16.10 List of abbreviations

Research Methodology

Technavio presents a detailed picture of the market by way of study, synthesis, and summation of data from multiple sources. The analysts have presented the various facets of the market with a particular focus on identifying the key industry influencers. The data thus presented is comprehensive, reliable, and the result of extensive research, both primary and secondary.

INFORMATION SOURCES

Primary sources

  • Manufacturers and suppliers
  • Channel partners
  • Industry experts
  • Strategic decision makers

Secondary sources

  • Industry journals and periodicals
  • Government data
  • Financial reports of key industry players
  • Historical data
  • Press releases

DATA ANALYSIS

Data Synthesis

  • Collation of data
  • Estimation of key figures
  • Analysis of derived insights

Data Validation

  • Triangulation with data models
  • Reference against proprietary databases
  • Corroboration with industry experts

REPORT WRITING

Qualitative

  • Market drivers
  • Market challenges
  • Market trends
  • Five forces analysis

Quantitative

  • Market size and forecast
  • Market segmentation
  • Geographical insights
  • Competitive landscape

Interested in this report?

Get your sample now to see our research methodology and insights!

Download Now

Frequently Asked Questions

NATO Ammunition market growth will increase by USD 2226.8 million during 2026-2030.

The NATO Ammunition market is expected to grow at a CAGR of 4.7% during 2026-2030.

NATO Ammunition market is segmented by Product (Small caliber, Medium caliber, Large caliber) Type (Ground, Aerial, Naval) End-user (Military and defense forces, Homeland security, Others)

ARSENAL JS Co., BAE Systems Plc, CBC Global Ammunition, Diehl Stiftung and Co. KG, FN Herstal SA, General Dynamics Corp., Global Ordnance LLC, KNDS N.V., Nammo AS, Northrop Grumman Corp., Olin Corp., Polska Grupa Zbrojeniowa SA, Poongsan Corp., Rheinmetall AG, Thales Group are a few of the key vendors in the NATO Ammunition market.

North America will register the highest growth rate of 54% among the other regions. Therefore, the NATO Ammunition market in North America is expected to garner significant business opportunities for the vendors during the forecast period.

US, Canada, Mexico, UK, Germany, France, Italy, Poland, Spain, South Korea, Japan, India, Australia, Indonesia, Thailand, Turkey, Saudi Arabia, UAE, Egypt, Algeria, Brazil, Colombia, Chile

  • Increasing in defense spending globally is the driving factor this market.

The NATO Ammunition market vendors should focus on grabbing business opportunities from the Product segment as it accounted for the largest market share in the base year.