
Nitrocellulose Market Size 2025-2029
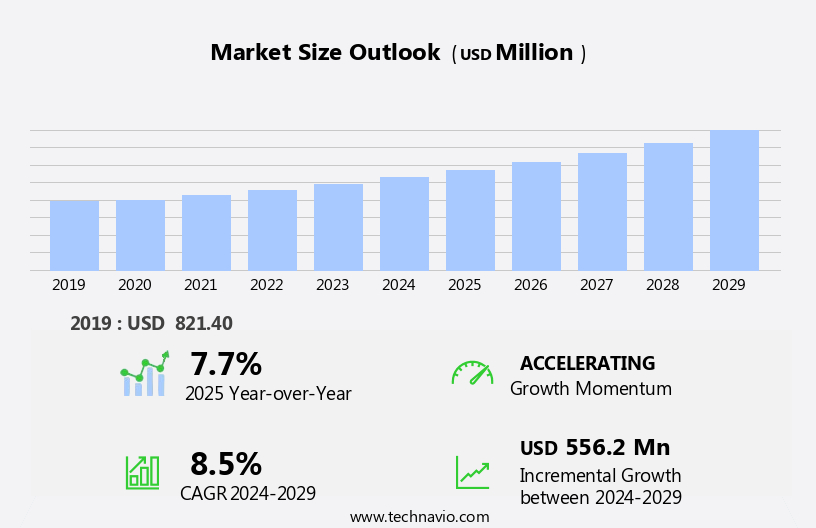
The nitrocellulose market size is forecast to increase by USD 556.2 million, at a CAGR of 8.5% between 2024 and 2029.
- The market is driven by the abundant availability of cellulose, the primary raw material, and the relatively simple manufacturing process. This raw material advantage, coupled with the increasing use of nitrocellulose as propellants, particularly in the explosives industry, fuels market growth. However, stringent regulations on emissions of hazardous substances pose a significant challenge to market participants. These regulations necessitate the adoption of advanced technologies to minimize emissions, thereby increasing production costs. Companies must navigate these regulations while maintaining competitiveness in the market.
- To capitalize on opportunities, market players can focus on innovation and technology development to address regulatory challenges and improve efficiency in production processes. Additionally, exploring applications beyond propellants, such as in coatings and adhesives, could provide new revenue streams. Overall, the market presents both opportunities and challenges, requiring strategic planning and adaptability from industry participants.
What will be the Size of the Nitrocellulose Market during the forecast period?
Explore in-depth regional segment analysis with market size data - historical 2019-2023 and forecasts 2025-2029 - in the full report.
Request Free Sample
The market continues to evolve, driven by the diverse applications of this versatile material across various sectors. Sodium cellulose sulfate, a key derivative, plays a crucial role in ensuring chemical stability for nitrocellulose-based products. Specialty coatings, including dip coating, airless spraying, airbrush spraying, roll coating, and spray coating, are integral to the production process, each with unique handling procedures. Quality control measures are paramount in the nitrocellulose industry, with stringent regulations governing safety and performance. Thermal stability and protective coatings are essential for industrial applications, while molecular weight and chemical composition determine the suitability of cellulose esters for consumer products.
Manufacturing processes for nitrocellulose involve solvent-based and water-based coatings, requiring specific storage conditions. Handling procedures for powders, such as cellulose acetate and ethyl cellulose, necessitate careful attention due to their sensitivity to moisture and temperature. Innovations in technology continue to unfold, with advancements in high-pressure spraying, electrostatic spraying, and hydroxypropyl methylcellulose offering improved efficiency and performance. The ongoing evolution of the market is marked by the constant exploration of new applications and the development of more sustainable and eco-friendly manufacturing processes.
How is this Nitrocellulose Industry segmented?
The nitrocellulose industry research report provides comprehensive data (region-wise segment analysis), with forecasts and estimates in "USD million" for the period 2025-2029, as well as historical data from 2019-2023 for the following segments.
- Application
- Printing ink
- Automotive paint
- Wood coating
- Leather finishes
- Others
- Grade Type
- E grade
- A grade
- M grade
- Type
- Soluble
- Insoluble
- Geography
- North America
- US
- Canada
- Europe
- France
- Germany
- Italy
- UK
- APAC
- China
- India
- Japan
- South Korea
- Rest of World (ROW)
- North America
By Application Insights
The printing ink segment is estimated to witness significant growth during the forecast period.
Nitrocellulose, a cellulose ether, plays a significant role in various industries, particularly in printing inks and coatings. In 2024, the printing ink segment dominated The market due to its extensive use as a key ingredient. Nitrocellulose comprises 8-10% of the raw material in printing inks and is favored for its quick drying property, heat resistance, and ability to dissolve in organic solvents. Its non-toxic and odorless nature further adds to its appeal. In the packaging industry, nitrocellulose-based printing inks are widely used for producing high-contrast and high-resolution graphics on flexible films, which are commonly used for food and bakery product packaging.
Additionally, nitrocellulose is employed in various manufacturing processes, including high-pressure spraying, airless spraying, airbrush spraying, dip coating, roll coating, and electrostatic spraying, to produce protective and industrial coatings. These coatings offer chemical stability and thermal stability, making them suitable for diverse applications. Furthermore, the market encompasses cellulose esters such as cellulose butyrate, carboxymethyl cellulose, sodium cellulose sulfate, and cellulose propionate, among others, which cater to various industries, including consumer products and specialty coatings. Proper handling procedures and adherence to safety regulations are crucial in the production and application of nitrocellulose-based coatings and inks. Both solvent-based and water-based coatings are available, with storage conditions varying based on the specific application.
Other nitrocellulose derivatives, including methyl cellulose, hydroxypropyl methylcellulose, ethyl cellulose, cellulose acetate, and cellulose nitrate, also find extensive use in various industries.
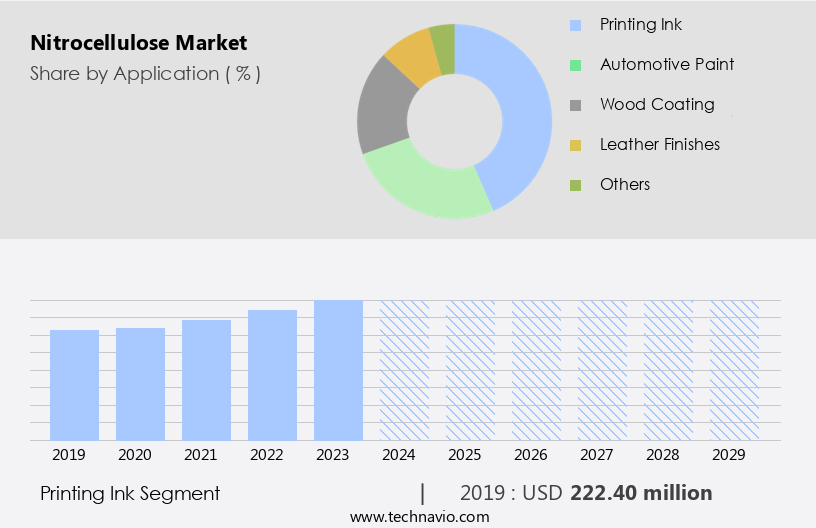
The Printing ink segment was valued at USD 222.40 million in 2019 and showed a gradual increase during the forecast period.
Regional Analysis
APAC is estimated to contribute 34% to the growth of the global market during the forecast period.Technavio’s analysts have elaborately explained the regional trends and drivers that shape the market during the forecast period.
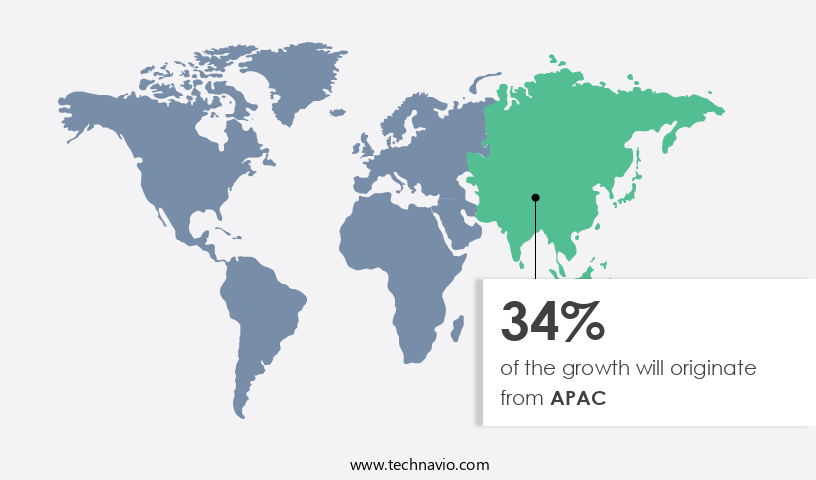
The market is significantly shaped by various processes and components. In 2024, APAC held the largest market share and is projected to continue leading due to substantial investments in applications like automotive paints and wood coatings in emerging economies, such as India, China, and other APAC countries. Nitrocellulose's application extends to lacquer, paints, coatings, and coating sprays. The region's dominance is attributed to its production of major raw materials, including sulfuric acid and nitric acid. Key countries contributing to the market's revenue include China, India, Indonesia, Vietnam, and Japan, driven by the high demand for nitrocellulose.
Nitrocellulose's production involves various techniques, including HPLP spraying and high-pressure spraying, while its forms range from solvent-based to water-based. Cellulose esters, such as cellulose butyrate, carboxymethyl cellulose, and cellulose propionate, contribute to the market's growth. Thermal stability and chemical stability are essential factors for the production and application of nitrocellulose. Protective coatings, industrial coatings, and specialty coatings employ nitrocellulose for its desirable properties. Dip coating, roll coating, airless spraying, airbrush spraying, and electrostatic spraying are common application methods. Manufacturing processes like methyl cellulose and hydroxypropyl methylcellulose production also utilize nitrocellulose. Cellulose ethers, such as sodium cellulose sulfate and methyl cellulose, are essential raw materials in the market.
Cellulose acetate, ethyl cellulose, and cellulose nitrate are other cellulose derivatives used in various industries. Printing inks, consumer products, and manufacturing processes are significant markets for nitrocellulose. Safety regulations and handling procedures are crucial considerations in the market. Powder coatings and electrostatic spraying are popular methods for applying nitrocellulose in various industries. The molecular weight of nitrocellulose impacts its performance and application. Overall, the market is dynamic, driven by various applications, raw materials, and production techniques.
Market Dynamics
Our researchers analyzed the data with 2024 as the base year, along with the key drivers, trends, and challenges. A holistic analysis of drivers will help companies refine their marketing strategies to gain a competitive advantage.
Global Cold Chain Logistics Market: Trends, Technologies, Sustainability, and Growth Prospects (2025-2030) The global cold chain logistics market is a critical sector that ensures the safe and efficient transportation and storage of temperature-sensitive goods, including food, pharmaceuticals, and other perishable items. This market is expected to witness significant growth between 2025 and 2030, driven by various factors such as increasing consumer demand for fresh and high-quality products, rising investment in advanced technologies, and the growing focus on sustainability practices. Key Market Trends and Technologies: The cold chain logistics market is witnessing the adoption of advanced technologies such as IoT, RFID, and GPS tracking systems to monitor temperature and ensure timely delivery. The use of reusable packaging and insulated containers is also gaining popularity due to their environmental benefits and cost savings. Furthermore, the integration of automation and robotics in warehouses and distribution centers is streamlining operations and reducing human error. Sustainability Practices: Sustainability is a key concern in the cold chain logistics industry, with companies increasingly adopting green initiatives to reduce their carbon footprint. This includes the use of renewable energy sources, such as solar and wind power, and the implementation of energy-efficient technologies, such as refrigeration systems and insulated containers. Industry Segments and Challenges: The cold chain logistics market can be segmented into various categories, including temperature-controlled transportation, warehousing and storage, and value-added services. Each segment faces unique challenges, such as ensuring consistent temperature control, managing complex supply chains, and complying with regulatory requirements. Regional Context: Asia-Pacific and North America: The Asia-Pacific region is expected to be the fastest-growing market for cold chain logistics, driven by the increasing demand for perishable goods, particularly in countries such as China and India. North America is another significant market, with the US leading the way in terms of investment in advanced technologies and sustainability practices. B2B and Procurement Strategies: B2B partnerships and procurement strategies play a crucial role in the cold chain logistics industry. Companies are increasingly collaborating with third-party logistics providers to optimize their supply chains and reduce costs. Furthermore, the use of e-procurement platforms and digital marketplaces is gaining popularity, enabling real-time visibility and collaboration between buyers and sellers. In conclusion, the global cold chain logistics market is a dynamic and evolving industry that is expected to witness significant growth in the coming years. With a focus on advanced technologies, sustainability practices, and efficient supply chain management, companies can overcome the challenges and capitalize on the opportunities presented by this market.
What are the key market drivers leading to the rise in the adoption of Nitrocellulose Industry?
- The abundant availability of cellulose and the relatively straightforward manufacturing process for nitrocellulose are significant factors driving the growth of the market.
- Cellulose, a natural organic polysaccharide abundant in plants, is a significant raw material in the production of nitrocellulose. Sources of cellulose include cotton, hemp, flax, jute, and wood. The unique structure of cellulose makes it an essential component in various industries, particularly in the manufacturing of protective and industrial coatings through methods like HVLP spraying. Nitrocellulose is produced by reacting a cotton ball, a pure form of cellulose, with a 2:1 ratio of concentrated nitric and sulfuric acids. This reaction results in a highly flammable and explosive material that is widely used in the production of gunpowder, pyrotechnics, and as a film base in photography.
- Moreover, cellulose esters, such as cellulose butyrate, carboxymethyl cellulose, and cellulose propionate, are derived from cellulose and are used in the production of protective and industrial coatings due to their thermal stability and excellent film-forming properties. These cellulose esters enhance the durability, flexibility, and resistance to chemicals and weathering of coatings. The versatility of cellulose and its derivatives in various industries makes it a valuable commodity in the market for protective and industrial coatings.
What are the market trends shaping the Nitrocellulose Industry?
- The use of nitrocellulose as propellants is gaining increasing popularity in the market. This trend is driven by the advantages offered by nitrocellulose, such as its high energy density and reliable performance.
- Nitrocellulose is a low-order explosive used primarily as a propellant. It generates a subsonic explosion, producing less over-pressurization than high-order explosives. Nitrocellulose propellants are classified into single-base, double-base, and composite types. Single-base propellants consist of pure nitrocellulose powder, while double-base propellants contain nitroglycerine in addition to nitrocellulose. Composite propellants combine fuels and oxidizers, which include nitrocellulose and nitroglycerine. In specialty coatings applications, nitrocellulose is used due to its chemical stability. Various coating techniques, such as dip coating, airless spraying, airbrush spraying, and roll coating, employ nitrocellulose. Proper handling procedures are crucial to ensure the quality of nitrocellulose-based coatings. Nitrocellulose's chemical stability makes it suitable for various industries, including aerospace, automotive, and electronics.
- Its use in these industries necessitates stringent quality control measures to maintain consistency and reliability. The demand for high-performance coatings in these sectors is expected to drive the growth of the market. Sodium cellulose sulfate, a derivative of nitrocellulose, is gaining popularity due to its improved handling properties and enhanced performance. This trend is expected to further expand the application scope of nitrocellulose in various industries.
What challenges does the Nitrocellulose Industry face during its growth?
- The strict regulations imposed on the emissions of hazardous substances pose a significant challenge to the industry's growth. Adhering to these stringent standards adds to the operational costs and complexity for businesses in the sector.
- Nitrocellulose, a key ingredient in various industries including solvent-based coatings for paints and printing inks, faces regulatory scrutiny due to its potential environmental impact. Strict regulations in Western Europe and North America, such as those from the European Union (EU) and the US Food and Drug Administration (FDA), aim to limit the use and emissions of volatile organic chemicals (VOCs) contained in these products. In response, manufacturers are turning to alternative, safer solutions, such as water-based coatings and cellulose derivatives like ethyl cellulose.
- These alternatives produce lower VOC emissions and comply with safety regulations. The transportation of nitrocellulose, which is highly flammable, is also subject to regulations like REACH in the EU, ensuring safe handling and transport. Companies must prioritize the development of environmentally friendly and compliant products to meet these regulatory requirements.
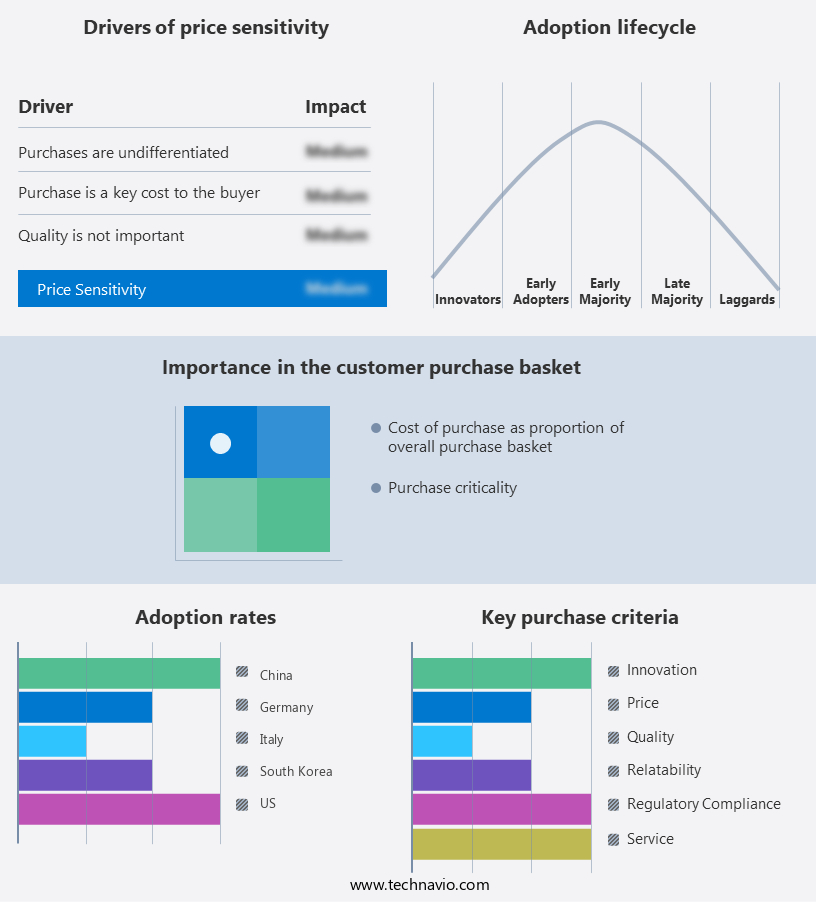
Exclusive Customer Landscape
The nitrocellulose market forecasting report includes the adoption lifecycle of the market, covering from the innovator’s stage to the laggard’s stage. It focuses on adoption rates in different regions based on penetration. Furthermore, the nitrocellulose market report also includes key purchase criteria and drivers of price sensitivity to help companies evaluate and develop their market growth analysis strategies.
Customer Landscape
Key Companies & Market Insights
Companies are implementing various strategies, such as strategic alliances, nitrocellulose market forecast, partnerships, mergers and acquisitions, geographical expansion, and product/service launches, to enhance their presence in the industry.
AGROFERT AS - The company specializes in the production of two distinct types of nitrocellulose: Army nitrocellulose and Industrial nitrocellulose. Army nitrocellulose is utilized primarily for explosives, while Industrial nitrocellulose finds applications in various industries such as pharmaceuticals, food, and textiles. This versatile material undergoes a nitration process to create its unique properties, making it a valuable commodity in numerous sectors.
The industry research and growth report includes detailed analyses of the competitive landscape of the market and information about key companies, including:
- AGROFERT AS
- Asahi Kasei Corp.
- Celanese Corp.
- Eastman Chemical Co.
- Eurenco
- GRN Cellulose Pvt. Ltd.
- Hagedorn NC GmbH
- Hubei Xuefei Chemical Co. Ltd.
- International Flavors and Fragrances Inc.
- IVM Srl
- KOREA CNC Ltd.
- Kumho Petrochemical Co. Ltd.
- MaxamCorp Holding S.L.
- Merck KGaA
- Nitrex Chemicals India Ltd.
- Nitro
- Nitro Chemical Industry Ltd.
- Nitroparis S.L.
- Rheinmetall AG
- TNC Industrial Co. Ltd.
Qualitative and quantitative analysis of companies has been conducted to help clients understand the wider business environment as well as the strengths and weaknesses of key industry players. Data is qualitatively analyzed to categorize companies as pure play, category-focused, industry-focused, and diversified; it is quantitatively analyzed to categorize companies as dominant, leading, strong, tentative, and weak.
Recent Development and News in Nitrocellulose Market
- In January 2024, DuPont Nutrition & Biosciences, a leading producer of nitrocellulose, announced the expansion of its manufacturing facility in Europe to enhance its production capacity by 30%. This expansion aimed to cater to the growing demand for nitrocellulose in various industries, including pharmaceuticals, electronics, and food and beverages (DuPont Press Release, 2024).
- In March 2024, Ashland Global Holdings Inc. And Nanocyl SA, a leading producer of nanotubes and nanoparticles, entered into a strategic partnership to develop advanced nitrocellulose-based materials. This collaboration aimed to create innovative, high-performance materials for various applications, including batteries, coatings, and filtration systems (Ashland Press Release, 2024).
- In May 2024, 3M, a prominent player in the market, completed the acquisition of Axiall Corporation's Performance Materials business. This acquisition significantly expanded 3M's nitrocellulose product portfolio and enhanced its presence in the coatings, adhesives, and specialty materials market (3M Press Release, 2024).
- In April 2025, the European Chemicals Agency (ECHA) approved the renewal of the registration of nitrocellulose under the European Union's REACH regulation. This approval ensured the continued availability and use of nitrocellulose in various industries while maintaining regulatory compliance (ECHA Press Release, 2025).
Research Analyst Overview
- The market encompasses a diverse range of cellulosic materials, including regenerated cellulose, microcrystalline cellulose, and cellulose derivatives. These materials exhibit desirable properties such as abrasion resistance, UV resistance, impact strength, and weathering resistance, making them suitable for various applications. Plant fibers, including wood pulp and cotton linters, serve as primary feedstocks for cellulose production. Sustainable materials, like those derived from renewable resources, are gaining traction due to their environmental impact reduction and alignment with the circular economy. Processing aids and rheology modifiers facilitate the conversion of biomass into cellulosic materials, contributing to waste reduction and sustainable development. The use of sustainable materials, such as fungal cellulose and bacterial cellulose, is also on the rise, driven by the demand for green chemistry and reduced environmental footprint.
- The market trends reflect a shift towards the use of cellulosic materials with superior properties, such as high tensile strength, flexural strength, and chemical resistance, to meet the evolving needs of industries. Life cycle assessment plays a crucial role in evaluating the environmental impact of cellulosic materials, ensuring their sustainable production and use. Contact angle and surface tension measurements are essential in understanding the interaction between cellulosic materials and their environments, further advancing their applications.
Dive into Technavio’s robust research methodology, blending expert interviews, extensive data synthesis, and validated models for unparalleled Nitrocellulose Market insights. See full methodology.
|
Market Scope |
|
|
Report Coverage |
Details |
|
Page number |
225 |
|
Base year |
2024 |
|
Historic period |
2019-2023 |
|
Forecast period |
2025-2029 |
|
Growth momentum & CAGR |
Accelerate at a CAGR of 8.5% |
|
Market growth 2025-2029 |
USD 556.2 million |
|
Market structure |
Fragmented |
|
YoY growth 2024-2025(%) |
7.7 |
|
Key countries |
US, China, Japan, Germany, India, UK, South Korea, Canada, France, and Italy |
|
Competitive landscape |
Leading Companies, Market Positioning of Companies, Competitive Strategies, and Industry Risks |
What are the Key Data Covered in this Nitrocellulose Market Research and Growth Report?
- CAGR of the Nitrocellulose industry during the forecast period
- Detailed information on factors that will drive the growth and forecasting between 2025 and 2029
- Precise estimation of the size of the market and its contribution of the industry in focus to the parent market
- Accurate predictions about upcoming growth and trends and changes in consumer behaviour
- Growth of the market across APAC, Europe, North America, Middle East and Africa, and South America
- Thorough analysis of the market’s competitive landscape and detailed information about companies
- Comprehensive analysis of factors that will challenge the nitrocellulose market growth of industry companies
We can help! Our analysts can customize this nitrocellulose market research report to meet your requirements.
 RIA -
RIA - 
