Natural Language Generation Market Analysis, Size, and Forecast 2025-2029: North America (US, Canada, and Mexico), Europe (Germany, UK, and France), APAC (China, Japan, and India), Middle East and Africa (UAE, Saudi Arabia, and Israel), South America (Brazil, Argentina, and Colombia), and Rest of World (ROW)

Natural Language Generation Market Analysis, Size, and Forecast 2025-2029:
North America (US, Canada, and Mexico), Europe (Germany, UK, and France), APAC (China, Japan, and India), Middle East and Africa (UAE, Saudi Arabia, and Israel), South America (Brazil, Argentina, and Colombia), and Rest of World (ROW)

Published: Dec 2025 299 Pages SKU: IRTNTR81063

Market Overview at a Glance

$2.08 B
Market Opportunity
20.7%
CAGR 2024 - 2029
36.8%
North America Growth
$775.6 Mn
Software segment 2023

Natural Language Generation Market Size 2025-2029

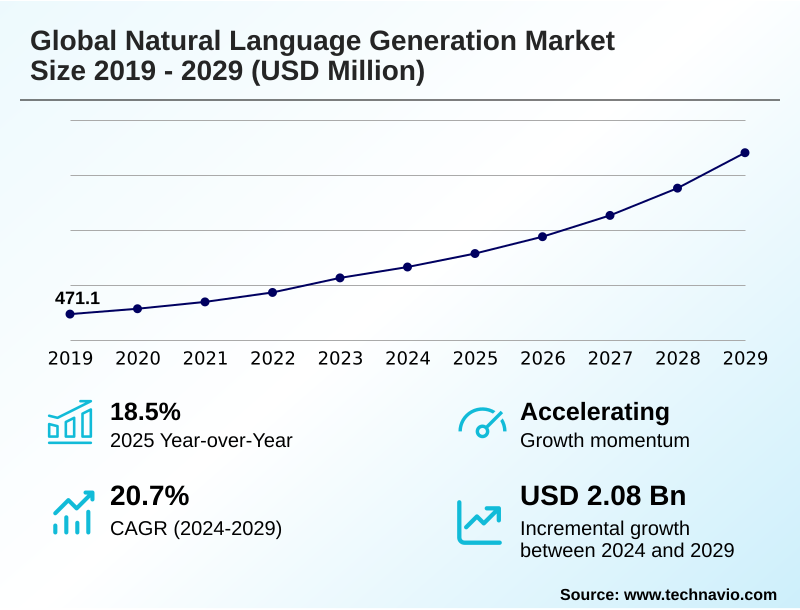
The natural language generation market size is valued to increase by USD 2.08 billion, at a CAGR of 20.7% from 2024 to 2029. Proliferation of advanced AI and LLM will drive the natural language generation market.

Major Market Trends & Insights

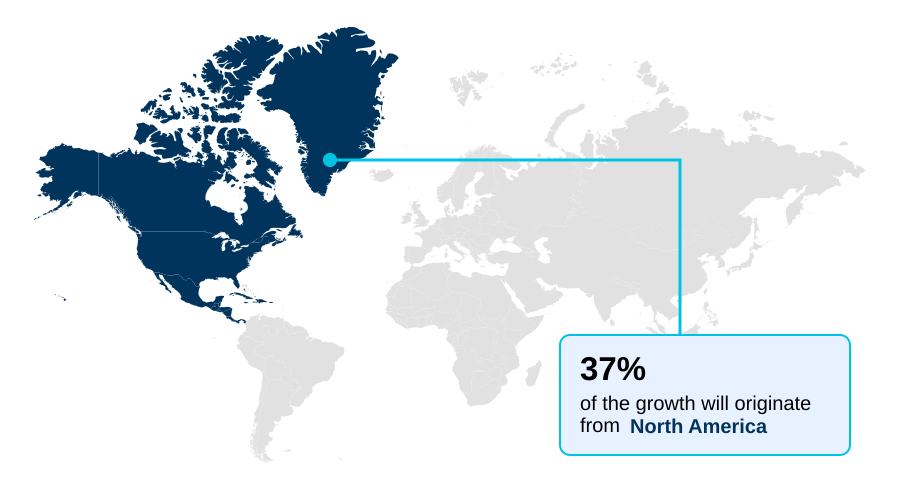
  • North America dominated the market and accounted for a 36.8% growth during the forecast period.
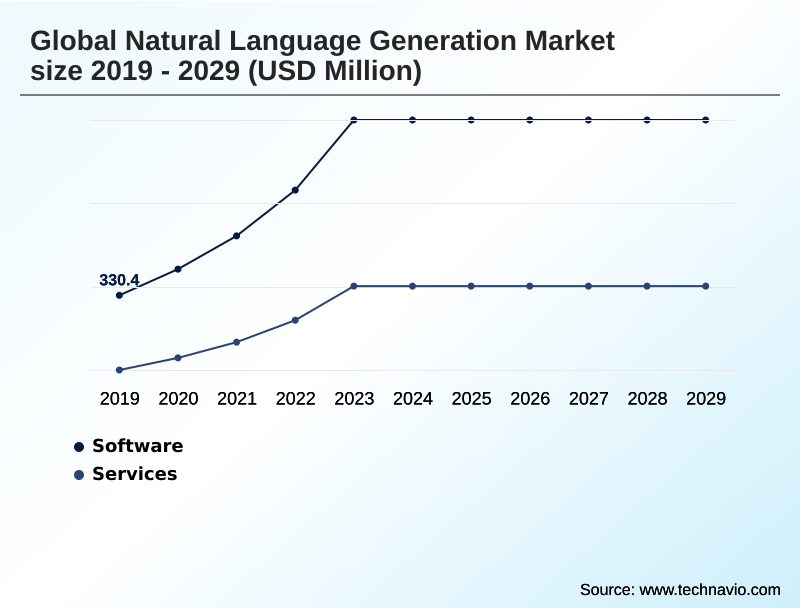
  • By Component - Software segment was valued at USD 775.6 million in 2023
  • By Deployment - Cloud segment accounted for the largest market revenue share in 2023

Market Size & Forecast

  • Market Opportunities: USD 2.93 billion
  • Market Future Opportunities: USD 2.08 billion
  • CAGR from 2024 to 2029 : 20.7%

Market Summary

  • The natural language generation market is fundamentally transforming how businesses convert raw data into actionable intelligence. This technology leverages sophisticated algorithms to automate the creation of human-like text, turning complex datasets into coherent, readable narratives. Key drivers include the escalating demand for data-driven decision-making and the need for operational efficiency across industries.
  • For example, in the financial sector, firms are deploying these systems to automate the generation of quarterly earnings reports and compliance documents, a process that was once manual and error-prone. This shift frees analysts to focus on strategic interpretation rather than repetitive writing.
  • The market's trajectory is also shaped by advancements in deep learning and large language models, which are making the generated content more nuanced and contextually aware. However, the technology's dependence on high-quality, unbiased training data presents a notable challenge, as does the need to ensure the factual accuracy of the automated outputs.
  • As the technology matures, its integration with business intelligence tools is democratizing data analysis, empowering a broader range of users to understand and act on complex information without requiring deep technical expertise. This evolution marks a significant step toward more intelligent and automated enterprise operations.

What will be the Size of the Natural Language Generation Market during the forecast period?

Get Key Insights on Market Forecast (PDF) Request Free Sample

How is the Natural Language Generation Market Segmented?

The natural language generation industry research report provides comprehensive data (region-wise segment analysis), with forecasts and estimates in "USD million" for the period 2025-2029, as well as historical data from 2019-2023 for the following segments.

  • Component
    • Software
    • Services
  • Deployment
    • Cloud
    • On premise
  • Application
    • Risk and compliance management
    • BFSI
    • Healthcare
    • Retail and e-commerce
    • Media and entertainment
  • Geography
    • North America
      • US
      • Canada
      • Mexico
    • Europe
      • Germany
      • UK
      • France
    • APAC
      • China
      • Japan
      • India
    • Middle East and Africa
      • UAE
      • Saudi Arabia
      • Israel
    • South America
      • Brazil
      • Argentina
      • Colombia
    • Rest of World (ROW)

By Component Insights

The software segment is estimated to witness significant growth during the forecast period.

The software segment is shifting from standalone platforms to embedded capabilities within enterprise applications. This evolution is driven by the need for seamless automated content creation and real-time data narratives directly within business workflows.

Innovations in transformer architectures are central to this change, enabling more sophisticated text summarization and prompt engineering.

The integration of NLG for compliance documentation and financial reporting automation is becoming standard, as firms using these tools report up to a 90% reduction in reporting errors.

This deep integration makes data-driven storytelling accessible to non-technical users, leveraging tokenization process and embedding models to turn complex data into clear insights, which enhances operational efficiency gains.

Request Free Sample

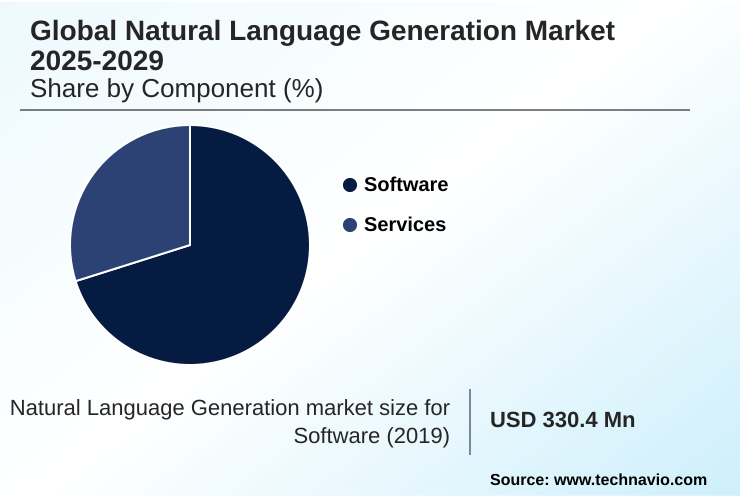
The Software segment was valued at USD 775.6 million in 2023 and showed a gradual increase during the forecast period.

Request Free Sample

Regional Analysis

North America is estimated to contribute 36.8% to the growth of the global market during the forecast period.Technavio’s analysts have elaborately explained the regional trends and drivers that shape the market during the forecast period.

See How Natural Language Generation Market Demand is Rising in North America Request Free Sample

The geographic landscape is led by North America, which is projected to contribute over 36% of the market’s incremental growth, driven by early adoption and a high concentration of technology leaders.

The region's mature infrastructure supports advanced applications of generative AI and natural language understanding (NLU), particularly in its highly regulated financial and healthcare sectors.

Meanwhile, APAC is the fastest-growing region, fueled by rapid digitalization and a burgeoning e-commerce sector that demands multilingual content generation. The proliferation of AI model-as-a-service offerings is lowering entry barriers, fostering innovation in countries like India and China.

Europe's growth is propelled by a strong focus on AI governance frameworks and ethical AI deployment, which builds trust and encourages enterprise adoption for applications such as clinical documentation improvement.

Market Dynamics

Our researchers analyzed the data with 2024 as the base year, along with the key drivers, trends, and challenges. A holistic analysis of drivers will help companies refine their marketing strategies to gain a competitive advantage.

  • Enterprises are increasingly evaluating the strategic benefits of natural language generation, often starting by comparing on-premise vs. cloud NLG solutions to align with security and scalability needs. A key adoption pathway involves NLG integration with CRM platforms, which transforms customer data into actionable insights and enhances communication.
  • For instance, firms are now improving customer service with conversational AI that delivers nuanced and personalized support. In parallel, the technology is revolutionizing content-centric operations, demonstrated by the use of NLG for personalized e-commerce descriptions, which can significantly lift conversion rates. The application of NLG for automated technical documentation streamlines knowledge management and reduces manual effort.
  • In finance, automating financial reports with NLG is becoming standard practice, with some firms reducing report generation times from days to minutes, an efficiency gain nearly double that of other automated business processes. Success in these areas depends on addressing the core data quality requirements for NLG systems.
  • As organizations scale, many are fine-tuning language models for specific industries to improve accuracy and relevance, whether for creating personalized travel itineraries with NLG or for use of NLG in media and entertainment.
  • These targeted applications underscore the technology's versatility, from reducing compliance risk with NLG to optimizing supply chain reports using NLG, which are critical for modernizing how NLG improves business process automation.

What are the key market drivers leading to the rise in the adoption of Natural Language Generation Industry?

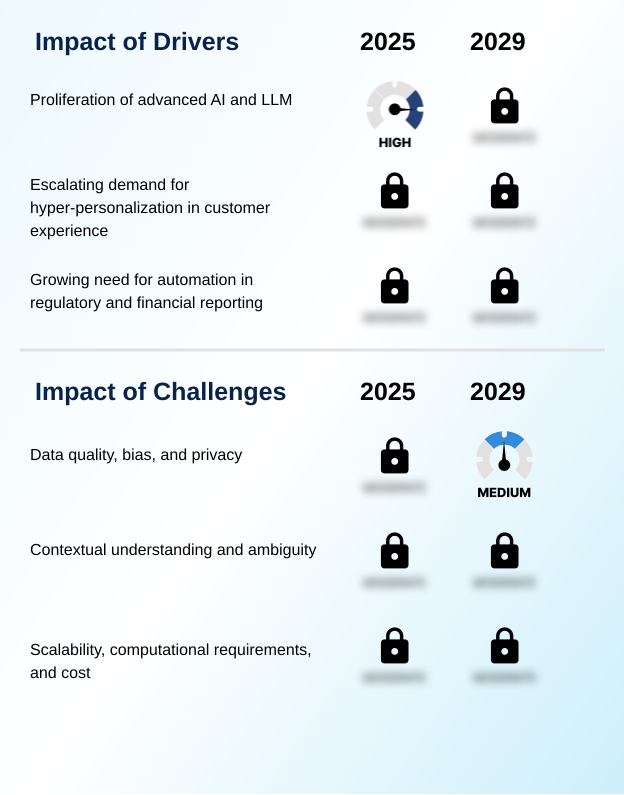
  • The proliferation of advanced AI, particularly large language models, is the fundamental driver accelerating growth and innovation within the Natural Language Generation market.

  • The market is significantly driven by the enterprise push for hyper-personalization at scale and the need for regulatory reporting automation.
  • The use of large language models for customer experience personalization allows companies to craft unique messages, with some reporting up to a 45% increase in customer engagement.
  • This capability is powered by deep neural networks that analyze user data to generate highly relevant content. Simultaneously, the demand for automation in creating financial portfolio summaries and other compliance-related documents is intensifying.
  • Businesses using natural language generation for these tasks have reduced manual reporting efforts by over 80%. This dual focus on enhancing customer interactions through conversational AI and streamlining back-office functions through report automation is fueling widespread adoption across industries.

What are the market trends shaping the Natural Language Generation Industry?

  • The Natural Language Generation market is witnessing a significant shift toward multimodal platforms that integrate text with other data formats. Concurrently, there is a growing demand for explainable AI to ensure transparency and trust in automated outputs.

  • A primary trend is the shift toward multimodal platforms and the increasing demand for explainable AI. These advanced systems are moving beyond simple text summarization to integrate visual data, enabling the generation of richer, context-aware content. The use of retrieval-augmented generation enhances factual accuracy, a critical factor for enterprise adoption where user trust is paramount.
  • Systems incorporating explainability features report up to 20% higher user acceptance rates. Concurrently, the development of domain-specific NLG models for industries like finance and healthcare is accelerating, as these models offer superior performance on specialized tasks.
  • This focus on both multimodal capabilities and model explainability is crucial for building reliable AI-powered systems that can handle complex, real-world applications in business intelligence integration and beyond.

What challenges does the Natural Language Generation Industry face during its growth?

  • Significant challenges surrounding data quality, inherent bias in training datasets, and complex privacy regulations restrain the seamless growth and adoption of Natural Language Generation technologies.

  • Key challenges center on data quality, model bias, and the high computational cost of scaling systems. The performance of any linguistic realization process is directly tied to its training data, and biased datasets can lead to skewed outcomes in over 30% of deployments, creating significant reputational risk.
  • Issues with data privacy in NLG are compounded by complex, evolving AI governance frameworks. Furthermore, the cost of training state-of-the-art models has increased exponentially, creating barriers for smaller organizations.
  • The significant computational requirements for both training and inference demand scalable AI infrastructure that remains expensive to acquire and maintain, hampering the broader democratization of advanced NLG capabilities and prompting a focus on computational cost reduction.

Exclusive Technavio Analysis on Customer Landscape

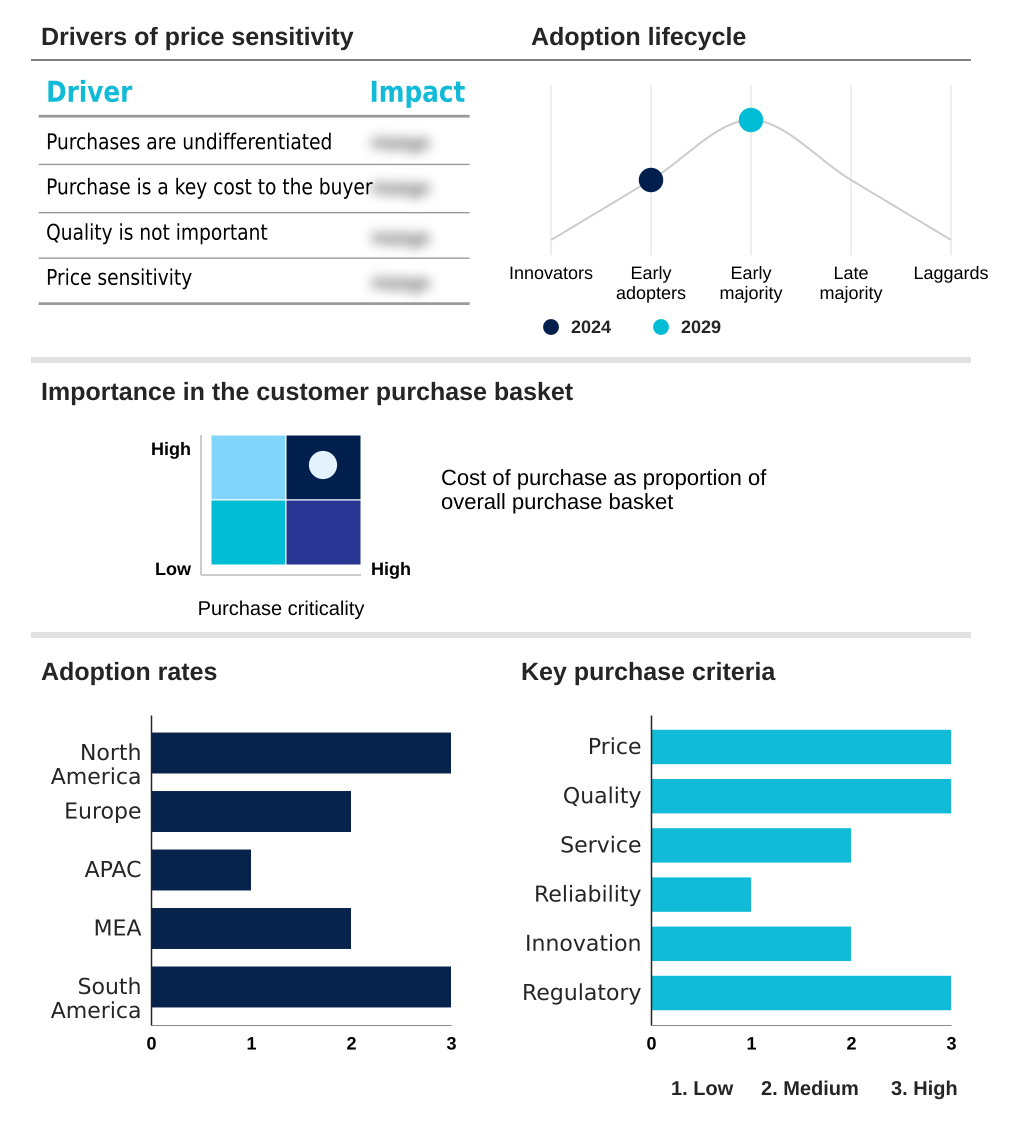
The natural language generation market forecasting report includes the adoption lifecycle of the market, covering from the innovator’s stage to the laggard’s stage. It focuses on adoption rates in different regions based on penetration. Furthermore, the natural language generation market report also includes key purchase criteria and drivers of price sensitivity to help companies evaluate and develop their market growth analysis strategies.

Customer Landscape of Natural Language Generation Industry

Competitive Landscape

Companies are implementing various strategies, such as strategic alliances, natural language generation market forecast, partnerships, mergers and acquisitions, geographical expansion, and product/service launches, to enhance their presence in the industry.

Amazon Web Services Inc. - Provides a scalable, cloud-based natural language generation platform, enabling code generation, advanced summarization, and conversational AI for enterprise applications.

The industry research and growth report includes detailed analyses of the competitive landscape of the market and information about key companies, including:

  • Amazon Web Services Inc.
  • Apple Inc.
  • ARRIA NLG Ltd.
  • AX Semantics GmbH
  • Baidu Inc.
  • Dolbey Systems Inc.
  • Google LLC
  • Hewlett Packard
  • Interactions LLC
  • IBM Corp.
  • Lexalytics Inc.
  • Meta Platforms Inc.
  • Microsoft Corp.
  • Nuance Communications Inc.
  • SAP SE
  • SAS Institute Inc.
  • Verint Systems Inc.
  • YSEOP

Qualitative and quantitative analysis of companies has been conducted to help clients understand the wider business environment as well as the strengths and weaknesses of key industry players. Data is qualitatively analyzed to categorize companies as pure play, category-focused, industry-focused, and diversified; it is quantitatively analyzed to categorize companies as dominant, leading, strong, tentative, and weak.

Recent Development and News in Natural language generation market

  • In September 2024, Yseop launched an advanced digital assistant, leveraging generative AI to automate the creation of complex clinical trial documentation for the biopharmaceutical industry.
  • In October 2024, CoRover.ai, in collaboration with a major cloud provider, introduced a generative AI platform with a focus on Indian languages to deliver more inclusive and multilingual NLG solutions.
  • In November 2024, Salesforce announced the integration of its generative AI technology into its CRM platform, enabling the automatic generation of sales emails, case summaries, and marketing content.
  • In January 2025, SAP revealed plans to embed generative AI capabilities across its entire application suite, including S/4HANA Cloud, to automate tasks like job description creation and sales order completion.

Dive into Technavio’s robust research methodology, blending expert interviews, extensive data synthesis, and validated models for unparalleled Natural Language Generation Market insights. See full methodology.

Market Scope
Page number 299
Base year 2024
Historic period 2019-2023
Forecast period 2025-2029
Growth momentum & CAGR Accelerate at a CAGR of 20.7%
Market growth 2025-2029 USD 2077.9 million
Market structure Fragmented
YoY growth 2024-2025(%) 18.5%
Key countries US, Canada, Mexico, Germany, UK, France, The Netherlands, Italy, Spain, China, Japan, India, South Korea, Australia, Indonesia, UAE, Saudi Arabia, Israel, South Africa, Turkey, Brazil, Argentina and Colombia
Competitive landscape Leading Companies, Market Positioning of Companies, Competitive Strategies, and Industry Risks

Request Free Sample

Research Analyst Overview

  • The market's evolution is defined by rapid advancements in large language models and transformer architectures, which are elevating the sophistication of data-to-text conversion. Core processes such as semantic analysis, syntactic parsing, and the tokenization process are becoming highly automated through advanced neural network models and new embedding models.
  • This facilitates more effective prompt engineering and fine-tuning models for specific use cases like report automation and question answering systems. Enterprises leveraging these technologies for compliance documentation have demonstrated a 90% reduction in reporting errors, a metric that drives boardroom-level decisions on technology investment.
  • The focus is shifting toward practical applications, including dialogue generation for customer service, real-time data narratives for operational oversight, and personalized marketing copy. As capabilities in text summarization and automated content creation mature, the technology is becoming integral to functions ranging from financial reporting automation to clinical trial reporting and product description generation.

What are the Key Data Covered in this Natural Language Generation Market Research and Growth Report?

  • What is the expected growth of the Natural Language Generation Market between 2025 and 2029?

    • USD 2.08 billion, at a CAGR of 20.7%

  • What segmentation does the market report cover?

    • The report is segmented by Component (Software, Services), Deployment (Cloud, On premise), Application (Risk and compliance management, BFSI, Healthcare, Retail and e-commerce, Media and entertainment) and Geography (North America, Europe, APAC, Middle East and Africa, South America)

  • Which regions are analyzed in the report?

    • North America, Europe, APAC, Middle East and Africa and South America

  • What are the key growth drivers and market challenges?

    • Proliferation of advanced AI and LLM, Data quality, bias, and privacy

  • Who are the major players in the Natural Language Generation Market?

    • Amazon Web Services Inc., Apple Inc., ARRIA NLG Ltd., AX Semantics GmbH, Baidu Inc., Dolbey Systems Inc., Google LLC, Hewlett Packard, Interactions LLC, IBM Corp., Lexalytics Inc., Meta Platforms Inc., Microsoft Corp., Nuance Communications Inc., SAP SE, SAS Institute Inc., Verint Systems Inc. and YSEOP

Market Research Insights

  • Market dynamics are defined by the pursuit of hyper-personalization at scale, driven by customer experience personalization and the need for more contextually aware responses in service interactions. Augmented analytics platforms now integrate natural language generation, with some achieving a 40% reduction in time-to-insight. This business intelligence integration allows for more effective data-driven storytelling.
  • The demand for regulatory reporting automation is also a major factor, as companies aim for flawless compliance. In customer service, the use of virtual assistant responses powered by sophisticated models has improved first-contact resolution rates by over 25%.
  • This push for efficiency and personalization is creating a competitive landscape where scalable AI infrastructure and effective AI governance frameworks are critical for success.

We can help! Our analysts can customize this natural language generation market research report to meet your requirements.

Get in touch

1. Executive Summary

1.1 Market overview

Executive Summary - Chart on Market Overview
Executive Summary - Data Table on Market Overview
Executive Summary - Chart on Global Market Characteristics
Executive Summary - Chart on Market by Geography
Executive Summary - Chart on Market Segmentation by Component
Executive Summary - Chart on Market Segmentation by Deployment
Executive Summary - Chart on Market Segmentation by Application
Executive Summary - Chart on Incremental Growth
Executive Summary - Data Table on Incremental Growth
Executive Summary - Chart on Company Market Positioning

2. Technavio Analysis

2.1 Analysis of price sensitivity, lifecycle, customer purchase basket, adoption rates, and purchase criteria

2.2 Criticality of inputs and Factors of differentiation

Chart on Overview on criticality of inputs and factors of differentiation

2.3 Factors of disruption

Chart on Overview on factors of disruption

2.4 Impact of drivers and challenges

Chart on Impact of drivers and challenges in 2024 and 2029

3. Market Landscape

3.1 Market ecosystem

Chart on Parent Market
Data Table on - Parent Market

3.2 Market characteristics

Chart on Market characteristics analysis

3.3 Value chain analysis

Chart on Value chain analysis

4. Market Sizing

4.1 Market definition

Data Table on Offerings of companies included in the market definition

4.2 Market segment analysis

Market segments

4.3 Market size 2024

4.4 Market outlook: Forecast for 2024-2029

Chart on Global - Market size and forecast 2024-2029 ($ million)
Data Table on Global - Market size and forecast 2024-2029 ($ million)
Chart on Global Market: Year-over-year growth 2024-2029 (%)
Data Table on Global Market: Year-over-year growth 2024-2029 (%)

5. Historic Market Size

5.1 Global Natural Language Generation Market 2019 - 2023

Historic Market Size - Data Table on Global Natural Language Generation Market 2019 - 2023 ($ million)

5.2 Component segment analysis 2019 - 2023

Historic Market Size - Component Segment 2019 - 2023 ($ million)

5.3 Deployment segment analysis 2019 - 2023

Historic Market Size - Deployment Segment 2019 - 2023 ($ million)

5.4 Application segment analysis 2019 - 2023

Historic Market Size - Application Segment 2019 - 2023 ($ million)

5.5 Geography segment analysis 2019 - 2023

Historic Market Size - Geography Segment 2019 - 2023 ($ million)

5.6 Country segment analysis 2019 - 2023

Historic Market Size - Country Segment 2019 - 2023 ($ million)

6. Five Forces Analysis

6.1 Five forces summary

Five forces analysis - Comparison between 2024 and 2029

6.2 Bargaining power of buyers

Bargaining power of buyers - Impact of key factors 2024 and 2029

6.3 Bargaining power of suppliers

Bargaining power of suppliers - Impact of key factors in 2024 and 2029

6.4 Threat of new entrants

Threat of new entrants - Impact of key factors in 2024 and 2029

6.5 Threat of substitutes

Threat of substitutes - Impact of key factors in 2024 and 2029

6.6 Threat of rivalry

Threat of rivalry - Impact of key factors in 2024 and 2029

6.7 Market condition

Chart on Market condition - Five forces 2024 and 2029

7. Market Segmentation by Component

7.1 Market segments

Chart on Component - Market share 2024-2029 (%)
Data Table on Component - Market share 2024-2029 (%)

7.2 Comparison by Component

Chart on Comparison by Component
Data Table on Comparison by Component

7.3 Software - Market size and forecast 2024-2029

Chart on Software - Market size and forecast 2024-2029 ($ million)
Data Table on Software - Market size and forecast 2024-2029 ($ million)
Chart on Software - Year-over-year growth 2024-2029 (%)
Data Table on Software - Year-over-year growth 2024-2029 (%)

7.4 Services - Market size and forecast 2024-2029

Chart on Services - Market size and forecast 2024-2029 ($ million)
Data Table on Services - Market size and forecast 2024-2029 ($ million)
Chart on Services - Year-over-year growth 2024-2029 (%)
Data Table on Services - Year-over-year growth 2024-2029 (%)

7.5 Market opportunity by Component

Market opportunity by Component ($ million)
Data Table on Market opportunity by Component ($ million)

8. Market Segmentation by Deployment

8.1 Market segments

Chart on Deployment - Market share 2024-2029 (%)
Data Table on Deployment - Market share 2024-2029 (%)

8.2 Comparison by Deployment

Chart on Comparison by Deployment
Data Table on Comparison by Deployment

8.3 Cloud - Market size and forecast 2024-2029

Chart on Cloud - Market size and forecast 2024-2029 ($ million)
Data Table on Cloud - Market size and forecast 2024-2029 ($ million)
Chart on Cloud - Year-over-year growth 2024-2029 (%)
Data Table on Cloud - Year-over-year growth 2024-2029 (%)

8.4 On premise - Market size and forecast 2024-2029

Chart on On premise - Market size and forecast 2024-2029 ($ million)
Data Table on On premise - Market size and forecast 2024-2029 ($ million)
Chart on On premise - Year-over-year growth 2024-2029 (%)
Data Table on On premise - Year-over-year growth 2024-2029 (%)

8.5 Market opportunity by Deployment

Market opportunity by Deployment ($ million)
Data Table on Market opportunity by Deployment ($ million)

9. Market Segmentation by Application

9.1 Market segments

Chart on Application - Market share 2024-2029 (%)
Data Table on Application - Market share 2024-2029 (%)

9.2 Comparison by Application

Chart on Comparison by Application
Data Table on Comparison by Application

9.3 Risk and compliance management - Market size and forecast 2024-2029

Chart on Risk and compliance management - Market size and forecast 2024-2029 ($ million)
Data Table on Risk and compliance management - Market size and forecast 2024-2029 ($ million)
Chart on Risk and compliance management - Year-over-year growth 2024-2029 (%)
Data Table on Risk and compliance management - Year-over-year growth 2024-2029 (%)

9.4 BFSI - Market size and forecast 2024-2029

Chart on BFSI - Market size and forecast 2024-2029 ($ million)
Data Table on BFSI - Market size and forecast 2024-2029 ($ million)
Chart on BFSI - Year-over-year growth 2024-2029 (%)
Data Table on BFSI - Year-over-year growth 2024-2029 (%)

9.5 Healthcare - Market size and forecast 2024-2029

Chart on Healthcare - Market size and forecast 2024-2029 ($ million)
Data Table on Healthcare - Market size and forecast 2024-2029 ($ million)
Chart on Healthcare - Year-over-year growth 2024-2029 (%)
Data Table on Healthcare - Year-over-year growth 2024-2029 (%)

9.6 Retail and e-commerce - Market size and forecast 2024-2029

Chart on Retail and e-commerce - Market size and forecast 2024-2029 ($ million)
Data Table on Retail and e-commerce - Market size and forecast 2024-2029 ($ million)
Chart on Retail and e-commerce - Year-over-year growth 2024-2029 (%)
Data Table on Retail and e-commerce - Year-over-year growth 2024-2029 (%)

9.7 Media and entertainment - Market size and forecast 2024-2029

Chart on Media and entertainment - Market size and forecast 2024-2029 ($ million)
Data Table on Media and entertainment - Market size and forecast 2024-2029 ($ million)
Chart on Media and entertainment - Year-over-year growth 2024-2029 (%)
Data Table on Media and entertainment - Year-over-year growth 2024-2029 (%)

9.8 Market opportunity by Application

Market opportunity by Application ($ million)
Data Table on Market opportunity by Application ($ million)

10. Customer Landscape

10.1 Customer landscape overview

Analysis of price sensitivity, lifecycle, customer purchase basket, adoption rates, and purchase criteria

11. Geographic Landscape

11.1 Geographic segmentation

Chart on Market share by geography 2024-2029 (%)
Data Table on Market share by geography 2024-2029 (%)

11.2 Geographic comparison

Chart on Geographic comparison
Data Table on Geographic comparison

11.3 North America - Market size and forecast 2024-2029

Chart on North America - Market size and forecast 2024-2029 ($ million)
Data Table on North America - Market size and forecast 2024-2029 ($ million)
Chart on North America - Year-over-year growth 2024-2029 (%)
Data Table on North America - Year-over-year growth 2024-2029 (%)
Chart on Regional Comparison - North America
Data Table on Regional Comparison - North America

11.3.1 US - Market size and forecast 2024-2029

Chart on US - Market size and forecast 2024-2029 ($ million)
Data Table on US - Market size and forecast 2024-2029 ($ million)
Chart on US - Year-over-year growth 2024-2029 (%)
Data Table on US - Year-over-year growth 2024-2029 (%)

11.3.2 Canada - Market size and forecast 2024-2029

Chart on Canada - Market size and forecast 2024-2029 ($ million)
Data Table on Canada - Market size and forecast 2024-2029 ($ million)
Chart on Canada - Year-over-year growth 2024-2029 (%)
Data Table on Canada - Year-over-year growth 2024-2029 (%)

11.3.3 Mexico - Market size and forecast 2024-2029

Chart on Mexico - Market size and forecast 2024-2029 ($ million)
Data Table on Mexico - Market size and forecast 2024-2029 ($ million)
Chart on Mexico - Year-over-year growth 2024-2029 (%)
Data Table on Mexico - Year-over-year growth 2024-2029 (%)

11.4 Europe - Market size and forecast 2024-2029

Chart on Europe - Market size and forecast 2024-2029 ($ million)
Data Table on Europe - Market size and forecast 2024-2029 ($ million)
Chart on Europe - Year-over-year growth 2024-2029 (%)
Data Table on Europe - Year-over-year growth 2024-2029 (%)
Chart on Regional Comparison - Europe
Data Table on Regional Comparison - Europe

11.4.1 Germany - Market size and forecast 2024-2029

Chart on Germany - Market size and forecast 2024-2029 ($ million)
Data Table on Germany - Market size and forecast 2024-2029 ($ million)
Chart on Germany - Year-over-year growth 2024-2029 (%)
Data Table on Germany - Year-over-year growth 2024-2029 (%)

11.4.2 UK - Market size and forecast 2024-2029

Chart on UK - Market size and forecast 2024-2029 ($ million)
Data Table on UK - Market size and forecast 2024-2029 ($ million)
Chart on UK - Year-over-year growth 2024-2029 (%)
Data Table on UK - Year-over-year growth 2024-2029 (%)

11.4.3 France - Market size and forecast 2024-2029

Chart on France - Market size and forecast 2024-2029 ($ million)
Data Table on France - Market size and forecast 2024-2029 ($ million)
Chart on France - Year-over-year growth 2024-2029 (%)
Data Table on France - Year-over-year growth 2024-2029 (%)

11.4.4 The Netherlands - Market size and forecast 2024-2029

Chart on The Netherlands - Market size and forecast 2024-2029 ($ million)
Data Table on The Netherlands - Market size and forecast 2024-2029 ($ million)
Chart on The Netherlands - Year-over-year growth 2024-2029 (%)
Data Table on The Netherlands - Year-over-year growth 2024-2029 (%)

11.4.5 Italy - Market size and forecast 2024-2029

Chart on Italy - Market size and forecast 2024-2029 ($ million)
Data Table on Italy - Market size and forecast 2024-2029 ($ million)
Chart on Italy - Year-over-year growth 2024-2029 (%)
Data Table on Italy - Year-over-year growth 2024-2029 (%)

11.4.6 Spain - Market size and forecast 2024-2029

Chart on Spain - Market size and forecast 2024-2029 ($ million)
Data Table on Spain - Market size and forecast 2024-2029 ($ million)
Chart on Spain - Year-over-year growth 2024-2029 (%)
Data Table on Spain - Year-over-year growth 2024-2029 (%)

11.5 APAC - Market size and forecast 2024-2029

Chart on APAC - Market size and forecast 2024-2029 ($ million)
Data Table on APAC - Market size and forecast 2024-2029 ($ million)
Chart on APAC - Year-over-year growth 2024-2029 (%)
Data Table on APAC - Year-over-year growth 2024-2029 (%)
Chart on Regional Comparison - APAC
Data Table on Regional Comparison - APAC

11.5.1 China - Market size and forecast 2024-2029

Chart on China - Market size and forecast 2024-2029 ($ million)
Data Table on China - Market size and forecast 2024-2029 ($ million)
Chart on China - Year-over-year growth 2024-2029 (%)
Data Table on China - Year-over-year growth 2024-2029 (%)

11.5.2 Japan - Market size and forecast 2024-2029

Chart on Japan - Market size and forecast 2024-2029 ($ million)
Data Table on Japan - Market size and forecast 2024-2029 ($ million)
Chart on Japan - Year-over-year growth 2024-2029 (%)
Data Table on Japan - Year-over-year growth 2024-2029 (%)

11.5.3 India - Market size and forecast 2024-2029

Chart on India - Market size and forecast 2024-2029 ($ million)
Data Table on India - Market size and forecast 2024-2029 ($ million)
Chart on India - Year-over-year growth 2024-2029 (%)
Data Table on India - Year-over-year growth 2024-2029 (%)

11.5.4 South Korea - Market size and forecast 2024-2029

Chart on South Korea - Market size and forecast 2024-2029 ($ million)
Data Table on South Korea - Market size and forecast 2024-2029 ($ million)
Chart on South Korea - Year-over-year growth 2024-2029 (%)
Data Table on South Korea - Year-over-year growth 2024-2029 (%)

11.5.5 Australia - Market size and forecast 2024-2029

Chart on Australia - Market size and forecast 2024-2029 ($ million)
Data Table on Australia - Market size and forecast 2024-2029 ($ million)
Chart on Australia - Year-over-year growth 2024-2029 (%)
Data Table on Australia - Year-over-year growth 2024-2029 (%)

11.5.6 Indonesia - Market size and forecast 2024-2029

Chart on Indonesia - Market size and forecast 2024-2029 ($ million)
Data Table on Indonesia - Market size and forecast 2024-2029 ($ million)
Chart on Indonesia - Year-over-year growth 2024-2029 (%)
Data Table on Indonesia - Year-over-year growth 2024-2029 (%)

11.6 Middle East and Africa - Market size and forecast 2024-2029

Chart on Middle East and Africa - Market size and forecast 2024-2029 ($ million)
Data Table on Middle East and Africa - Market size and forecast 2024-2029 ($ million)
Chart on Middle East and Africa - Year-over-year growth 2024-2029 (%)
Data Table on Middle East and Africa - Year-over-year growth 2024-2029 (%)
Chart on Regional Comparison - Middle East and Africa
Data Table on Regional Comparison - Middle East and Africa

11.6.1 UAE - Market size and forecast 2024-2029

Chart on UAE - Market size and forecast 2024-2029 ($ million)
Data Table on UAE - Market size and forecast 2024-2029 ($ million)
Chart on UAE - Year-over-year growth 2024-2029 (%)
Data Table on UAE - Year-over-year growth 2024-2029 (%)

11.6.2 Saudi Arabia - Market size and forecast 2024-2029

Chart on Saudi Arabia - Market size and forecast 2024-2029 ($ million)
Data Table on Saudi Arabia - Market size and forecast 2024-2029 ($ million)
Chart on Saudi Arabia - Year-over-year growth 2024-2029 (%)
Data Table on Saudi Arabia - Year-over-year growth 2024-2029 (%)

11.6.3 Israel - Market size and forecast 2024-2029

Chart on Israel - Market size and forecast 2024-2029 ($ million)
Data Table on Israel - Market size and forecast 2024-2029 ($ million)
Chart on Israel - Year-over-year growth 2024-2029 (%)
Data Table on Israel - Year-over-year growth 2024-2029 (%)

11.6.4 South Africa - Market size and forecast 2024-2029

Chart on South Africa - Market size and forecast 2024-2029 ($ million)
Data Table on South Africa - Market size and forecast 2024-2029 ($ million)
Chart on South Africa - Year-over-year growth 2024-2029 (%)
Data Table on South Africa - Year-over-year growth 2024-2029 (%)

11.6.5 Turkey - Market size and forecast 2024-2029

Chart on Turkey - Market size and forecast 2024-2029 ($ million)
Data Table on Turkey - Market size and forecast 2024-2029 ($ million)
Chart on Turkey - Year-over-year growth 2024-2029 (%)
Data Table on Turkey - Year-over-year growth 2024-2029 (%)

11.7 South America - Market size and forecast 2024-2029

Chart on South America - Market size and forecast 2024-2029 ($ million)
Data Table on South America - Market size and forecast 2024-2029 ($ million)
Chart on South America - Year-over-year growth 2024-2029 (%)
Data Table on South America - Year-over-year growth 2024-2029 (%)
Chart on Regional Comparison - South America
Data Table on Regional Comparison - South America

11.7.1 Brazil - Market size and forecast 2024-2029

Chart on Brazil - Market size and forecast 2024-2029 ($ million)
Data Table on Brazil - Market size and forecast 2024-2029 ($ million)
Chart on Brazil - Year-over-year growth 2024-2029 (%)
Data Table on Brazil - Year-over-year growth 2024-2029 (%)

11.7.2 Argentina - Market size and forecast 2024-2029

Chart on Argentina - Market size and forecast 2024-2029 ($ million)
Data Table on Argentina - Market size and forecast 2024-2029 ($ million)
Chart on Argentina - Year-over-year growth 2024-2029 (%)
Data Table on Argentina - Year-over-year growth 2024-2029 (%)

11.7.3 Colombia - Market size and forecast 2024-2029

Chart on Colombia - Market size and forecast 2024-2029 ($ million)
Data Table on Colombia - Market size and forecast 2024-2029 ($ million)
Chart on Colombia - Year-over-year growth 2024-2029 (%)
Data Table on Colombia - Year-over-year growth 2024-2029 (%)

11.8 Market opportunity by geography

Market opportunity by geography ($ million)
Data Tables on Market opportunity by geography ($ million)

12. Drivers, Challenges, and Opportunity

12.1 Market drivers

Proliferation of advanced AI and LLM
Escalating demand for hyper-personalization in customer experience
Growing need for automation in regulatory and financial reporting

12.2 Market challenges

Data quality, bias, and privacy
Contextual understanding and ambiguity
Scalability, computational requirements, and cost

12.3 Impact of drivers and challenges

Impact of drivers and challenges in 2024 and 2029

12.4 Market opportunities

Emergence of multimodal and explainable NLG
Hyper-personalization at scale fueled by large language models
Deep integration of NLG within business intelligence and analytics platforms

13. Competitive Landscape

13.1 Overview

13.2

Overview on criticality of inputs and factors of differentiation

13.3 Landscape disruption

Overview on factors of disruption

13.4 Industry risks

Impact of key risks on business

14. Competitive Analysis

14.1 Companies profiled

Companies covered

14.2 Company ranking index

14.3 Market positioning of companies

Matrix on companies position and classification

14.4 Amazon Web Services Inc.

Amazon Web Services Inc. - Overview
Amazon Web Services Inc. - Product / Service
Amazon Web Services Inc. - Key news
Amazon Web Services Inc. - Key offerings
SWOT

14.5 Apple Inc.

Apple Inc. - Overview
Apple Inc. - Business segments
Apple Inc. - Key news
Apple Inc. - Key offerings
Apple Inc. - Segment focus
SWOT

14.6 Baidu Inc.

Baidu Inc. - Overview
Baidu Inc. - Business segments
Baidu Inc. - Key offerings
Baidu Inc. - Segment focus
SWOT

14.7 Dolbey Systems Inc.

Dolbey Systems Inc. - Overview
Dolbey Systems Inc. - Product / Service
Dolbey Systems Inc. - Key offerings
SWOT

14.8 Google LLC

Google LLC - Overview
Google LLC - Product / Service
Google LLC - Key offerings
SWOT

14.9 Hewlett Packard

Hewlett Packard - Overview
Hewlett Packard - Business segments
Hewlett Packard - Key news
Hewlett Packard - Key offerings
Hewlett Packard - Segment focus
SWOT

14.10 Interactions LLC

Interactions LLC - Overview
Interactions LLC - Product / Service
Interactions LLC - Key offerings
SWOT

14.11 IBM Corp.

IBM Corp. - Overview
IBM Corp. - Business segments
IBM Corp. - Key news
IBM Corp. - Key offerings
IBM Corp. - Segment focus
SWOT

14.12 Lexalytics Inc.

Lexalytics Inc. - Overview
Lexalytics Inc. - Product / Service
Lexalytics Inc. - Key offerings
SWOT

14.13 Meta Platforms Inc.

Meta Platforms Inc. - Overview
Meta Platforms Inc. - Business segments
Meta Platforms Inc. - Key offerings
Meta Platforms Inc. - Segment focus
SWOT

14.14 Microsoft Corp.

Microsoft Corp. - Overview
Microsoft Corp. - Business segments
Microsoft Corp. - Key news
Microsoft Corp. - Key offerings
Microsoft Corp. - Segment focus
SWOT

14.15 Nuance Communications Inc.

Nuance Communications Inc. - Overview
Nuance Communications Inc. - Product / Service
Nuance Communications Inc. - Key offerings
SWOT

14.16 SAP SE

SAP SE - Overview
SAP SE - Business segments
SAP SE - Key news
SAP SE - Key offerings
SAP SE - Segment focus
SWOT

14.17 SAS Institute Inc.

SAS Institute Inc. - Overview
SAS Institute Inc. - Product / Service
SAS Institute Inc. - Key news
SAS Institute Inc. - Key offerings
SWOT

14.18 Verint Systems Inc.

Verint Systems Inc. - Overview
Verint Systems Inc. - Product / Service
Verint Systems Inc. - Key offerings
SWOT

15. Appendix

15.1 Scope of the report

Market definition
Objectives
Notes and caveats

15.2 Inclusions and exclusions checklist

Inclusions checklist
Exclusions checklist

15.3 Currency conversion rates for US$

15.4 Research methodology

15.5 Data procurement

Information sources

15.6 Data validation

15.7 Validation techniques employed for market sizing

15.8 Data synthesis

15.9 360 degree market analysis

15.10 List of abbreviations

Research Methodology

Technavio presents a detailed picture of the market by way of study, synthesis, and summation of data from multiple sources. The analysts have presented the various facets of the market with a particular focus on identifying the key industry influencers. The data thus presented is comprehensive, reliable, and the result of extensive research, both primary and secondary.

INFORMATION SOURCES

Primary sources

  • Manufacturers and suppliers
  • Channel partners
  • Industry experts
  • Strategic decision makers

Secondary sources

  • Industry journals and periodicals
  • Government data
  • Financial reports of key industry players
  • Historical data
  • Press releases

DATA ANALYSIS

Data Synthesis

  • Collation of data
  • Estimation of key figures
  • Analysis of derived insights

Data Validation

  • Triangulation with data models
  • Reference against proprietary databases
  • Corroboration with industry experts

REPORT WRITING

Qualitative

  • Market drivers
  • Market challenges
  • Market trends
  • Five forces analysis

Quantitative

  • Market size and forecast
  • Market segmentation
  • Geographical insights
  • Competitive landscape

Interested in this report?

Get your sample now to see our research methodology and insights!

Download Now

Frequently Asked Questions

Natural Language Generation market growth will increase by USD 2077.9 million during 2025-2029.

The Natural Language Generation market is expected to grow at a CAGR of 20.7% during 2025-2029.

Natural Language Generation market is segmented by Component (Software, Services) Deployment (Cloud, On premise) Application (Risk and compliance management, BFSI, Healthcare, Retail and e-commerce, Media and entertainment)

Amazon Web Services Inc., Apple Inc., ARRIA NLG Ltd., AX Semantics GmbH, Baidu Inc., Dolbey Systems Inc., Google LLC, Hewlett Packard, Interactions LLC, IBM Corp., Lexalytics Inc., Meta Platforms Inc., Microsoft Corp., Nuance Communications Inc., SAP SE, SAS Institute Inc., Verint Systems Inc., YSEOP are a few of the key vendors in the Natural Language Generation market.

North America will register the highest growth rate of 36.8% among the other regions. Therefore, the Natural Language Generation market in North America is expected to garner significant business opportunities for the vendors during the forecast period.

US, Canada, Mexico, Germany, UK, France, The Netherlands, Italy, Spain, China, Japan, India, South Korea, Australia, Indonesia, UAE, Saudi Arabia, Israel, South Africa, Turkey, Brazil, Argentina, Colombia

  • Proliferation of advanced AI and LLM is the driving factor this market.

The Natural Language Generation market vendors should focus on grabbing business opportunities from the Component segment as it accounted for the largest market share in the base year.