
Generative AI In Coding Market Size 2025-2029
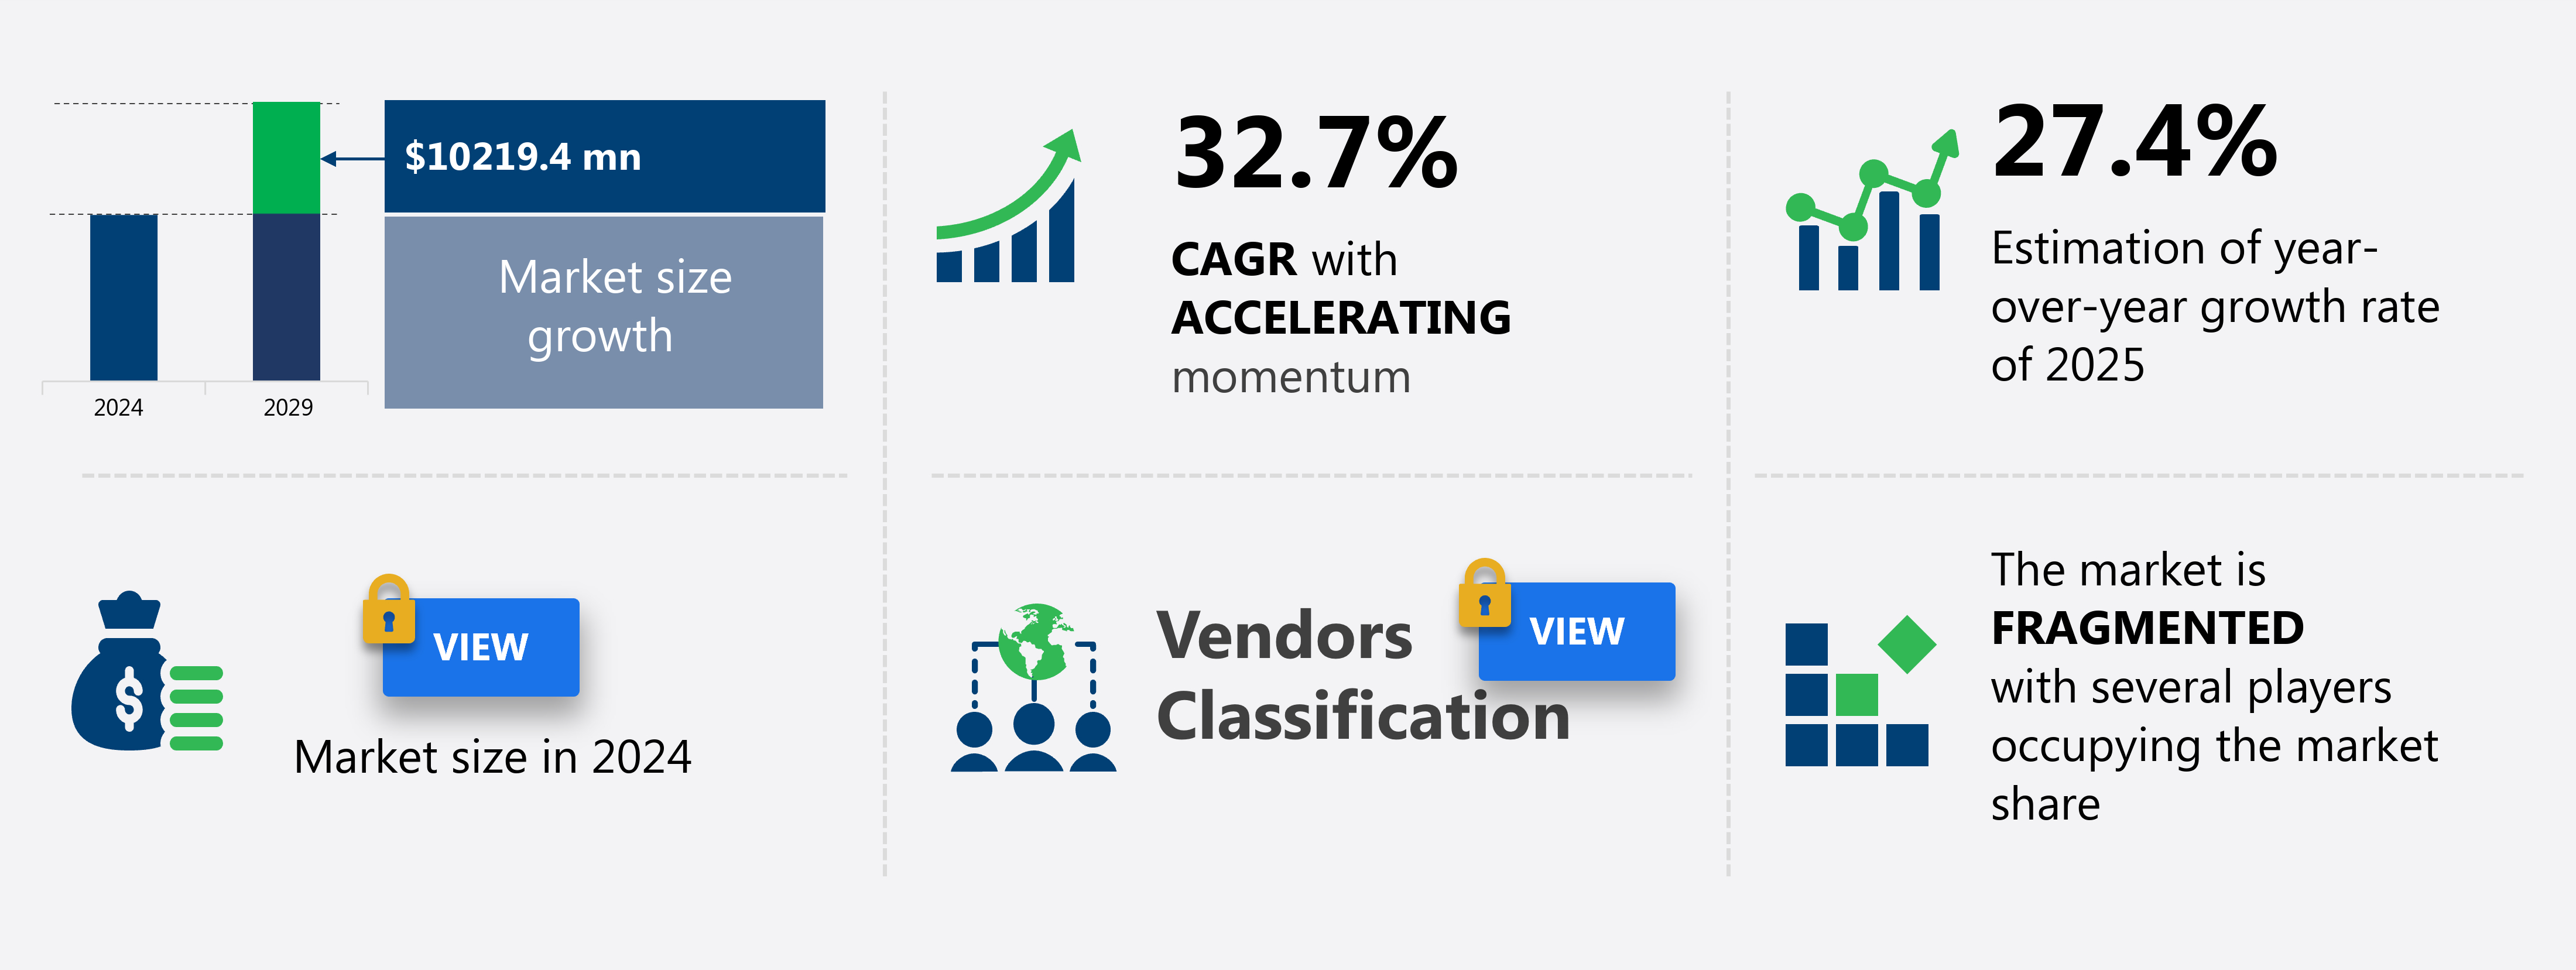
The generative AI in coding market size is forecast to increase by USD 10.22 billion, at a CAGR of 32.7% between 2024 and 2029.
- The market is experiencing significant growth, driven by the increasing demand for increased developer productivity and accelerated innovation cycles. Companies are recognizing the potential of generative AI to automate coding tasks, reducing the time and effort required for software development. However, this shift towards AI-driven coding is not without challenges. Navigating concerns of security, accuracy, and intellectual property are key obstacles in the adoption of generative AI in coding. Ensuring the security of code generated by AI is essential, as any vulnerabilities could lead to significant risks. Semantic reasoning and predictive analytics are transforming decision making, while AI-powered chatbots and virtual assistants enhance customer service.
- Lastly, addressing intellectual property concerns is necessary to ensure ownership and control over the generated code. As the market continues to evolve, companies must adapt to these challenges and focus on integrating generative AI into enterprise platforms rather than relying on individual tools. By doing so, they can mitigate risks, improve efficiency, and drive innovation in their software development processes. Overall, the market presents significant opportunities for businesses seeking to streamline their development processes and stay competitive in the rapidly evolving tech landscape. Real-time anomaly detection and latency reduction techniques are critical for maintaining the reliability and accuracy of these systems.
What will be the Size of the Generative AI In Coding Market during the forecast period?
Explore in-depth regional segment analysis with market size data - historical 2019-2023 and forecasts 2025-2029 - in the full report.
Request Free Sample
The market for generative AI in coding continues to evolve, with applications spanning various sectors including finance, healthcare, and manufacturing. Deployment scalability and model performance benchmarking are critical factors as organizations seek to optimize their AI models. Training dataset size plays a significant role in model accuracy, with larger datasets often leading to improved results. Ethical AI considerations, such as model explainability and fairness metrics, are increasingly important as AI becomes more prevalent in business operations. One example of the market's dynamic nature can be seen in the use of code readability assessment and accuracy measurements in software development. Model bias, data privacy, and data security remain critical concerns.
By analyzing code complexity and vulnerability detection, organizations can improve code quality and reduce the risk of security flaws. Neural network training and model fine-tuning are ongoing processes, with AI models requiring continuous updates to maintain optimal performance. According to recent industry reports, the generative AI market in coding is expected to grow by over 25% annually in the coming years, driven by advancements in explainable AI, bias mitigation strategies, and the increasing demand for more efficient and accurate coding solutions. Additionally, techniques such as data augmentation, AUC calculation, and ROC curve analysis are becoming increasingly important for improving model performance and reducing the need for large training datasets.
How is this Generative AI In Coding Market segmented?
The generative AI in coding market research report provides comprehensive data (region-wise segment analysis), with forecasts and estimates in "USD million" for the period 2025-2029, as well as historical data from 2019-2023 for the following segments.
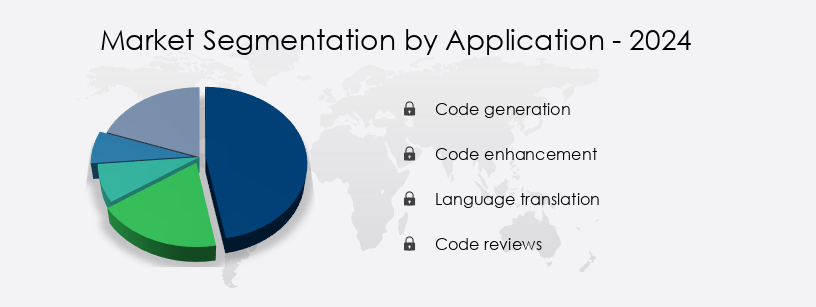
- Application
- Code generation
- Code enhancement
- Language translation
- Code reviews
- End-user
- Data science and analytics
- Web and application development
- Game development and design
- IoT and smart devices
- Others
- Type
- Python
- JavaScript
- Java
- Others
- Geography
- North America
- US
- Canada
- Mexico
- Europe
- France
- Germany
- UK
- APAC
- China
- India
- Japan
- South Korea
- Rest of World (ROW)
- North America
By Application Insights
The Code generation segment is estimated to witness significant growth during the forecast period. The market is witnessing significant advancements in automating software development processes. Code generation AI, a key segment, automates the creation of new source code from user inputs, addressing the time-consuming aspect of writing boilerplate or repetitive code. This technology has evolved from simple code completions to generating complex functions, classes, and even entire application scaffolds. Integration with version control systems and IDEs, such as GitHub Copilot, enhances developer productivity. Program synthesis and contextual code awareness enable AI-assisted coding, while testing frameworks and automated code review ensure software quality. Deep learning algorithms power predictive coding and code optimization, and natural language processing facilitates intelligent code search.
The Generative AI in Coding Market is advancing rapidly with the adoption of data augmentation techniques to improve training models and ensure interpretable code. Addressing code security flaws and tracking code quality metrics are critical for development. Tools now offer code complexity analysis and promote software maintainability through AI-driven insights. Key innovations include AI bias detection, precision and recall, and F-score evaluation to measure model performance. Efficient use of computational resources and enhanced inference speed ensure faster results. Developers benefit from code completion tools, software development AI, and version control integration, including GitHub Copilot integration. Enhanced API integration AI, prompt engineering, software testing AI, and code refactoring AI streamline workflows, making AI essential in modern coding environments.
The market is expected to grow at a rate of 25% annually, driven by the increasing demand for faster development cycles and improved code quality. For instance, a study shows that developers using code generation AI save an average of 2 hours per day, significantly increasing productivity. For instance, in the retail industry, AI-powered automation and conversational AI have led to a 15% increase in sales through personalized customer interactions.
Get a glance at the market share of various segments Request Free Sample
Regional Analysis
North America is estimated to contribute 38% to the growth of the global market during the forecast period. Technavio's analysts have elaborately explained the regional trends and drivers that shape the market during the forecast period.
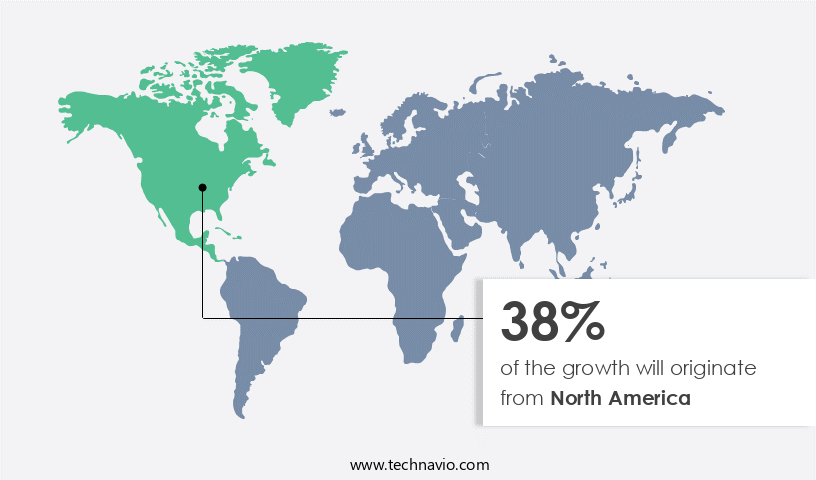
In the market, North America, specifically the United States, leads the charge. Home to tech giants, research institutions, and venture capitalists, this region sets the pace for innovation. Consequently, North America boasts the highest market maturity, fastest adoption rates, and fiercest competition. Microsoft's launch of GitHub Copilot Enterprise, an AI coding solution tailored for enterprise security and customization, underscores this trend. The market's evolution is marked by the integration of advanced technologies such as version control systems, code generation AI, developer productivity tools, program synthesis, testing frameworks, automated code review, and AI-powered IDEs. These solutions employ deep learning algorithms, natural language processing, and transformer networks to facilitate AI-assisted coding, contextual code awareness, and predictive coding.
Furthermore, they offer multi-language support, code optimization AI, semantic code understanding, and code debugging AI. The market is expected to grow by 30% annually, driven by the increasing demand for efficient software development and the integration of AI into various aspects of the development process. This growth is fueled by the adoption of reinforcement learning, large language models, and code style enforcement, as well as the integration of API and code documentation AI. Additionally, deployment automation and code security analysis are becoming increasingly important as companies prioritize the security and reliability of their software. Data security and privacy remain paramount, with cloud computing and edge computing solutions offering secure alternatives.
Market Dynamics
Our researchers analyzed the data with 2024 as the base year, along with the key drivers, trends, and challenges. A holistic analysis of drivers will help companies refine their marketing strategies to gain a competitive advantage. The market is experiencing rapid growth as businesses seek to enhance software development efficiency and quality. One of the most promising applications of AI in coding is the use of advanced models for code performance improvement. These AI models, which include large language model code completion and transformer network architecture for code, leverage natural language processing and deep learning algorithms to generate optimized code. Another significant application of AI in coding is the use of reinforcement learning for code debugging. By learning from past errors and suggested corrections, these systems can help developers identify and resolve issues more effectively.
AI-powered code review systems, which integrate intelligent code search and retrieval systems and AI-assisted code documentation generation, enable more efficient and accurate code reviews. Additionally, AI is being used to automate code refactoring techniques, ensuring consistent code style and reducing the risk of errors. AI-driven code security vulnerability detection systems help identify potential threats and ensure code compliance with security standards. Generative AI models for code optimization and predictive coding models for software development provide valuable insights and recommendations to developers. Semantic code understanding using AI and contextual code awareness in AI-powered IDEs enable more effective development in multiple programming languages.
AI-driven software testing frameworks and deployment automation with AI assistance streamline the software development lifecycle. Furthermore, bias mitigation in AI-driven code generation is a critical consideration to ensure fairness and inclusivity in software development. Overall, the market offers numerous benefits, from improved code performance to increased efficiency and accuracy in software development.
What are the key market drivers leading to the rise in the adoption of Generative AI In Coding Industry?
- The imperative need for enhancing developer productivity and shortening innovation cycles is the primary market driver, as professional expertise and knowledge demand efficient processes. In the dynamic global market for generative AI in coding, businesses seek to enhance developer productivity and compress software innovation cycles. The demand for rapid software development and deployment is a critical competitive advantage in today's digital economy. However, organizations face a persistent talent crunch in software engineering, which stifles growth and innovation.
- According to recent industry reports, the market is expected to grow by over 25% annually, underscoring its increasing importance. For instance, a leading technology firm reported a 30% increase in developer productivity after implementing a generative AI coding assistant. Machine learning, computer vision, speech recognition, and image recognition are integral components of cloud AI, driving innovation in various sectors. Generative AI coding assistants emerge as a potent solution, acting as a force multiplier for development teams. These tools automate repetitive tasks, such as writing boilerplate code, generating unit tests, creating documentation, and refactoring legacy systems.
What are the market trends shaping the Generative AI In Coding Industry?
- Shifting from individual tools to integrated enterprise platforms is becoming a mandated trend in the market. This transition prioritizes streamlined solutions for businesses. The market is experiencing a significant shift from individual developer-focused tools to enterprise-grade platforms. While early adoption was driven by personal productivity gains, large organizations are now implementing this technology at scale. This transition is fueled by stringent enterprise requirements, including robust security protocols, data privacy controls, and IP indemnification.
- This rise in enterprise adoption underscores the increasing importance of integrating generative AI into the development process to improve efficiency, reduce errors, and enhance overall software quality. Despite the challenges, the market's future looks promising, with expectations of continued growth and innovation in this burgeoning field. According to recent studies, the market for generative AI in coding is expected to grow by 25% in the next year, with enterprises accounting for a growing share of the market.
What challenges does the Generative AI In Coding Industry face during its growth?
- Addressing complex concerns around security, accuracy, and intellectual property protection remains a key challenge hindering growth and trust within the industry. The market faces a tripartite challenge of ensuring security, accuracy, and intellectual property rights. These issues pose significant barriers to enterprise adoption, creating a complex risk landscape for both users and providers. Security concerns are particularly pressing, as generative AI models are trained on extensive datasets of public code, including questionable open source repositories. This exposure can lead to models inadvertently learning and replicating insecure coding practices, potentially generating code with subtle vulnerabilities, such as injection attacks, improper error handling, or the utilization of outdated and insecure cryptographic libraries.
- For instance, a study revealed that 60% of open source libraries used in enterprise applications contain at least one known vulnerability. With the generative AI coding market projected to grow by 30% annually, addressing these challenges is crucial for market expansion and enterprise success.
Exclusive Customer Landscape
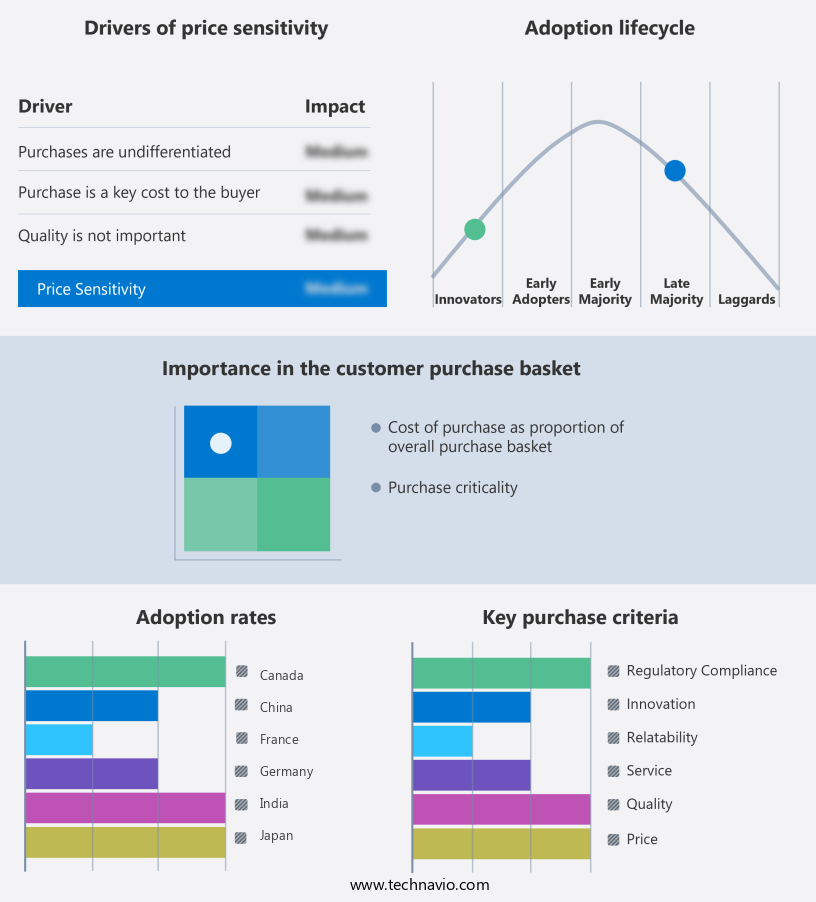
The generative AI in coding market forecasting report includes the adoption lifecycle of the market, covering from the innovator's stage to the laggard's stage. It focuses on adoption rates in different regions based on penetration. Furthermore, the generative AI in coding market report also includes key purchase criteria and drivers of price sensitivity to help companies evaluate and develop their market growth analysis strategies.
Customer Landscape
Key Companies & Market Insights
Companies are implementing various strategies, such as strategic alliances, generative ai in coding market forecast, partnerships, mergers and acquisitions, geographical expansion, and product/service launches, to enhance their presence in the industry.
Adobe Inc. - The company specializes in generative AI for coding and integrates Firefly-powered generative AI technology into Creative Cloud applications, enabling coders to streamline workflows and enhance coding efficiency.
The industry research and growth report includes detailed analyses of the competitive landscape of the market and information about key companies, including:
- Adobe Inc.
- Amazon.com Inc.
- Anthropic
- Anysphere
- Cohere
- Databricks Inc.
- Google LLC
- Hugging Face
- International Business Machines Corp.
- Jasper AI Inc.
- Microsoft Corp.
- Midjourney
- NVIDIA Corp.
- OpenAI
- Oracle Corp.
- Rephrase AI
- Salesforce Inc.
- SAP SE
- ServiceNow Inc.
- Stability AI
- Synthesia Ltd.
Qualitative and quantitative analysis of companies has been conducted to help clients understand the wider business environment as well as the strengths and weaknesses of key industry players. Data is qualitatively analyzed to categorize companies as pure play, category-focused, industry-focused, and diversified; it is quantitatively analyzed to categorize companies as dominant, leading, strong, tentative, and weak.
Recent Development and News in Generative AI In Coding Market
- In January 2024, Microsoft announced the general availability of "Codex," an AI-powered coding companion that assists developers in writing code more efficiently. Codex, integrated into Visual Studio Code, uses deep learning models to understand coding patterns and suggests completions in real-time (Microsoft Press Release, 2024).
- In March 2024, IBM and Google Cloud formed a partnership to integrate IBM's Watson AI into Google Cloud's CodeAI, creating a powerful generative AI tool for developers. This collaboration aimed to enhance the capabilities of CodeAI and provide more accurate and contextually relevant code suggestions (IBM Press Release, 2024).
- In May 2024, OpenAI, the leading AI research laboratory, secured a USD 100 million investment from Microsoft, Sutter Hill Ventures, and other investors. This funding round was dedicated to further developing and commercializing OpenAI's generative AI technologies, including its groundbreaking coding AI, Copilot (OpenAI Press Release, 2024).
- In April 2025, Amazon Web Services (AWS) launched "DeepCode AI," a generative AI tool that provides real-time code reviews and suggestions for developers. DeepCode AI uses machine learning models to analyze code and suggest improvements, making it a valuable addition to AWS's developer tools suite (AWS Press Release, 2025).
Research Analyst Overview
The market for generative AI in coding continues to evolve, with applications spanning various sectors including finance, healthcare, and manufacturing. Deployment scalability and model performance benchmarking are critical factors as organizations seek to optimize their AI models. Training dataset size plays a significant role in model accuracy, with larger datasets often leading to improved results. Ethical AI considerations, such as model explainability and fairness metrics, are increasingly important as AI becomes more prevalent in business operations. One example of the market's dynamic nature can be seen in the use of code readability assessment and accuracy measurements in software development. Machine learning models, feature engineering methods, and data integration strategies are employed for ai-driven insights generation.
The Generative AI in Coding Market is transforming software development with enhanced AI code generation model performance and the integration of natural language processing in software development for intuitive coding. Innovations in deep learning algorithms for code synthesis and AI-powered code review system integration are streamlining quality assurance. Developers benefit from automated code refactoring techniques and code style enforcement using AI, ensuring consistent and maintainable codebases. Security is strengthened through AI for code security vulnerability detection, while efficiency improves with a generative AI model for code optimization. Expanding multilanguage support in AI code generation allows broader application across tech stacks. Additionally, the implementation of an AI-driven software testing framework enables faster and more accurate validation, advancing productivity across development lifecycles.
By analyzing code complexity and vulnerability detection, organizations can improve code quality and reduce the risk of security flaws. Neural network training and model fine-tuning are ongoing processes, with AI models requiring continuous updates to maintain optimal performance. According to recent industry reports, the generative AI market in coding is expected to grow by over 25% annually in the coming years, driven by advancements in explainable AI, bias mitigation strategies, and the increasing demand for more efficient and accurate coding solutions. Additionally, techniques such as data augmentation, AUC calculation, and ROC curve analysis are becoming increasingly important for improving model performance and reducing the need for large training datasets.
Dive into Technavio's robust research methodology, blending expert interviews, extensive data synthesis, and validated models for unparalleled Generative AI In Coding Market insights. See full methodology.
|
Market Scope |
|
|
Report Coverage |
Details |
|
Page number |
242 |
|
Base year |
2024 |
|
Historic period |
2019-2023 |
|
Forecast period |
2025-2029 |
|
Growth momentum & CAGR |
Accelerate at a CAGR of 32.7% |
|
Market growth 2025-2029 |
USD 10.22 billion |
|
Market structure |
Fragmented |
|
YoY growth 2024-2025(%) |
27.4 |
|
Key countries |
US, Canada, Mexico, China, Japan, South Korea, India, Germany, UK, and France |
|
Competitive landscape |
Leading Companies, Market Positioning of Companies, Competitive Strategies, and Industry Risks |
What are the Key Data Covered in this Generative AI In Coding Market Research and Growth Report?
- CAGR of the Generative AI In Coding industry during the forecast period
- Detailed information on factors that will drive the growth and forecasting between 2025 and 2029
- Precise estimation of the size of the market and its contribution of the industry in focus to the parent market
- Accurate predictions about upcoming growth and trends and changes in consumer behaviour
- Growth of the market across North America, APAC, Europe, Middle East and Africa, and South America
- Thorough analysis of the market's competitive landscape and detailed information about companies
- Comprehensive analysis of factors that will challenge the generative AI in coding market growth of industry companies
We can help! Our analysts can customize this generative AI in coding market research report to meet your requirements.
 RIA -
RIA - 
