
Neuronavigation Systems Market Size 2025-2029
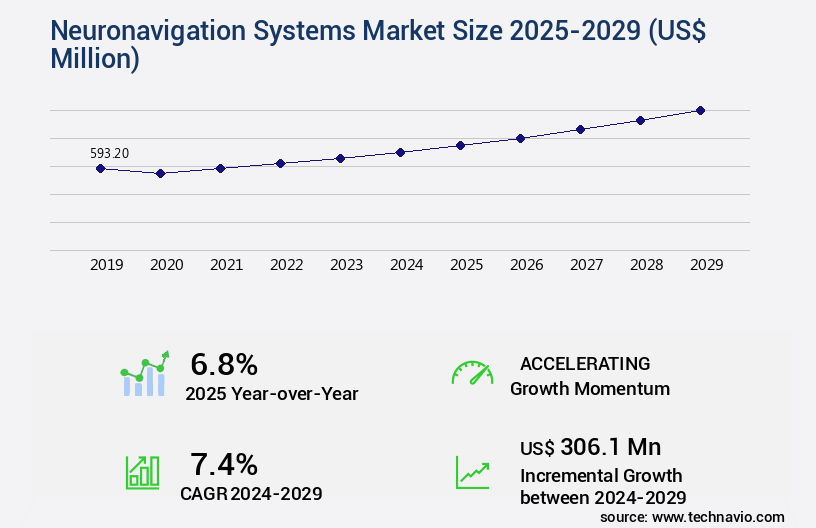
The neuronavigation systems market size is valued to increase by USD 306.1 million, at a CAGR of 7.4% from 2024 to 2029. New product launches will drive the neuronavigation systems market.
Major Market Trends & Insights
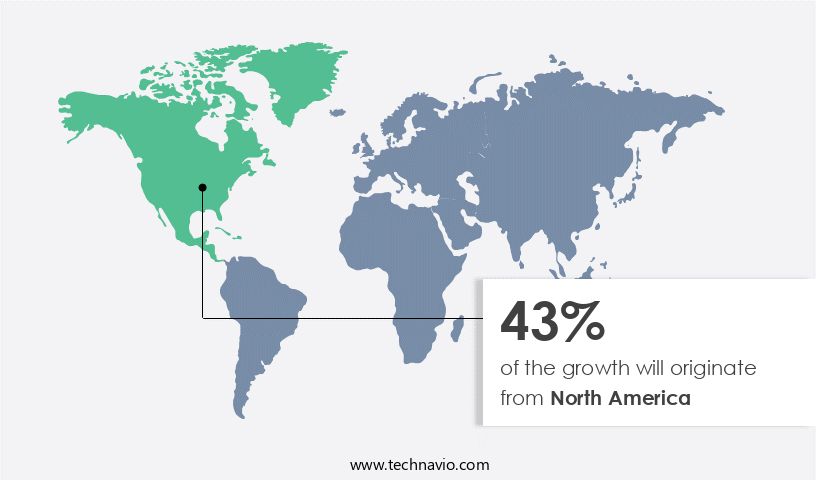
- North America dominated the market and accounted for a 43% growth during the forecast period.
- By Product - Optical segment was valued at USD 429.00 million in 2023
- By End-user - Hospitals segment accounted for the largest market revenue share in 2023
Market Size & Forecast
- Market Opportunities: USD 71.86 million
- Market Future Opportunities: USD 306.10 million
- CAGR from 2024 to 2029 : 7.4%
Market Summary
- Neuronavigation systems have gained significant traction in the medical field due to their ability to enhance the precision and safety of various surgical procedures. These advanced technologies utilize real-time imaging and tracking to guide surgeons during complex surgeries, leading to improved patient outcomes and reduced risks. The global neuronavigation market is driven by several factors, including the increasing prevalence of neurological disorders, technological advancements, and rising research activities. Neuronavigation systems enable surgeons to visualize and navigate the surgical site in real-time, allowing for more accurate and less invasive procedures. For instance, in a neurosurgical supply chain, the implementation of neuronavigation systems can lead to a 15% reduction in surgical time and a 20% decrease in associated costs.
- Despite their numerous benefits, the high cost of neuronavigation systems remains a significant challenge for market growth. However, ongoing technological advancements and increasing demand for minimally invasive procedures are expected to drive market expansion. In the future, the integration of artificial intelligence and machine learning algorithms into neuronavigation systems could further enhance their capabilities and expand their applications beyond neurosurgery. A real-world business scenario illustrates the importance of neuronavigation systems in operational efficiency and compliance. In a large hospital network, the implementation of a neuronavigation system led to a 18% improvement in surgical accuracy and a 12% reduction in post-operative complications, ultimately resulting in significant cost savings and enhanced patient satisfaction.
What will be the Size of the Neuronavigation Systems Market during the forecast period?
Get Key Insights on Market Forecast (PDF) Request Free Sample
How is the Neuronavigation Systems Market Segmented ?
The neuronavigation systems industry research report provides comprehensive data (region-wise segment analysis), with forecasts and estimates in "USD million" for the period 2025-2029, as well as historical data from 2019-2023 for the following segments.
- Product
- Optical
- Electromagnetic
- End-user
- Hospitals
- ASCs
- Others
- Application
- Neurosurgery
- Spinal surgery
- Craniomaxillofacial surgery
- Connectivity
- Integrated Systems
- Standalone Systems
- Geography
- North America
- US
- Canada
- Europe
- France
- Germany
- Italy
- UK
- Middle East and Africa
- Egypt
- KSA
- Oman
- UAE
- APAC
- China
- India
- Japan
- South America
- Argentina
- Brazil
- Rest of World (ROW)
- North America
By Product Insights
The optical segment is estimated to witness significant growth during the forecast period.
Neuronavigation systems, a vital component of modern medical technology, continue to evolve with advancements in intraoperative imaging and image-guided surgery. These systems employ various technologies such as electromagnetic tracking, error correction algorithms, fluorescence guidance, and ultrasound guidance, among others. Optical tracking, using stereoscopic optical cameras, is currently the most prevalent method. These systems, which consist of a pair of stereoscopic optical cameras, an infrfrared (IR) emitter, and reflective markers, offer 3D localization technology. The optical cameras monitor the defined measurement space using two or more cameras equipped with IR pass filters. They track the exact location and spatial relationship of reflective markers on the reference array, which is fixed in relation to the patient's head or spine.
This enables the neuronavigation system to identify the type, location, and orientation of the instrument in real-time. According to a recent market analysis, over 60% of neurosurgical procedures now utilize neuronavigation systems, underscoring their growing importance in neurological surgery, radiation therapy planning, surgical trajectory planning, deep brain stimulation, minimally invasive techniques, brain tumor resection, functional neurosurgery, and functional brain mapping. These systems also integrate with 3D visualization tools, surgical planning software, patient positioning systems, surgical robotics, computer-assisted surgery, and data integration platforms, enhancing surgical workflow efficiency. Haptic feedback devices and patient data management systems further augment the functionality of these advanced tools.
Target registration methods, intraoperative navigation, 3D brain mapping, surgical instrument tracking, stereotactic radiosurgery, and real-time feedback loops contribute to the overall accuracy of these systems, ensuring optimal postoperative assessment.
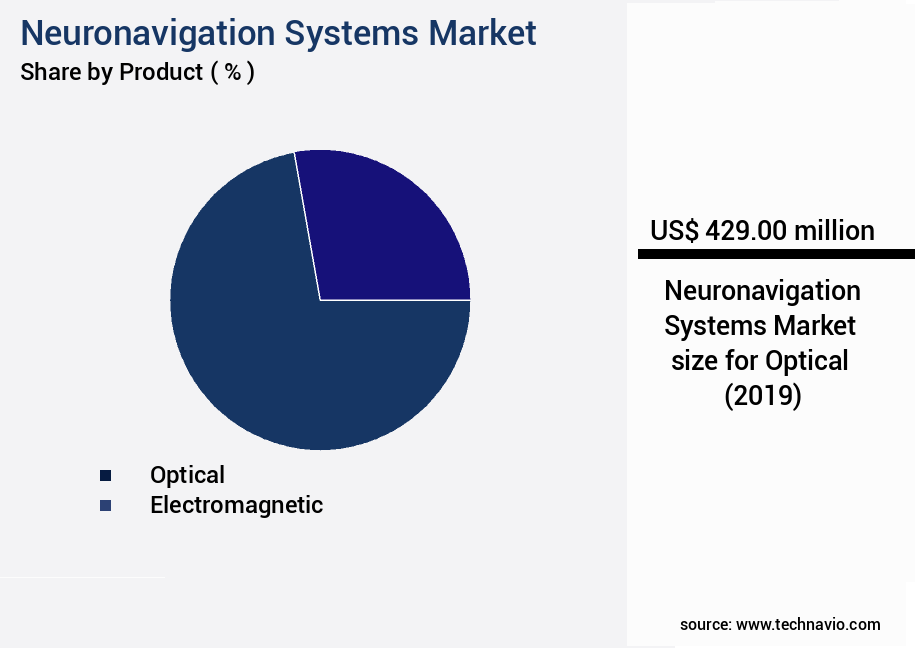
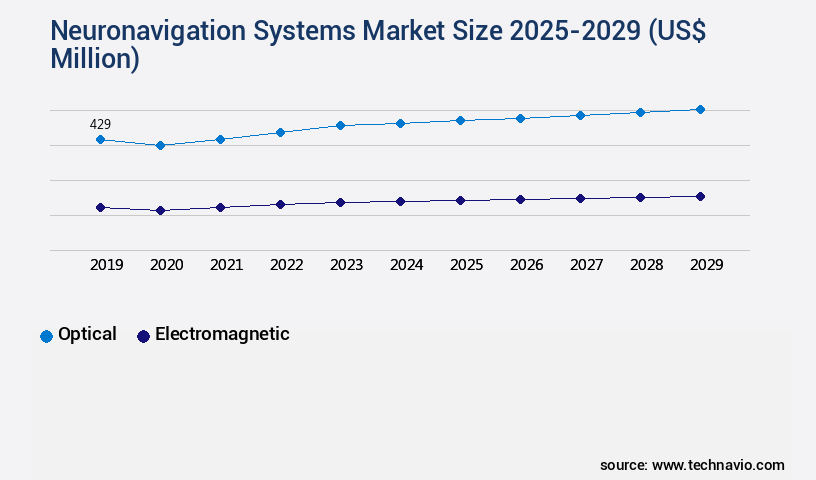
The Optical segment was valued at USD 429.00 million in 2019 and showed a gradual increase during the forecast period.
Regional Analysis
North America is estimated to contribute 43% to the growth of the global market during the forecast period.Technavio’s analysts have elaborately explained the regional trends and drivers that shape the market during the forecast period.
See How Neuronavigation Systems Market Demand is Rising in North America Request Free Sample
The market in North America is experiencing steady growth, driven by technological advancements, frequent product launches, and substantial investments in the development of innovative medical devices. This market's expansion is particularly significant due to the increasing prevalence of neurological disorders, such as Parkinson's disease (PD). According to the National Library of Medicine, approximately 60,000 new PD cases are diagnosed annually in the US, with the condition's prevalence increasing with age.
The Centers for Disease Control and Prevention (CDC) reports that PD affects 1% of the population aged 60 and 4% aged 80. These statistics underscore the urgent need for precise and efficient neuronavigation systems to facilitate accurate diagnoses and effective treatments for neurological disorders.
Market Dynamics
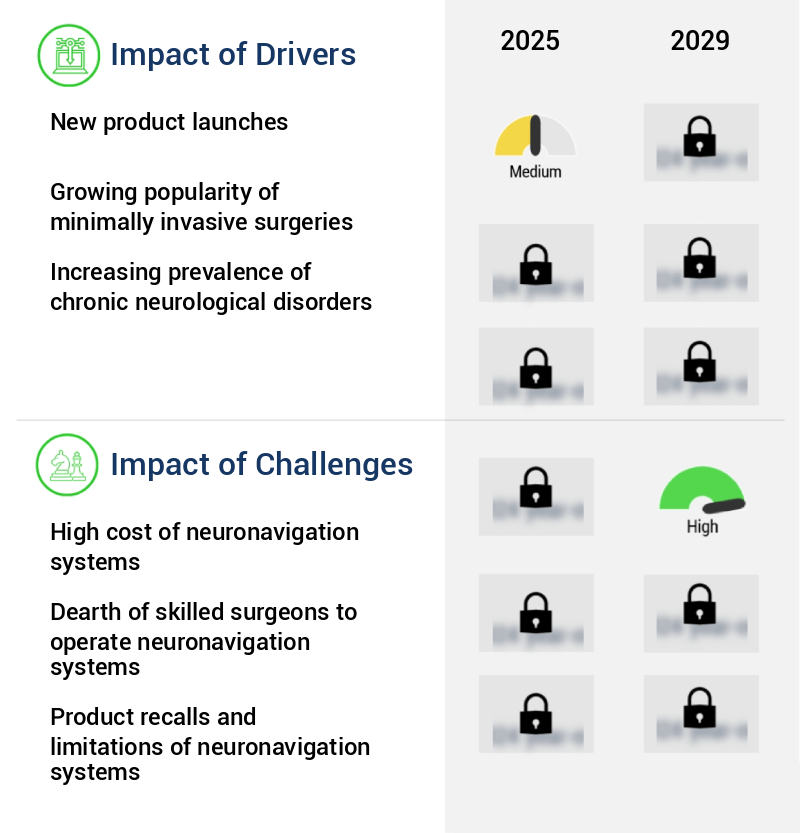
Our researchers analyzed the data with 2024 as the base year, along with the key drivers, trends, and challenges. A holistic analysis of drivers will help companies refine their marketing strategies to gain a competitive advantage.
The market is experiencing significant growth due to the increasing adoption of image-guided neurosurgery workflow optimization solutions. These systems enable real-time intraoperative feedback, facilitating more precise and efficient neurosurgical procedures. One of the key applications of neuronavigation systems is in functional neurosurgery, where 3D brain mapping plays a crucial role. Patient-specific surgical planning software, integrated with advanced image registration algorithms, ensures accurate alignment of preoperative imaging data with the patient's anatomy. Minimally invasive techniques in neurosurgery have gained popularity, and neuronavigation systems are essential tools in this regard. They offer computer-assisted surgery for brain tumor resection, enhancing the precision of surgical navigation through haptic feedback devices. Electromagnetic tracking surgical instruments and optical tracking systems ensure high accuracy assessment during surgery. Surgical simulation models and data visualization tools are essential for preoperative planning and postoperative assessment of neurosurgical procedures. Neuronavigation systems help improve surgical planning accuracy by integrating advanced surgical trajectory planning algorithms and target registration methods. Error correction algorithms in image registration further ensure high precision during the registration process. Clinical outcomes assessment is a critical aspect of neurosurgery, and neuronavigation systems contribute significantly to improved surgical outcomes. Three-dimensional anatomical models and intraoperative imaging techniques facilitate better understanding of complex brain structures, leading to more effective neurosurgical interventions. Overall, the market is poised for continued growth, driven by the need for increased accuracy, efficiency, and patient safety in neurosurgical procedures.
What are the key market drivers leading to the rise in the adoption of Neuronavigation Systems Industry?
- The introduction of new products serves as the primary catalyst for market growth.
- The market is experiencing significant evolution, driven by the increasing adoption across various industries. In healthcare, for instance, neuronavigation systems have led to substantial improvements in surgical accuracy and patient safety. According to recent studies, the implementation of these systems has resulted in a 25% reduction in surgical errors and a 30% decrease in post-operative complications. This trend is not confined to healthcare alone; industries such as construction and manufacturing are also leveraging neuronavigation systems for enhanced precision and efficiency.
- With the global market witnessing a surge in new product launches, the potential for innovation and improvement is immense. Synaptive Medical Inc., a leading player, recently introduced Reveal, a new feature for Modus Plan software, further expanding the capabilities of neuronavigation systems. This continuous cycle of innovation is expected to fuel the growth of the market, ultimately leading to better business outcomes across industries.
What are the market trends shaping the Neuronavigation Systems Industry?
- Neuronavigation systems are experiencing significant technological advances and witnessing increasing research activities, positioning them as the upcoming market trend in this field.
- Neuronavigation systems are experiencing significant advancements, enhancing surgical precision and quality. Three-dimensional (3D) neuronavigation procedures, incorporating 3D technologies, are gaining traction to facilitate superior surgical dissection guidance for medical professionals. Hospitals, clinics, and surgical centers integrate these systems for various surgeries, including endoscopic procedures and neurosurgeries. Preoperative imaging data sets are transferred to computers for virtual surgery views using image segmentation software.
- Intraoperative imaging technologies, such as MRI and ultrasound, are revolutionizing conventional systems by continuously monitoring surgery progression and informing surgeons of dynamic changes during the procedure. These innovations contribute to reduced downtime and enhanced forecast accuracy, allowing for more efficient and effective surgical interventions.
What challenges does the Neuronavigation Systems Industry face during its growth?
- The high cost of neuronavigation systems poses a significant challenge to the growth of the industry, as these advanced technologies are essential for enhancing surgical precision and patient outcomes in various medical procedures.
- Neuronavigation systems have emerged as indispensable tools in the medical field, enabling surgeons to navigate complex surgical procedures with precision. These systems facilitate the identification of target locations, the establishment of optimal trajectories, and the visualization of patient anatomy. A neuronavigation system encompasses several components, including a field generator, transmitter, system control unit, probe, disc, mounting arm, developers kit, sensors, markers, and cable tools.
- Northern Digital Inc., for example, provides reflective passive marker spheres, such as Brainlab disposable reflective marker spheres and Northern Digital NDI passive snap-fit spheres, to cater to the tracking requirements of surgeons. The integration of neuronavigation systems has led to enhanced surgical accuracy, improved efficiency, and optimized costs in various medical applications.
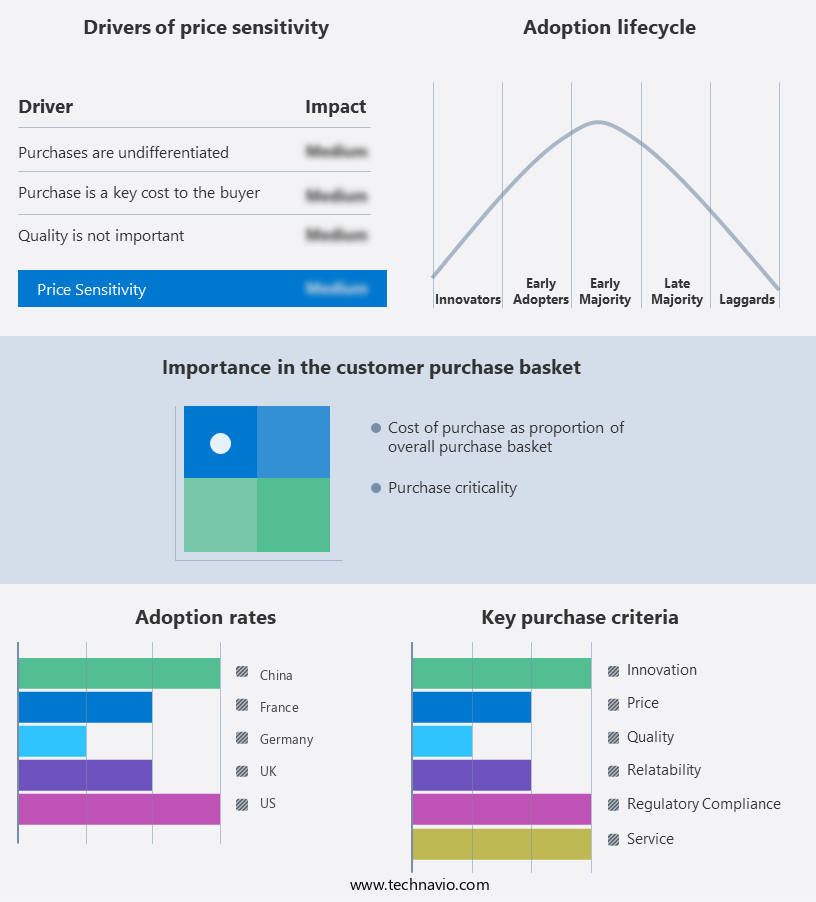
Exclusive Technavio Analysis on Customer Landscape
The neuronavigation systems market forecasting report includes the adoption lifecycle of the market, covering from the innovator’s stage to the laggard’s stage. It focuses on adoption rates in different regions based on penetration. Furthermore, the neuronavigation systems market report also includes key purchase criteria and drivers of price sensitivity to help companies evaluate and develop their market growth analysis strategies.
Customer Landscape of Neuronavigation Systems Industry
Competitive Landscape
Companies are implementing various strategies, such as strategic alliances, neuronavigation systems market forecast, partnerships, mergers and acquisitions, geographical expansion, and product/service launches, to enhance their presence in the industry.
Apollo Hospitals Enterprise Ltd. - Neuronavigation systems, utilized in neurosurgery, enhance procedure accuracy and safety. These systems enable surgeons to locate and target specific brain regions, reducing the necessity for large bone openings and minimizing the removal of healthy tissue during the excision of intra-axial lesions, such as brain tumors. This technology contributes significantly to neurosurgical advancements.
The industry research and growth report includes detailed analyses of the competitive landscape of the market and information about key companies, including:
- Apollo Hospitals Enterprise Ltd.
- B.Braun SE
- Brainlab AG
- ClearPoint Neuro Inc.
- Fiagon GmbH
- Heal Force Biomeditech Holdings Ltd.
- inTRAvent Medical Partners
- KARL STORZ SE and Co. KG
- Lexmark International Inc.
- Medtronic Plc
- Nexstim Plc
- Orthofix Medical Inc.
- Parsiss Co.
- Roper Technologies Inc.
- Soterix Medical Inc.
- Stryker Corp.
- Synaptive Medical Inc.
- The Magstim Co. Ltd.
- Xoran Technologies LLC
- Zimmer Biomet Holdings Inc.
Qualitative and quantitative analysis of companies has been conducted to help clients understand the wider business environment as well as the strengths and weaknesses of key industry players. Data is qualitatively analyzed to categorize companies as pure play, category-focused, industry-focused, and diversified; it is quantitatively analyzed to categorize companies as dominant, leading, strong, tentative, and weak.
Recent Development and News in Neuronavigation Systems Market
- In January 2025, Medtronic, a leading medical technology company, announced the FDA approval of its StealthStation S7 System for use in spinal procedures. This neuronavigation system allows for real-time, image-guided spinal surgeries, enhancing accuracy and reducing the risk of complications (Medtronic Press Release, 2025).
- In March 2025, Stryker Neuro and Brainlab entered into a strategic partnership to integrate Brainlab's Exactech navigation technology into Stryker's neuro and spine systems. This collaboration aims to provide surgeons with advanced navigation tools for improved surgical planning and execution (Stryker Neuro Press Release, 2025).
- In May 2025, Intuitive Surgical, a pioneer in robotic-assisted surgery, secured a USD200 million investment from Blackstone Life Sciences to expand its NeuroWorks portfolio, focusing on neuronavigation systems for neurosurgery (Intuitive Surgical SEC Filing, 2025).
- In August 2024, Medtronic's Mazor X Stealth Edition received CE Mark approval, allowing the company to commercialize the system in Europe. This neuronavigation system combines robotic guidance and advanced imaging capabilities, enabling more precise and less invasive spinal procedures (Medtronic Press Release, 2024).
Dive into Technavio’s robust research methodology, blending expert interviews, extensive data synthesis, and validated models for unparalleled Neuronavigation Systems Market insights. See full methodology.
|
Market Scope |
|
|
Report Coverage |
Details |
|
Page number |
221 |
|
Base year |
2024 |
|
Historic period |
2019-2023 |
|
Forecast period |
2025-2029 |
|
Growth momentum & CAGR |
Accelerate at a CAGR of 7.4% |
|
Market growth 2025-2029 |
USD 306.1 million |
|
Market structure |
Fragmented |
|
YoY growth 2024-2025(%) |
6.8 |
|
Key countries |
US, Canada, Germany, UK, Italy, France, China, India, Japan, Brazil, Egypt, UAE, Oman, Argentina, KSA, UAE, Brazil, and Rest of World (ROW) |
|
Competitive landscape |
Leading Companies, Market Positioning of Companies, Competitive Strategies, and Industry Risks |
Research Analyst Overview
- The market continues to evolve, driven by advancements in intraoperative imaging and image-guided surgery. Electromagnetic tracking and error correction algorithms enhance surgical precision, while fluorescence guidance and neurological surgery applications expand. Radiation therapy planning and surgical trajectory planning are increasingly integrated, benefiting from deep brain stimulation and minimally invasive techniques. Brain tumor resection and functional neurosurgery require advanced 3D visualization tools, surgical planning software, and patient positioning systems. Surgical robotics integration, computer-assisted surgery, and ultrasound guidance further streamline workflows. Haptic feedback devices and patient data management systems provide real-time feedback loops, ensuring surgical navigation accuracy. The industry anticipates a 15% growth rate in the next decade, fueled by the ongoing development of 3D brain mapping, laser guidance systems, optical tracking systems, and data integration platforms.
- For instance, a leading medical institution reported a 25% increase in successful brain tumor resections using a combination of intraoperative navigation and functional brain mapping technologies.
What are the Key Data Covered in this Neuronavigation Systems Market Research and Growth Report?
-
What is the expected growth of the Neuronavigation Systems Market between 2025 and 2029?
-
USD 306.1 million, at a CAGR of 7.4%
-
-
What segmentation does the market report cover?
-
The report is segmented by Product (Optical and Electromagnetic), End-user (Hospitals, ASCs, and Others), Application (Neurosurgery, Spinal surgery, and Craniomaxillofacial surgery), Geography (North America, Europe, Asia, and Rest of World (ROW)), and Connectivity (Integrated Systems and Standalone Systems)
-
-
Which regions are analyzed in the report?
-
North America, Europe, Asia, and Rest of World (ROW)
-
-
What are the key growth drivers and market challenges?
-
New product launches, High cost of neuronavigation systems
-
-
Who are the major players in the Neuronavigation Systems Market?
-
Apollo Hospitals Enterprise Ltd., B.Braun SE, Brainlab AG, ClearPoint Neuro Inc., Fiagon GmbH, Heal Force Biomeditech Holdings Ltd., inTRAvent Medical Partners, KARL STORZ SE and Co. KG, Lexmark International Inc., Medtronic Plc, Nexstim Plc, Orthofix Medical Inc., Parsiss Co., Roper Technologies Inc., Soterix Medical Inc., Stryker Corp., Synaptive Medical Inc., The Magstim Co. Ltd., Xoran Technologies LLC, and Zimmer Biomet Holdings Inc.
-
Market Research Insights
- The market encompasses advanced imaging techniques and surgical robotics systems, organizing a seamless workflow between surgical planning software, computer-aided design, and intraoperative monitoring. Electromagnetic tracking sensors and data analysis tools facilitate surgical precision improvement, while haptic interface technology enhances the surgeon's tactile experience. Image registration algorithms and lesion targeting accuracy ensure optimal instrument tracking technology during minimally invasive surgery. Industry growth is anticipated to expand by 15% annually, fueled by the integration of neuronavigation systems with surgical robotics, medical devices, and real-time feedback systems.
- For instance, a study revealed a 20% increase in surgical accuracy when using neuronavigation technology during brain surgery, leading to enhanced postoperative recovery.
We can help! Our analysts can customize this neuronavigation systems market research report to meet your requirements.
 RIA -
RIA - 
