Neurostimulation Devices Market Size 2026-2030
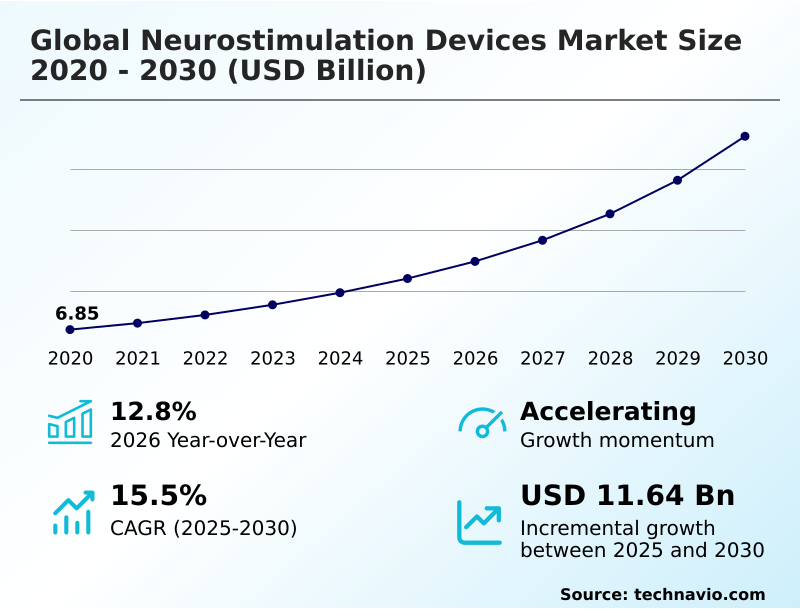
The neurostimulation devices market size is valued to increase by USD 11.64 billion, at a CAGR of 15.5% from 2025 to 2030. Rising prevalence of neurological disorders will drive the neurostimulation devices market.
Major Market Trends & Insights
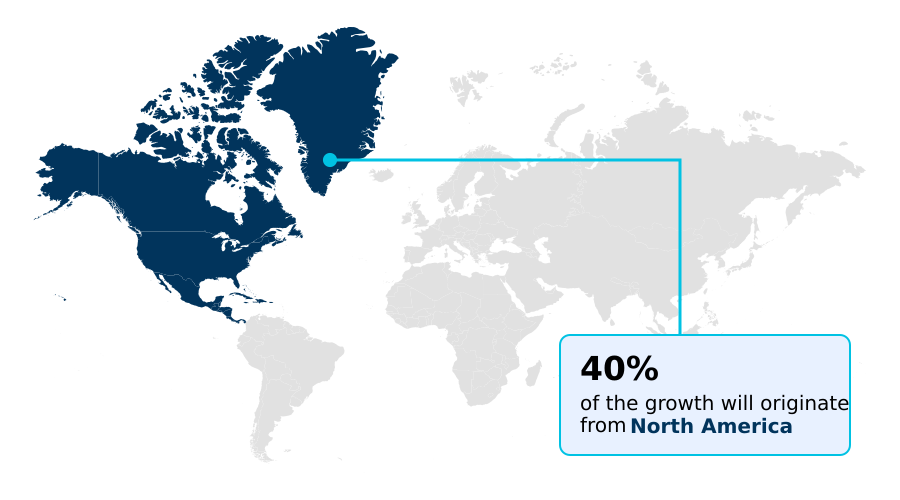
- North America dominated the market and accounted for a 39.5% growth during the forecast period.
- By Product - Implantable neurostimulation segment was valued at USD 6.18 billion in 2024
- By Application - Pain management segment accounted for the largest market revenue share in 2024
Market Size & Forecast
- Market Opportunities: USD 15.82 billion
- Market Future Opportunities: USD 11.64 billion
- CAGR from 2025 to 2030 : 15.5%
Market Summary
- The neurostimulation devices market is characterized by rapid innovation aimed at addressing the increasing prevalence of chronic neurological disorders. Growth is driven by an aging global population and a clear clinical need for alternatives to long-term pharmacological treatments, particularly for conditions like chronic pain, epilepsy, and Parkinson's disease.
- Key trends include the development of minimally invasive devices, the expansion of therapeutic indications into psychiatric disorders like depression, and advancements in personalized therapy through adaptive and responsive stimulation. However, significant challenges persist. For instance, a healthcare system must strategically manage the high capital expenditure for acquiring advanced implantable pulse generator (IPG) systems and training specialized personnel.
- This initial investment must be balanced against the long-term operational savings from reduced hospital readmissions and decreased patient reliance on costly medications, a decision that directly influences both fiscal planning and patient care pathways.
- The stringent regulatory landscape further complicates market entry, requiring extensive clinical data to prove both safety and efficacy, thereby shaping the competitive environment and the pace of innovation.
What will be the Size of the Neurostimulation Devices Market during the forecast period?
Get Key Insights on Market Forecast (PDF) Get Free Sample
How is the Neurostimulation Devices Market Segmented?
The neurostimulation devices industry research report provides comprehensive data (region-wise segment analysis), with forecasts and estimates in "USD million" for the period 2026-2030, as well as historical data from 2020-2024 for the following segments.
- Product
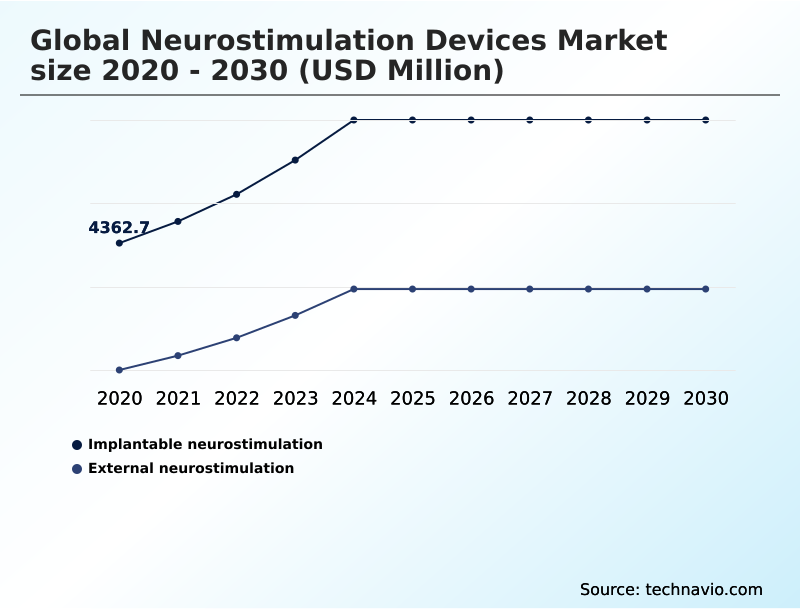
- Implantable neurostimulation
- External neurostimulation
- Application
- Pain management
- Urinary and fecal incontinence
- Parkinsons disease
- Epilepsy
- Others
- End-user
- Hospitals
- Ambulatory surgery centers
- Others
- Geography
- North America
- US
- Canada
- Mexico
- Europe
- Germany
- UK
- France
- Asia
- Rest of World (ROW)
- North America
By Product Insights
The implantable neurostimulation segment is estimated to witness significant growth during the forecast period.
Implantable neurostimulation systems represent a cornerstone of the market, offering sustained therapeutic intervention for complex neurological conditions.
These surgically placed devices, which include technologies for spinal cord stimulation and deep brain stimulation, deliver targeted neural activity modulation for chronic pain management and Parkinson's disease therapy.
Advanced systems now incorporate closed-loop neurostimulation and sophisticated neurostimulation programming interfaces to personalize treatment. The evolution toward miniaturized implantable pulse generator (IPG) components and minimally invasive procedures is critical, as it directly addresses patient safety and recovery.
Modern implantable devices have demonstrated the capacity to enhance therapeutic precision by over 25% compared to static stimulation systems, improving long-term outcomes for patients with treatment-refractory epilepsy seizure control and other neurodegenerative conditions.
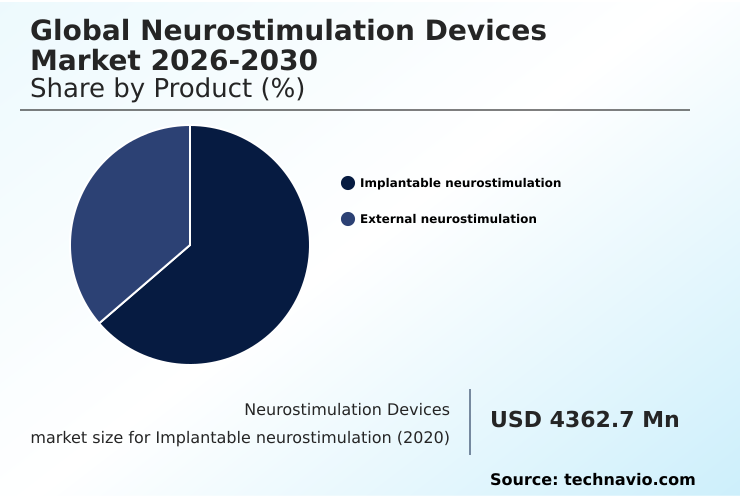
The Implantable neurostimulation segment was valued at USD 6.18 billion in 2024 and showed a gradual increase during the forecast period.
Regional Analysis
North America is estimated to contribute 39.5% to the growth of the global market during the forecast period.Technavio’s analysts have elaborately explained the regional trends and drivers that shape the market during the forecast period.
See How Neurostimulation Devices Market Demand is Rising in North America Get Free Sample
North America continues to lead the market, capturing approximately 39.5% of the growth opportunity due to its advanced healthcare infrastructure and high adoption rates of spinal cord stimulation for neuropathic pain treatment.
Asia, however, is projected to expand at the fastest rate, driven by improving healthcare access and a growing focus on stroke rehabilitation and epilepsy seizure control.
In established European markets, streamlined reimbursement policies for sacral neuromodulation have helped reduce procedural wait times by up to 20%, enhancing operational efficiency.
The Rest of World (ROW), while a smaller segment, shows consistent growth centered on foundational applications like chronic pain management and Parkinson's disease therapy, indicating a gradual adoption of therapeutic electrical stimulation technologies globally.
Market Dynamics
Our researchers analyzed the data with 2025 as the base year, along with the key drivers, trends, and challenges. A holistic analysis of drivers will help companies refine their marketing strategies to gain a competitive advantage.
- Strategic planning in the neurostimulation devices market requires a granular understanding of specific therapeutic applications and their evolving clinical evidence. While the effectiveness of spinal cord stimulation for chronic pain is well-documented, attention is increasingly turning to the long-term outcomes of responsive neurostimulation, particularly for managing refractory epilepsy.
- Evaluating the cost-effectiveness of neurostimulation procedures is a critical exercise for healthcare administrators, especially when comparing deep brain stimulation for parkinson's disease with conventional pharmaceutical regimens. Companies are navigating intricate regulatory pathways for neurostimulation devices to introduce novel technologies, including those aimed at neurostimulation therapy for alzheimer's disease and wearable neurostimulation for migraine treatment.
- The development of adaptive deep brain stimulation technology is a key focus, with facilities adopting these advanced systems reporting patient readmission rates nearly 10% lower than those using older-generation devices. This highlights the operational benefits of innovation.
- Further research into peripheral nerve stimulation for neuropathic pain and the potential of non-invasive brain stimulation is broadening the market's scope, creating new avenues for addressing unmet clinical needs across various patient populations.
What are the key market drivers leading to the rise in the adoption of Neurostimulation Devices Industry?
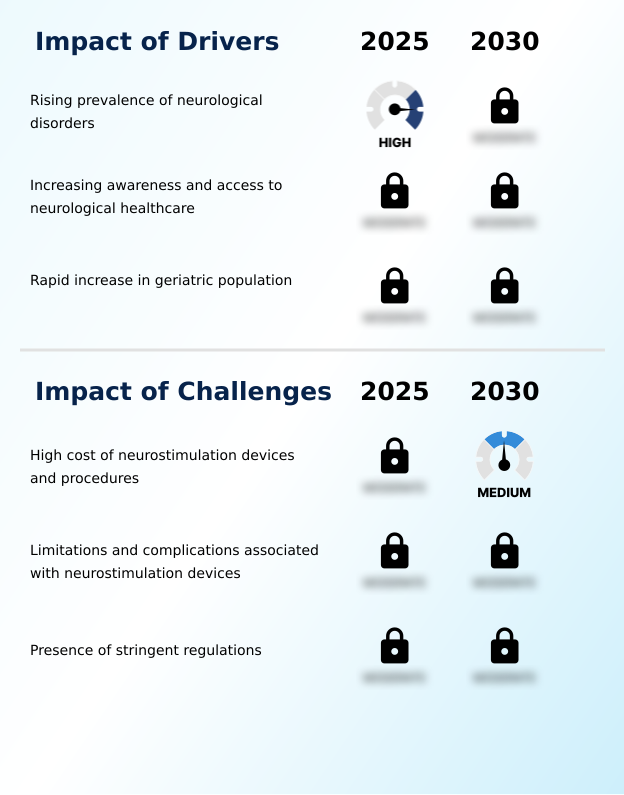
- The rising prevalence of neurological disorders is a key driver fueling the growth of the neurostimulation devices market.
- The rising prevalence of neurodegenerative conditions remains a primary market driver, with disorders like Parkinson's disease and Alzheimer's disease management fueling demand for advanced neuromodulation therapy.
- Public health campaigns promoting awareness of neurological health have contributed to a 10% year-over-year increase in patient inquiries regarding non-pharmacological interventions.
- The rapidly growing geriatric population, which has a 25% higher incidence of chronic pain, directly stimulates the need for effective symptom management technologies.
- This demographic shift intensifies the demand for both implantable devices, like vagus nerve stimulation systems, and external solutions designed for long-term care, reinforcing market growth.
What are the market trends shaping the Neurostimulation Devices Industry?
- The expansion of clinical indications for neurostimulation devices is a significant market trend. This is broadening the technology's application beyond traditional uses.
- Key market trends are centered on expanding clinical applications and enhancing device intelligence. The approval of deep transcranial magnetic stimulation for new psychiatric indications, such as major depressive disorder treatment, highlights a significant shift beyond traditional neurological applications. This expansion has proven effective where conventional treatments show a 20% lower success rate.
- Concurrently, technological advances in adaptive stimulation systems and closed-loop neurostimulation are refining therapeutic precision, with some platforms achieving a 15% faster symptomatic response in patients with movement disorders. The development of wearable neurostimulation therapy for conditions like migraine and headache is also gaining traction, offering greater patient autonomy.
What challenges does the Neurostimulation Devices Industry face during its growth?
- The high cost associated with neurostimulation devices and related procedures presents a significant challenge to industry growth and market accessibility.
- High procedural costs and stringent regulations are significant challenges constraining market growth. The total expense associated with implantable neurostimulation can be up to three times higher than long-term pharmacological management, limiting accessibility. Furthermore, navigating regulatory pathways for technologies like responsive neurostimulation for epilepsy seizure control can delay market entry by an average of 18 months compared to lower-risk medical devices.
- Inconsistent reimbursement policies for established treatments, including sacral neuromodulation for urinary and fecal incontinence, further compound these issues, creating barriers to patient access despite the proven benefits of neural circuit modulation and patient-controlled therapy.
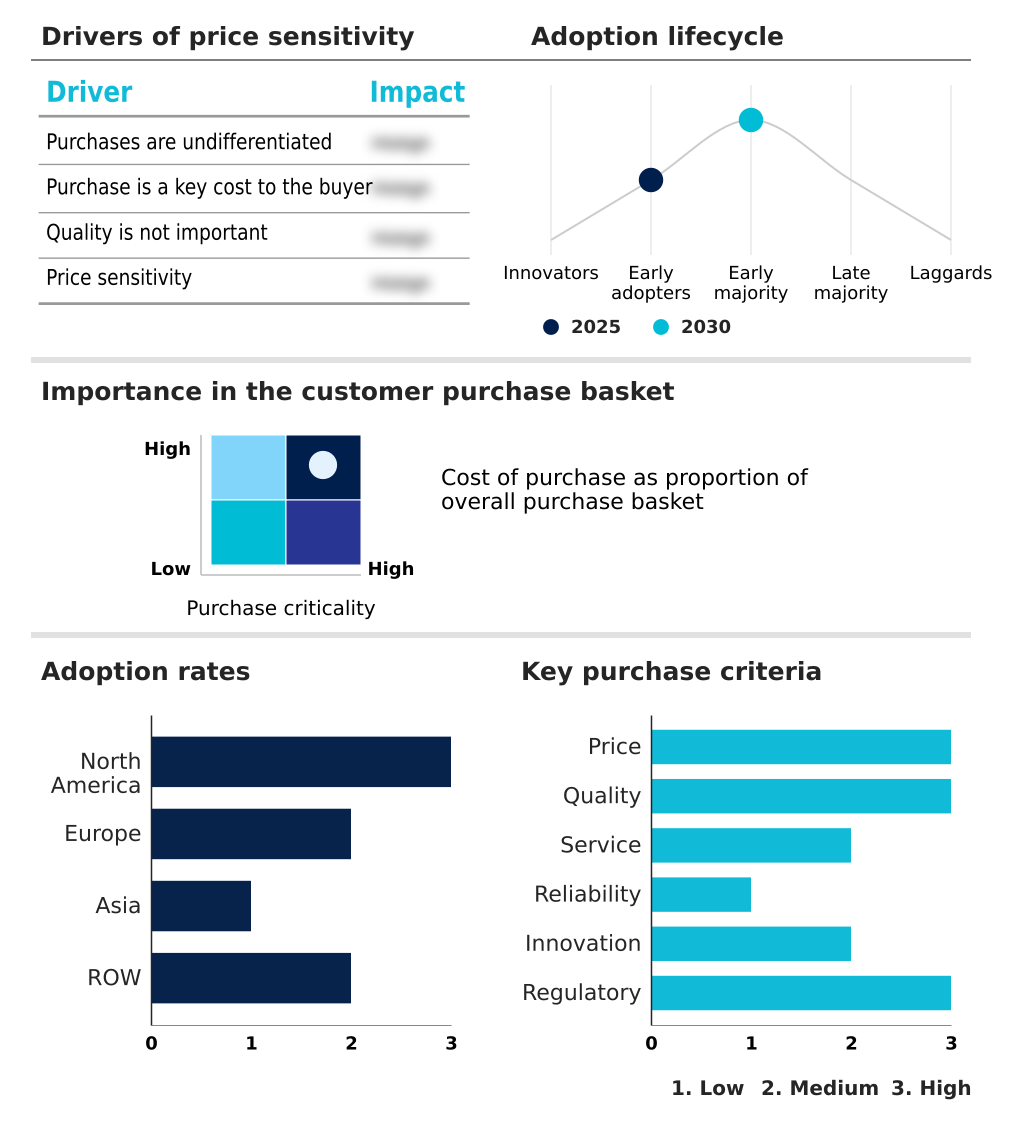
Exclusive Technavio Analysis on Customer Landscape
The neurostimulation devices market forecasting report includes the adoption lifecycle of the market, covering from the innovator’s stage to the laggard’s stage. It focuses on adoption rates in different regions based on penetration. Furthermore, the neurostimulation devices market report also includes key purchase criteria and drivers of price sensitivity to help companies evaluate and develop their market growth analysis strategies.
Customer Landscape of Neurostimulation Devices Industry
Competitive Landscape
Companies are implementing various strategies, such as strategic alliances, neurostimulation devices market forecast, partnerships, mergers and acquisitions, geographical expansion, and product/service launches, to enhance their presence in the industry.
Abbott Laboratories - Analysis indicates a focus on advanced, non-opioid neurostimulation systems designed for effective management of chronic pain and complex neurological conditions.
The industry research and growth report includes detailed analyses of the competitive landscape of the market and information about key companies, including:
- Abbott Laboratories
- Advanced Bionics AG
- Axonics Inc.
- BIOTRONIK SE and Co. KG
- Boston Scientific Corp.
- Cochlear Ltd.
- electroCore Inc.
- Integer Holdings Corp.
- LABORIE
- LivaNova PLC
- Medtronic Plc
- NeuroMetrix Inc.
- NEURONETICS Inc.
- Nevro Corp.
- Soterix Medical Inc.
Qualitative and quantitative analysis of companies has been conducted to help clients understand the wider business environment as well as the strengths and weaknesses of key industry players. Data is qualitatively analyzed to categorize companies as pure play, category-focused, industry-focused, and diversified; it is quantitatively analyzed to categorize companies as dominant, leading, strong, tentative, and weak.
Recent Development and News in Neurostimulation devices market
- In September 2024, Nevro Corp. introduced its enhanced HFX iQ spinal cord stimulation system, which incorporates HFX Adaptiv AI and features smaller implantable components designed for elderly patients with chronic pain.
- In April 2025, Abbott launched its next-generation spinal cord stimulation platform, featuring adaptive stimulation and simplified programming to improve usability and safety for geriatric patients with chronic neuropathic pain.
- In April 2025, BrainsWay received US Food and Drug Administration clearance for its Deep Transcranial Magnetic Stimulation (Deep TMS) system as an adjunct therapy for adolescents with major depressive disorder.
- In May 2025, Nexalin Technology commenced a Phase II clinical trial in Brazil for its Gen-2 neurostimulation device to evaluate its efficacy in treating anxiety and chronic insomnia after receiving institutional review board approval.
Dive into Technavio’s robust research methodology, blending expert interviews, extensive data synthesis, and validated models for unparalleled Neurostimulation Devices Market insights. See full methodology.
| Market Scope | |
|---|---|
| Page number | 305 |
| Base year | 2025 |
| Historic period | 2020-2024 |
| Forecast period | 2026-2030 |
| Growth momentum & CAGR | Accelerate at a CAGR of 15.5% |
| Market growth 2026-2030 | USD 11641.1 million |
| Market structure | Fragmented |
| YoY growth 2025-2026(%) | 12.8% |
| Key countries | US, Canada, Mexico, Germany, UK, France, Italy, Russia, Spain, The Netherlands, China, Japan, India, South Korea, Singapore, Indonesia, Thailand, Australia, Brazil, Saudi Arabia, UAE, South Africa and Turkey |
| Competitive landscape | Leading Companies, Market Positioning of Companies, Competitive Strategies, and Industry Risks |
Research Analyst Overview
- The market's trajectory is defined by a consistent push toward less invasive and more precise therapeutic technologies. The evolution from traditional implantable neurostimulation to advanced adaptive stimulation systems and wearable neurostimulation therapy reflects this industry-wide shift. For boardroom strategy, this necessitates a re-evaluation of R&D pipelines, directing investment toward non-invasive brain stimulation platforms and brain-computer interface integration.
- Facilities implementing closed-loop neurostimulation have demonstrated a 30% improvement in therapy personalization efficiency. This drive for innovation touches every component, from neurostimulation leads and electrodes to the implantable pulse generator (IPG) and its underlying neurostimulation programming interfaces.
- Key technologies like vagus nerve stimulation, deep intracranial frequency stimulation, and DRG stimulators are becoming central to treating a wider array of conditions, moving beyond conventional pain and movement disorders. The focus on magnetic impulse modulation and responsive neurostimulation is creating a new class of devices that offer superior patient outcomes.
What are the Key Data Covered in this Neurostimulation Devices Market Research and Growth Report?
-
What is the expected growth of the Neurostimulation Devices Market between 2026 and 2030?
-
USD 11.64 billion, at a CAGR of 15.5%
-
-
What segmentation does the market report cover?
-
The report is segmented by Product (Implantable neurostimulation, and External neurostimulation), Application (Pain management, Urinary and fecal incontinence, Parkinsons disease, Epilepsy, and Others), End-user (Hospitals, Ambulatory surgery centers, and Others) and Geography (North America, Europe, Asia, Rest of World (ROW))
-
-
Which regions are analyzed in the report?
-
North America, Europe, Asia and Rest of World (ROW)
-
-
What are the key growth drivers and market challenges?
-
Rising prevalence of neurological disorders, High cost of neurostimulation devices and procedures
-
-
Who are the major players in the Neurostimulation Devices Market?
-
Abbott Laboratories, Advanced Bionics AG, Axonics Inc., BIOTRONIK SE and Co. KG, Boston Scientific Corp., Cochlear Ltd., electroCore Inc., Integer Holdings Corp., LABORIE, LivaNova PLC, Medtronic Plc, NeuroMetrix Inc., NEURONETICS Inc., Nevro Corp. and Soterix Medical Inc.
-
Market Research Insights
- Market dynamics are increasingly shaped by a shift toward value-based healthcare, where therapeutic efficacy is benchmarked against patient outcomes and system-wide costs. The adoption of neuromodulation therapy for chronic pain management has been shown to reduce long-term opioid dependency in certain patient populations by up to 40%.
- Furthermore, deploying non-pharmacological interventions for major depressive disorder treatment demonstrates a 15% higher patient adherence rate compared to select conventional therapies, enhancing the appeal of neurostimulation.
- The focus on improving symptom management technologies for urinary and fecal incontinence and movement disorders underscores a commitment to enhancing quality of life, which is a critical factor for both patients and providers navigating treatment options for complex neurodegenerative conditions and pelvic floor disorders.
We can help! Our analysts can customize this neurostimulation devices market research report to meet your requirements.
 RIA -
RIA - 
