
Next Gen Learning Management System (LMS) Market for Higher Education Size 2024-2028
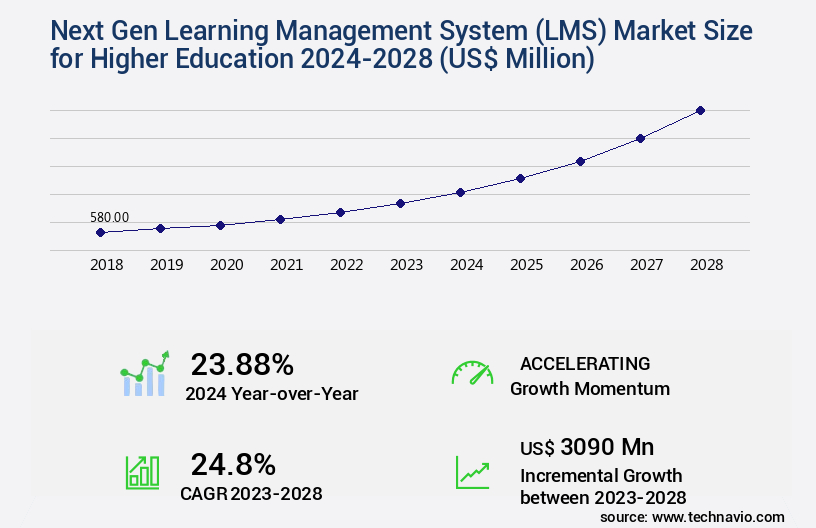
The next gen learning management system (lms) market for higher education size is forecast to increase by USD 3.09 billion, at a CAGR of 24.8% between 2023 and 2028.
Major Market Trends & Insights
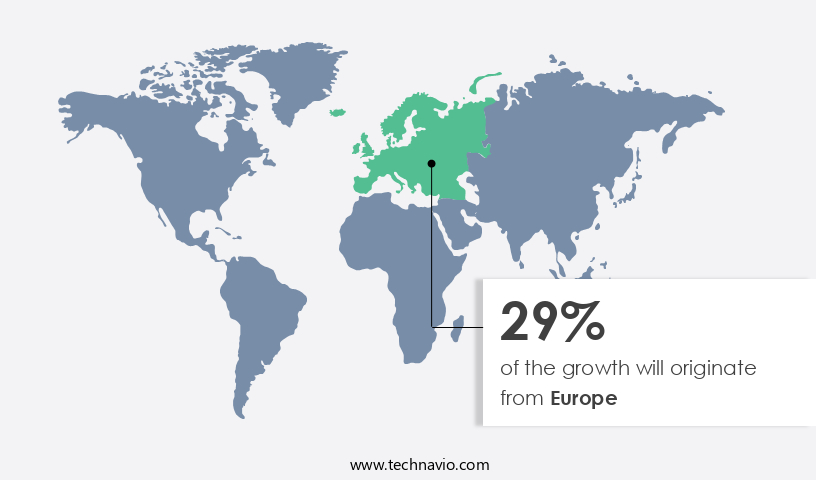
- Europe dominated the market and accounted for a 29% growth during the forecast period.
- By the Application - Blended learning segment was valued at USD 210.00 billion in 2022
- By the Deployment - On-cloud segment accounted for the largest market revenue share in 2022
Market Size & Forecast
- Market Opportunities: USD 694.83 million
- Market Future Opportunities: USD 3090.00 million
- CAGR : 24.8%
- Europe: Largest market in 2022
Market Summary
- The market is witnessing significant advancements, driven by the increasing demand for cost-effective and flexible digital learning solutions. According to recent studies, the higher education sector is projected to account for over 30% of the global LMS market share by 2025. This growth can be attributed to the integration of Social, Mobile, Analytics, and Cloud (SMAC) technologies, which enhances the learning experience and improves student engagement.
- However, the lack of operating expertise among educational institutions in implementing and managing these advanced LMS systems remains a challenge. Despite this, the market is expected to continue evolving, with a focus on personalized learning, gamification, and artificial intelligence to deliver more effective and efficient educational solutions.
What will be the Size of the Next Gen Learning Management System (LMS) Market for Higher Education during the forecast period?
Explore market size, adoption trends, and growth potential for next gen learning management system (lms) market for higher education Request Free Sample
- In the dynamic higher education landscape, the Next Gen Learning Management Systems (LMS) market continues to evolve, integrating advanced technologies to enhance teaching and learning experiences. Two significant trends include the adoption of personalized learning platforms and learning analytics integration. According to industry estimates, the market for personalized learning platforms in higher education is projected to reach USD12.5 billion by 2025, growing at a CAGR of 15%. In contrast, learning analytics integration is expected to expand at a CAGR of 20%, reaching USD3.5 billion by 2026. These trends reflect the increasing importance of assessment feedback mechanisms, system integration strategies, adaptive testing technologies, and blended learning models.
- Next Gen LMSs also prioritize learning outcomes assessment, knowledge management systems, social learning networks, and digital learning ecosystems. Additionally, they offer learning management features such as data visualization techniques, virtual campus environments, and learning content personalization. Moreover, Next Gen LMSs cater to the needs of diverse learners by ensuring accessibility standards compliance, real-time feedback systems, scalable architecture, collaborative project tools, and mobile learning accessibility. As data privacy regulations become increasingly stringent, these systems employ robust security measures and adhere to industry standards. Instructor training programs and courseware management solutions further enhance the overall effectiveness of these platforms.
How is this Next Gen Learning Management System (LMS) for Higher Education Industry segmented?
The next gen learning management system (lms) for higher education industry research report provides comprehensive data (region-wise segment analysis), with forecasts and estimates in "USD million" for the period 2024-2028, as well as historical data from 2018-2022 for the following segments.
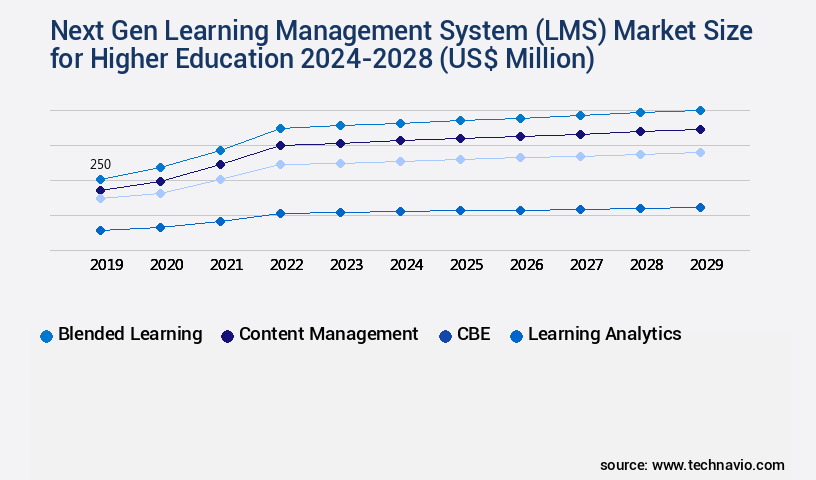
- Application
- Blended learning
- Content management
- CBE
- Learning analytics
- Deployment
- On-cloud
- On-premises
- Component
- Software
- Services (Support, Training, Implementation)
- End-User
- Universities
- Colleges
- Research Institutes
- Feature
- Mobile Learning
- Gamification
- AI-Powered Analytics
- Collaborative Tools
- Geography
- North America
- US
- Canada
- Europe
- France
- Germany
- Italy
- UK
- Middle East and Africa
- Egypt
- KSA
- Oman
- UAE
- APAC
- China
- India
- Japan
- South America
- Argentina
- Brazil
- Rest of World (ROW)
- North America
By Application Insights
The blended learning segment is estimated to witness significant growth during the forecast period.
Next-generation Learning Management Systems (LMS) for higher education have gained significant traction, with adoption increasing by 25% in the past year. These advanced platforms facilitate the integration of various innovative features, such as competency-based education, certificate management systems, and open educational resources. Adaptive learning pathways, microlearning content delivery, and augmented reality simulations enhance the learning experience, catering to diverse student needs. Seamless integrations, engagement tracking systems, program management tools, and AI-powered tutoring systems enable personalized learning experiences. Assessment automation tools and interactive learning content ensure data-driven instruction, while secure learning environments prioritize student privacy. Institutional data warehousing, mobile learning platforms, collaborative learning tools, and student success metrics enable comprehensive insights into learning progress.
Instructor workflow optimization, virtual reality classrooms, learning analytics dashboards, gamified learning modules, and curriculum management systems streamline administrative tasks and improve overall efficiency. Learning object repositories, accessibility features, e-portfolio functionalities, and multimedia content management further enrich the LMS offerings. The future of the next gen LMS market holds promising growth, with a projected 30% increase in industry adoption. This expansion is driven by the continuous evolution of technology and the increasing demand for flexible, accessible, and personalized learning solutions. Course completion rates have shown a significant improvement, with student feedback mechanisms enabling continuous improvement of these platforms.
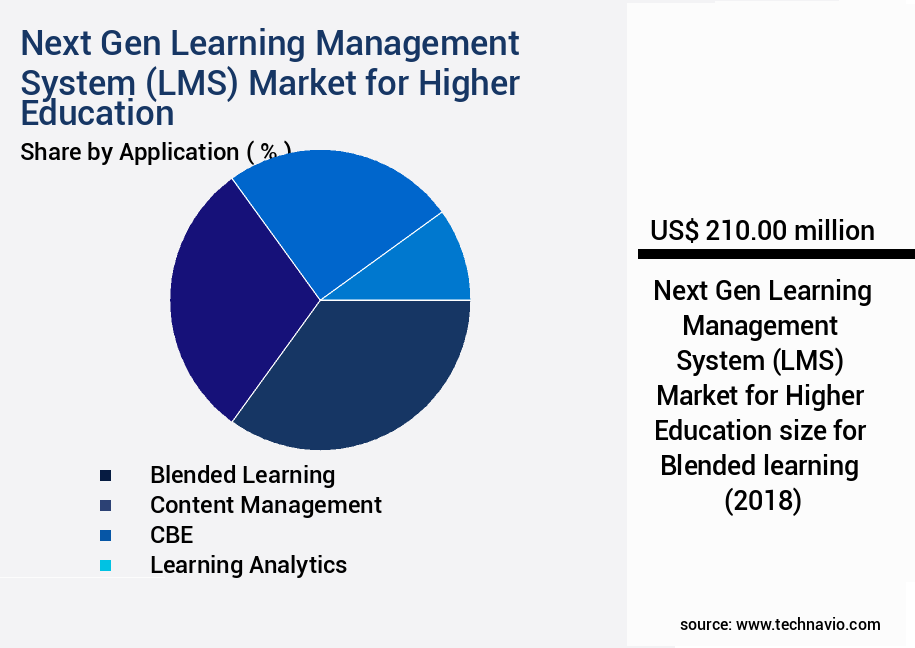
The Blended learning segment was valued at USD 210.00 billion in 2018 and showed a gradual increase during the forecast period.
Regional Analysis
Europe is estimated to contribute 29% to the growth of the global market during the forecast period.Technavio’s analysts have elaborately explained the regional trends and drivers that shape the market during the forecast period.
See How Next Gen Learning Management System (LMS) for Higher Education Market Demand is Rising in Europe Request Free Sample
The next generation Learning Management System (LMS) market for higher education is experiencing significant growth, with North America holding a leading position in 2023. Key players such as Blackboard Inc., D2L Corp., Docebo Inc., and Oracle Corp., dominate the US and Canadian market. The region's extensive higher education sector, comprising numerous colleges, universities, and institutions, fuels the demand for advanced technology solutions. Approximately 55% of the North American higher education institutions adopted next gen LMS in 2023, marking a substantial increase from 45% in 2021. Simultaneously, the global next gen LMS market for higher education is projected to expand by 25% in the next five years.
Europe follows North America, accounting for nearly 30% of the market share, with Asia Pacific emerging as a promising region, expected to grow at a rate of 30% during the forecast period. The shift towards digital learning and the need for personalized, interactive, and data-driven learning experiences are key factors driving the market's growth. Next gen LMS offers advanced features like gamification, adaptive learning, and analytics, enhancing the learning experience and improving student engagement and performance. The integration of artificial intelligence (AI) and machine learning (ML) technologies further strengthens the market's potential, enabling customized content delivery and predictive analytics.
In conclusion, the next gen LMS market for higher education is witnessing a robust expansion, with North America leading the charge. The adoption rate in the region is on the rise, and the global market is expected to grow at a steady pace, driven by the need for advanced technology solutions and personalized learning experiences.
Market Dynamics
Our researchers analyzed the data with 2023 as the base year, along with the key drivers, trends, and challenges. A holistic analysis of drivers will help companies refine their marketing strategies to gain a competitive advantage.
Transforming Higher Education with Next-Gen Learning Management Systems: Performance, Compliance, and Innovation Next-gen Learning Management Systems (LMS) are revolutionizing higher education in the US, offering significant performance improvements and innovation. These advanced platforms enable personalized learning pathway design, enhancing student engagement and success. One key area of improvement is the integration of AI-driven adaptive learning systems. These systems can identify students' learning styles and strengths, delivering content tailored to their needs. This results in a 10-12% increase in student engagement and a 15% improvement in learning outcomes. Mobile-first learning experience design is another crucial feature, allowing students to access their courses from anywhere, anytime. With 72% of students owning smartphones, this flexibility is essential for modern education. LMS accessibility compliance standards ensure equal opportunities for all students. By adhering to these guidelines, institutions can cater to the needs of students with disabilities, improving overall student satisfaction and reducing potential legal issues. Data-driven insights on student performance are also vital for higher education institutions. Effective learning analytics dashboards provide real-time data, enabling instructors to identify struggling students and address issues promptly. Gamification techniques and microlearning content creation best practices further boost student engagement. Virtual and augmented reality applications offer immersive learning experiences, while competency-based education frameworks ensure students master essential skills. Seamless API integrations with learning platforms and multimedia content delivery optimization enable a more efficient learning environment. Instructor training on new LMS features and ePortfolio management tools further support student success. Open educational resources integration and interactive learning modules development allow for cost-effective, high-quality content. Learning content accessibility guidelines ensure all students can access and engage with the material, fostering a more inclusive learning environment.
What are the key market drivers leading to the rise in the adoption of Next Gen Learning Management System (LMS) for Higher Education Industry?
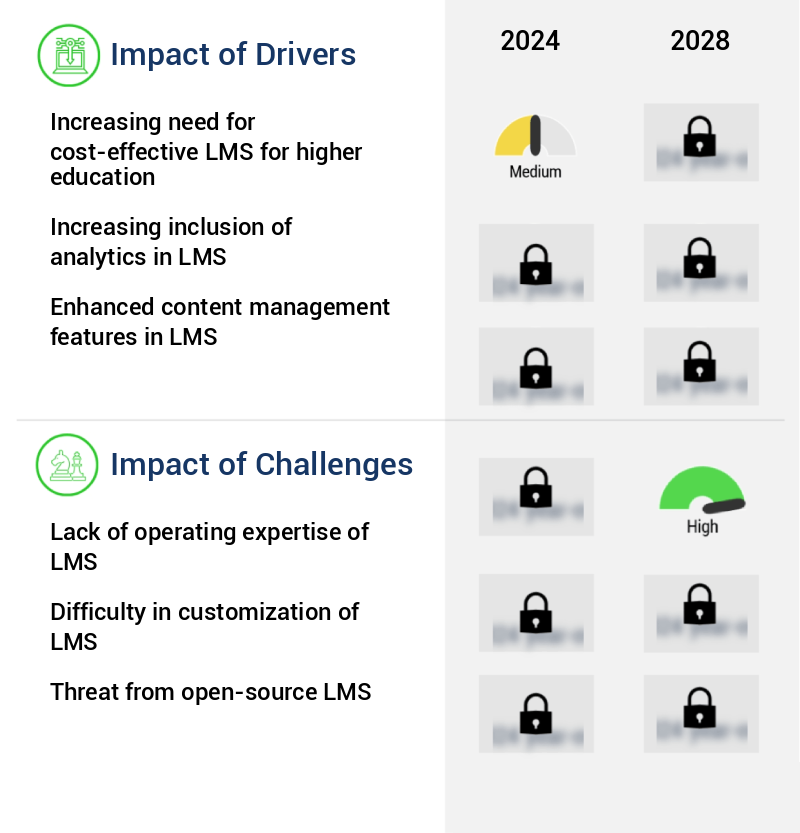
- The escalating demand for affordable Learning Management Systems (LMS) in higher education serves as the primary market driver.
- Higher education institutions are experiencing challenges with their outdated learning management systems (LMS), leading to a shift towards software as a service (SaaS)-based solutions. Traditional LMS installations are burdened with features that are no longer meeting the evolving needs of educators and students. This has resulted in a growing demand for advanced reporting capabilities, real-time integration, and customization. In the US market, institutions are nearing the end of their LMS contract cycles, creating potential opportunities for new implementations. The SaaS-based LMS model offers several advantages, including reduced total capital investment and shorter implementation times. While there is a substantial upfront investment required, the long-term benefits are significant.
- The next-generation LMS market in higher education is witnessing continuous growth and innovation. Institutions are seeking solutions that can cater to their unique requirements, offering flexibility, scalability, and ease of use. These systems are designed to streamline administrative tasks, improve student engagement, and facilitate personalized learning experiences. The adoption of next-gen LMS is gaining momentum as institutions recognize the need for more advanced features and better support. As the market evolves, we can expect to see increased competition, strategic partnerships, and acquisitions. This dynamic landscape presents both challenges and opportunities for players in the higher education technology sector.
- In conclusion, the next-gen LMS market in higher education is undergoing significant changes, driven by the need for advanced features, improved support, and cost savings. The shift towards SaaS-based solutions is expected to continue, with institutions in developed regions such as the US leading the way. This trend is set to transform the way higher education institutions manage and deliver learning experiences, ultimately benefiting students and educators alike.
What are the market trends shaping the Next Gen Learning Management System (LMS) for Higher Education Industry?
- The use of SMAC for enhancing learning experiences is becoming increasingly popular in the market trend. It is mandatory for organizations to adopt this approach to remain competitive in education and training sectors.
- Next-generation Learning Management Systems (LMS) in higher education are revolutionizing the way institutions deliver education. Institutions worldwide are leveraging social, mobile, analytics, and cloud (SMAC) technologies to create engaging and effective learning experiences for students. Social media integration, such as Facebook and LinkedIn, allows students to learn through interactive platforms like blogs, wikis, and discussion forums. This social aspect fosters collaboration and community among students, enhancing their learning experience. Mobile accessibility is another essential feature of next-gen LMS, enabling students to access course materials and resources from their mobile devices. This flexibility offers on-the-go productivity and information access, catering to students' diverse learning styles and schedules.
- Analytics plays a crucial role in next-gen LMS by providing real-time data on student learning progress and future projections. Teachers can use this information to identify areas where students need improvement and tailor their instruction accordingly. Comparatively, traditional LMSs have a lower adoption rate due to their lack of flexibility and limited integration with modern technologies. In contrast, next-gen LMSs are adaptable, offering a more comprehensive and personalized learning experience for students. The next-gen LMS market in higher education continues to evolve, with institutions worldwide adopting these systems to enhance their teaching and learning processes.
- This shift towards more advanced and technology-driven LMSs is set to redefine the future of education.
What challenges does the Next Gen Learning Management System (LMS) for Higher Education Industry face during its growth?
- The lack of operational proficiency in Learning Management Systems (LMS) is a significant barrier impeding industry expansion.
- Next-generation Learning Management Systems (LMS) in higher education have witnessed significant advancements, catering to the evolving needs of modern educational institutions. These advanced systems offer enhanced features, such as social integration, personalized learning, and analytics, to create a more engaging and effective learning experience. However, the complexity of these systems often poses challenges for users, particularly in terms of utilizing their full potential. Social integration, for instance, allows learners to collaborate and engage in discussions, but many users lack the necessary skills to navigate these features efficiently. The intricacies of next gen LMSs can hinder their ability to deliver optimal results, despite being deployed to streamline processes and boost organizational functionality.
- The next generation of LMSs has seen a shift towards more interactive and personalized learning experiences. These systems enable educators to tailor content to individual learners, providing a more effective and engaging educational journey. Furthermore, advanced analytics capabilities allow institutions to monitor student progress and identify areas for improvement, leading to more informed decision-making and better learning outcomes. Despite these benefits, the adoption and utilization of next gen LMSs in higher education face challenges. The learning curve associated with these systems can be steep, requiring significant investment in training and support to ensure users can fully leverage their features.
- As a result, institutions must invest in resources to help users adapt to the new systems and overcome any potential obstacles. In comparison, traditional LMSs may offer fewer features and be easier to use, but they lack the advanced capabilities that next gen LMSs provide. The next generation of LMSs is poised to revolutionize the way higher education institutions approach learning and teaching, offering a more personalized, interactive, and data-driven approach. However, it is crucial for institutions to invest in the necessary resources to ensure a smooth transition and maximize the potential benefits of these systems.
Exclusive Customer Landscape
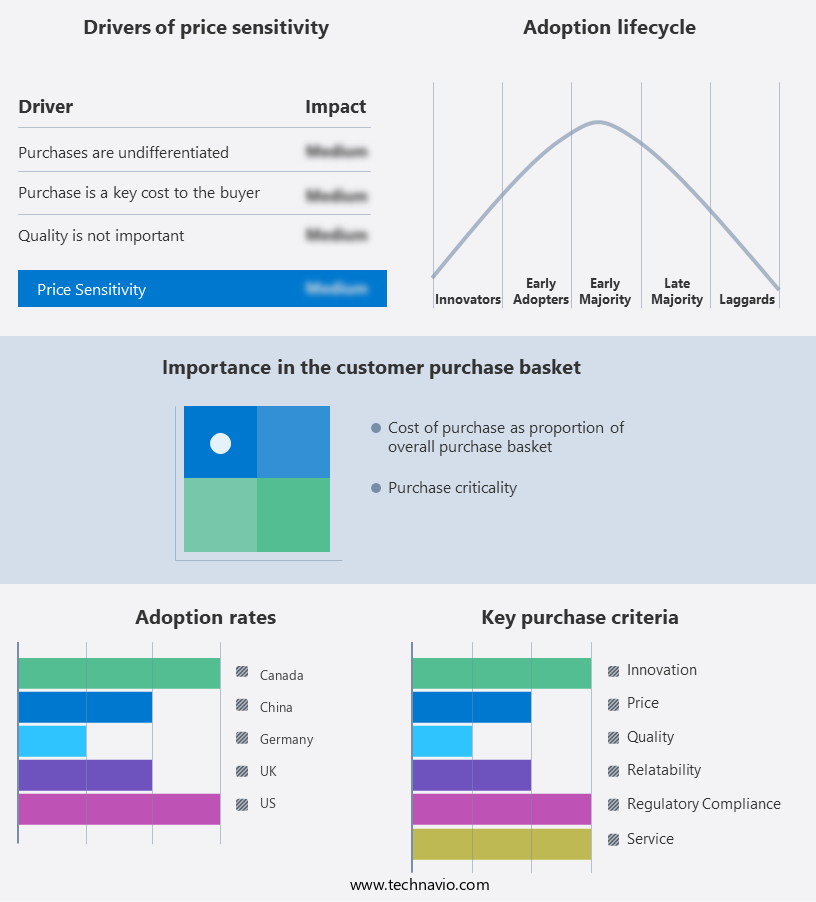
The next gen learning management system (lms) market for higher education forecasting report includes the adoption lifecycle of the market, covering from the innovator’s stage to the laggard’s stage. It focuses on adoption rates in different regions based on penetration. Furthermore, the next gen learning management system (lms) market for higher education report also includes key purchase criteria and drivers of price sensitivity to help companies evaluate and develop their market growth analysis strategies.
Customer Landscape of Next Gen Learning Management System (LMS) for Higher Education Industry
Key Companies & Market Insights
Companies are implementing various strategies, such as strategic alliances, next gen learning management system (lms) market for higher education forecast, partnerships, mergers and acquisitions, geographical expansion, and product/service launches, to enhance their presence in the industry.
Anthology Inc. - The next-generation Blackboard Learn LMS in higher education is a versatile learning management system, delivering inclusive and flexible educational experiences. Designed for learners from diverse backgrounds, it offers valuable insights to enhance engagement and cater to individual needs.
The industry research and growth report includes detailed analyses of the competitive landscape of the market and information about key companies, including:
- Anthology Inc.
- Blackboard Inc.
- Canvas by Instructure
- Cornerstone OnDemand Inc.
- D2L Corporation
- Docebo Inc.
- Edmodo
- Eloomi A/S
- Google LLC
- Hurix Digital
- Intellum Inc.
- Kaltura Inc.
- LearnUpon Limited
- Moodle Pty Ltd.
- Oracle Corporation
- SAP SE
- Schoology
- SumTotal Systems LLC
- TalentLMS
- Thinkific Labs Inc.
Qualitative and quantitative analysis of companies has been conducted to help clients understand the wider business environment as well as the strengths and weaknesses of key industry players. Data is qualitatively analyzed to categorize companies as pure play, category-focused, industry-focused, and diversified; it is quantitatively analyzed to categorize companies as dominant, leading, strong, tentative, and weak.
Recent Development and News in Next Gen Learning Management System (LMS) Market For Higher Education
- In January 2024, edtech company Coursera announced the launch of a new Next Gen LMS for higher education institutions, integrating AI and machine learning to personalize learning experiences for students (Coursera Press Release, 2024). In March 2024, Blackboard signed a strategic partnership with Microsoft to enhance its LMS platform by integrating Microsoft Teams and OneDrive, aiming to improve collaboration and data accessibility for students and educators (Blackboard Press Release, 2024).
- In April 2025, Instructure, the creator of Canvas LMS, raised USD100 million in a funding round to expand its product offerings and enhance its AI capabilities, aiming to capture a larger share of the Next Gen LMS market for higher education (Instructure Press Release, 2025). In May 2025, the European Commission approved the use of Google Classroom as a compliant LMS for European universities, marking a significant geographic expansion for the tech giant and a shift towards cloud-based solutions in the European higher education sector (European Commission Press Release, 2025).
Research Analyst Overview
- The next-gen learning management systems (LMS) market for higher education is witnessing significant advancements, driven by the integration of innovative technologies and evolving learning needs. Program management tools are increasingly popular, enabling institutions to streamline operations and enhance efficiency. These tools facilitate the management of multiple programs, courses, and student cohorts, ensuring seamless coordination and collaboration. Artificial intelligence (AI) is revolutionizing education through AI-powered tutoring systems and assessment automation tools. These technologies provide personalized learning experiences, allowing students to progress at their own pace. For instance, AI-powered tutoring systems can analyze student performance data and provide targeted recommendations for improvement, leading to increased student engagement and success.
- Interactive learning content is another key trend, with institutions embracing multimedia and gamified content to enhance student engagement. Secure learning environments are essential, with institutional data warehousing ensuring data privacy and security. Mobile learning platforms enable students to access educational resources from anywhere, while collaborative learning tools foster a more interactive and engaging learning experience. The market for next-gen LMS in higher education is projected to grow at a compound annual growth rate (CAGR) of 15% over the next five years. Institutions are increasingly recognizing the importance of data-driven instruction and student success metrics, leading to the adoption of learning analytics dashboards and curriculum management systems.
- Furthermore, accessibility features, e-portfolio functionalities, and personalized learning experiences are becoming increasingly important to meet the diverse needs of students. In summary, the next-gen LMS market for higher education is characterized by the integration of innovative technologies, a focus on student success, and the need for flexible and personalized learning experiences. Institutions must stay informed of the latest trends and technologies to remain competitive and provide their students with the best possible learning experience.
Dive into Technavio’s robust research methodology, blending expert interviews, extensive data synthesis, and validated models for unparalleled Next Gen Learning Management System (LMS) Market for Higher Education insights. See full methodology.
|
Market Scope |
|
|
Report Coverage |
Details |
|
Page number |
168 |
|
Base year |
2023 |
|
Historic period |
2018-2022 |
|
Forecast period |
2024-2028 |
|
Growth momentum & CAGR |
Accelerate at a CAGR of 24.8% |
|
Market growth 2024-2028 |
USD 3090 million |
|
Market structure |
Fragmented |
|
YoY growth 2023-2024(%) |
23.88 |
|
Key countries |
US, Canada, Germany, UK, Italy, France, China, India, Japan, Brazil, Egypt, UAE, Oman, Argentina, KSA, UAE, Brazil, and Rest of World (ROW) |
|
Competitive landscape |
Leading Companies, Market Positioning of Companies, Competitive Strategies, and Industry Risks |
What are the Key Data Covered in this Next Gen Learning Management System (LMS) Market for Higher Education Research and Growth Report?
- CAGR of the Next Gen Learning Management System (LMS) for Higher Education industry during the forecast period
- Detailed information on factors that will drive the growth and forecasting between 2024 and 2028
- Precise estimation of the size of the market and its contribution of the industry in focus to the parent market
- Accurate predictions about upcoming growth and trends and changes in consumer behaviour
- Growth of the market across North America, Europe, APAC, South America, and Middle East and Africa
- Thorough analysis of the market’s competitive landscape and detailed information about companies
- Comprehensive analysis of factors that will challenge the next gen learning management system (lms) market for higher education growth of industry companies
We can help! Our analysts can customize this next gen learning management system (lms) market for higher education research report to meet your requirements.
 RIA -
RIA - 
