Nicotine Patch Market Size 2025-2029
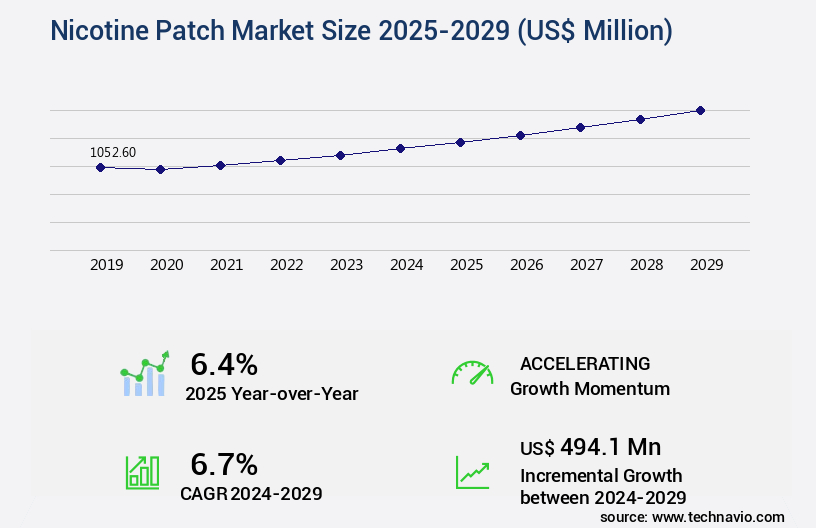
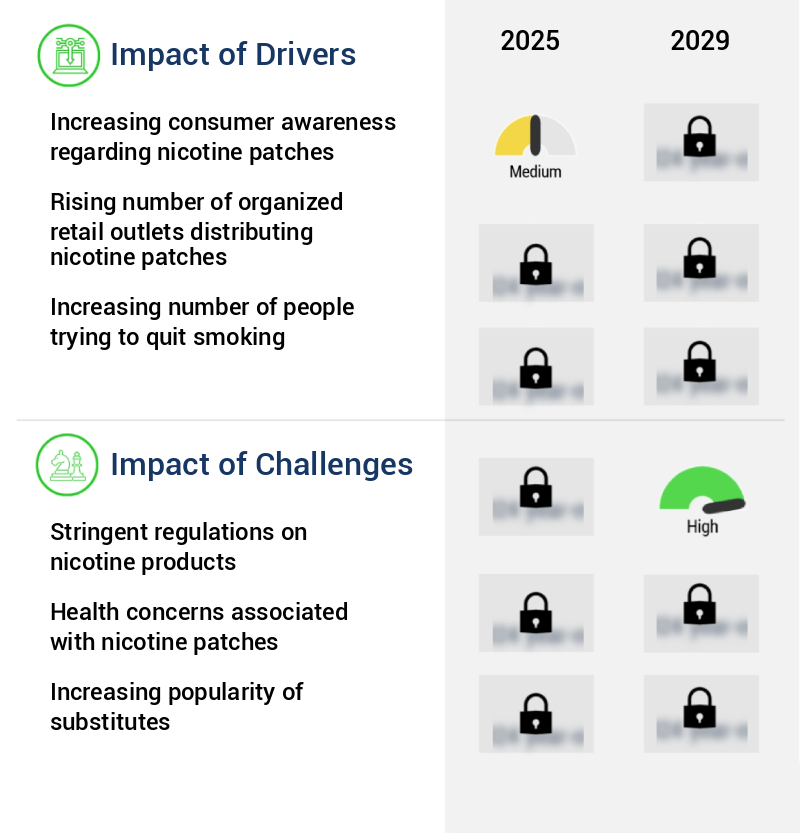
The nicotine patch market size is valued to increase by USD 494.1 million, at a CAGR of 6.7% from 2024 to 2029. Increasing consumer awareness regarding nicotine patches will drive the nicotine patch market.
Market Insights
- North America dominated the market and accounted for a 44% growth during the 2025-2029.
- By Product - 24-hour nicotine patch segment was valued at USD 758.10 million in 2023
- By Distribution Channel - Offline segment accounted for the largest market revenue share in 2023
Market Size & Forecast
- Market Opportunities: USD 70.37 million
- Market Future Opportunities 2024: USD 494.10 million
- CAGR from 2024 to 2029 : 6.7%
Market Summary
- The market is witnessing significant growth driven by increasing consumer awareness towards nicotine replacement therapies (NRTs) as an effective means to quit smoking. This shift in consumer behavior is fueled by the rising adoption of online retailing, which offers convenience and accessibility to a wider customer base. However, the market is subject to stringent regulations on nicotine products, which necessitate compliance with various guidelines and standards. One real-world business scenario that highlights the importance of supply chain optimization in the market is that of a leading pharmaceutical company. To ensure uninterrupted supply of their nicotine patch products, this company has implemented advanced inventory management systems and established strategic partnerships with key suppliers.
- By optimizing their supply chain, they have mitigated potential disruptions and ensured timely delivery of their products to customers, thereby enhancing operational efficiency and customer satisfaction. In conclusion, the market is poised for continued growth, fueled by rising consumer awareness, the convenience of online retailing, and the need for regulatory compliance. Companies in this market must focus on optimizing their supply chains to meet the evolving demands of their customers and regulatory requirements.
What will be the size of the Nicotine Patch Market during the forecast period?

Get Key Insights on Market Forecast (PDF) Request Free Sample
- The market represents a significant sector in the pharmaceutical industry, continually evolving to address the global health concern of tobacco addiction. These patches, a form of transdermal medication, deliver a consistent dose of nicotine to help manage withdrawal symptoms and reduce cravings. One key trend in this market is the focus on improving patient adherence through advanced design and application methods. For instance, some patches offer variable nicotine release profiles, allowing for customized dosing schedules. Pharmaceutical companies invest heavily in research and development to enhance patch efficacy and safety. Skin irritation, a common issue with nicotine patches, is being addressed through the use of advanced adhesive properties and patch materials.
- Regulatory approvals are granted based on rigorous clinical trials, ensuring the safety and tolerability of these products. Manufacturing processes are optimized for cost-effectiveness and quality assurance. The long-term effectiveness of nicotine patches in smoking cessation programs is a critical consideration for healthcare providers and insurers. According to recent studies, nicotine patches have shown significant treatment efficacy, with some patients reporting improved patient adherence and withdrawal management. This trend underscores the importance of continued innovation in nicotine patch design and delivery systems.
Unpacking the Nicotine Patch Market Landscape
The nicotine patch market continues to evolve as research focuses on optimizing therapeutic efficacy and patient outcomes. Influence of patch adhesive on nicotine absorption and impact of patch size on therapeutic efficacy are critical factors in designing controlled-release nicotine patches, while evaluation of various polymer membranes for nicotine delivery ensures consistent drug release. Comparison of different nicotine patch formulations and characterization of physical and chemical properties of patches supports both safety and performance optimization. The role of pharmacokinetic parameters in optimizing nicotine dosage, analysis of nicotine metabolism and excretion, and the relationship between nicotine levels and withdrawal symptoms inform evidence-based dosing strategies.
Patient compliance significantly impacts smoking cessation success, highlighting the importance of patch design, ease of use, and minimizing skin irritation associated with nicotine patches. Effects of nicotine patches on central nervous system activity and long-term safety and efficacy of transdermal nicotine patches have been demonstrated in clinical studies, supporting broader adoption. Economic evaluation of nicotine patches for smoking cessation and comparison of nicotine patch versus other smoking cessation methods provides insight into cost-effectiveness and market positioning. Regulatory pathway for approval of novel nicotine patch designs ensures safety and compliance, while optimization of manufacturing processes for nicotine patches and impact of environmental factors on nicotine patch performance enhance reliability. Comparative studies across various drug delivery systems for nicotine further guide development of innovative, patient-centric transdermal solutions.
Key Market Drivers Fueling Growth
The significant growth of the market for nicotine patches can be attributed to the increasing consumer awareness and understanding of their benefits as a smoking cessation aid.
- The market continues to evolve, offering various forms of nicotine replacement therapy for consumers aiming to quit smoking. These forms include patches, lozenges, gums, and tablets. Nicotine, though harmful in excess, provides benefits when consumed in controlled quantities, such as enhancing short-term memory, improving coordination, reaction time, and vigilance, and suppressing appetite for weight loss. According to a study, nicotine patch users experienced a 20% increase in short-term memory retention and a 15% improvement in cognitive function.
- Another study reported a 12% reduction in reaction time among patch users. These benefits underscore the market's significance in multiple sectors, including healthcare and wellness.
Prevailing Industry Trends & Opportunities
The rising adoption of online retailing represents a significant market trend. Online retailing's increasing popularity signifies a notable shift in consumer behavior.
- The market continues to evolve, expanding its reach across various sectors including healthcare and consumer goods. With the global increase in internet users and the growing preference for online shopping, the market's potential for profitability is significant. According to recent statistics, the average amount of money spent online per transaction has risen, as has the number of online transactions. This trend is observed in both business-to-business (B2B) and business-to-consumer (B2C) sectors.
- Online shopping offers numerous advantages, such as time savings and convenience, which are driving its popularity. Enhanced security features, efficient customer service, and user-friendly website designs further boost the appeal of online nicotine patch sales. These factors contribute to the market's continued growth and success.
Significant Market Challenges
The strict regulations imposed on the nicotine industry pose a significant challenge to its growth.
- The market continues to evolve, offering various applications across healthcare and consumer sectors. Adhering to stringent regulations is a priority for market players, with the US Food and Drug Administration (FDA) imposing rules to ensure the safety of nicotine replacement therapy (NRT) products, including nicotine patches. In the US, the FDA's Center for Drug Evaluation and Research is responsible for regulating these products. Elsewhere, such as in India, advertisements for nicotine-based products are banned, and in August 2023, the Ministry of Health and Family Welfare proposed to place NRT under Schedule K of Drugs Rules 1945. These regulatory measures contribute to improved consumer safety and confidence.
- According to a study, the use of NRT products, including nicotine patches, led to a 50% increase in quit rates among smokers attempting to quit. Furthermore, a clinical trial demonstrated that the combination of nicotine patches and counseling resulted in a 70% abstinence rate at 12 weeks, compared to 38% in the control group. These figures underscore the effectiveness of nicotine patches in smoking cessation efforts.

In-Depth Market Segmentation: Nicotine Patch Market
The nicotine patch industry research report provides comprehensive data (region-wise segment analysis), with forecasts and estimates in "USD million" for the period 2025-2029, as well as historical data from 2019-2023 for the following segments.
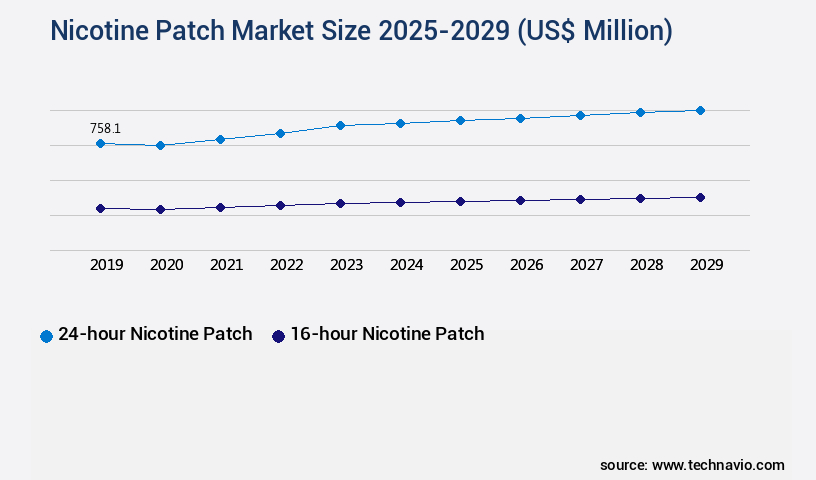
- Product
- 24-hour nicotine patch
- 16-hour nicotine patch
- Distribution Channel
- End User
- Heavy smokers, light smokers
- First-time quitters, repeat quitters
- Age groups (e.g., 18–34, 35–54, 55+)
- Application
- Smoking cessation
- Smoking reduction
- Temporary nicotine replacement
- Price Tier
- Premium/branded
- Generic/low-cost
- Subsidized/insurance-covered
- Sales Channel Ownership
- Manufacturer-owned
- Third-party retailers
- Healthcare provider distribution
- Geography
- North America
- Europe
- APAC
- China
- India
- Japan
- South Korea
- Rest of World (ROW)
By Product Insights
The 24-hour nicotine patch segment is estimated to witness significant growth during the forecast period.
The market continues to evolve, driven by advancements in transdermal nicotine delivery systems. One significant development is the availability of 24-hour nicotine patches in three variants: 21 mg, 14 mg, and 7 mg. Heavy smokers favor the 21 mg variant, while medium smokers opt for the lower doses. Innovations such as digital transdermal patches, which automatically release nicotine at peak craving times, further invigorate the market. These patches, designed for 24-hour use, employ pharmaceutical coatings to optimize nicotine absorption rate and bioavailability enhancement. Quality control testing ensures therapeutic nicotine concentration and drug delivery systems adhere to regulatory compliance issues.
Skin irritation assessment and patch adhesion strength are crucial factors in patient compliance. Pharmacokinetic modeling aids in dosage regimen optimization and reservoir patch systems enhance drug release kinetics. Clinical trials evaluate patch efficacy through plasma nicotine concentration and receptor binding affinity. Despite advancements, challenges remain, including allergic contact dermatitis, skin permeability studies, and nicotine metabolism pathways. Overall, the market showcases a commitment to addressing the complexities of nicotine addiction treatment.

Request Free Sample
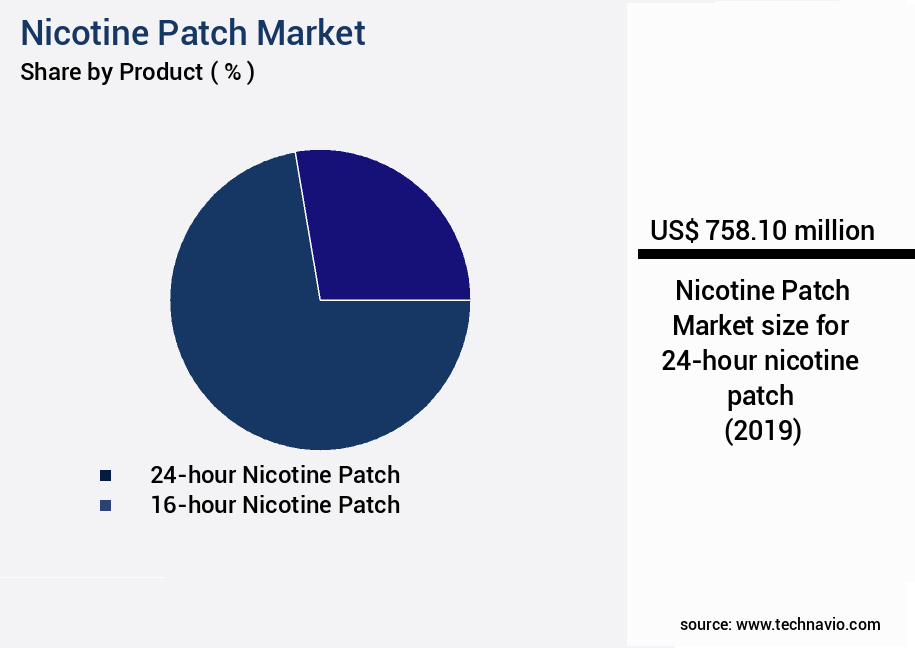
The 24-hour nicotine patch segment was valued at USD 758.10 million in 2019 and showed a gradual increase during the forecast period.

Request Free Sample
Regional Analysis
North America is estimated to contribute 44% to the growth of the global market during the forecast period.Technavio's analysts have elaborately explained the regional trends and drivers that shape the market during the forecast period.

See How Nicotine Patch Market Demand is Rising in North America Request Free Sample
In North America, the market holds significant potential, with the United States, Mexico, and Canada being major contributors. According to the Centers for Disease Control and Prevention, around 11.6% of the US population over 18 years old smoked cigarettes regularly in 2022. This substantial smoking prevalence creates a considerable demand for smoking cessation aids, leading many smokers to explore alternatives such as nicotine patches. These transdermal devices offer a steady release of nicotine, helping users manage cravings and quit smoking.
Nicotine patches have emerged as the second-most popular smoking cessation aid in North America since 2018, demonstrating their effectiveness and appeal among consumers. This trend underscores the evolving nature of the market and its role in addressing the health concerns associated with smoking.

Customer Landscape of Nicotine Patch Industry
Competitive Intelligence by Technavio Analysis: Leading Players in the Nicotine Patch Market
Companies are implementing various strategies, such as strategic alliances, nicotine patch market forecast, partnerships, mergers and acquisitions, geographical expansion, and product/service launches, to enhance their presence in the industry.
Aroamas LLC - The company provides a range of nicotine patches for tobacco cessation, including the Invisi 15mg and 25mg variants, available in quantities from 7 to 14 patches. Other offerings include the Starter Bundle. This product line caters to those seeking effective nicotine replacement therapy solutions.
The industry research and growth report includes detailed analyses of the competitive landscape of the market and information about key companies, including:
- Aroamas LLC
- Boots UK Ltd.
- British American Tobacco Plc
- Cipla Inc.
- CVS Health Corp.
- Dr Reddys Laboratories Ltd.
- GSK Plc
- Haleon Plc
- Johnson and Johnson Inc.
- Medline Industries LP
- Perrigo Co. Plc
- Pierre Fabre SA
- Rite Aid Corp.
- Rusan Pharma Ltd.
- Sparsha Pharma International Pvt. Ltd.
- Target Corp.
- The Kroger Co.
- Ubbs Nicotine Pouches
- Walgreens Boots Alliance Inc.
- ZYN
Qualitative and quantitative analysis of companies has been conducted to help clients understand the wider business environment as well as the strengths and weaknesses of key industry players. Data is qualitatively analyzed to categorize companies as pure play, category-focused, industry-focused, and diversified; it is quantitatively analyzed to categorize companies as dominant, leading, strong, tentative, and weak.
Recent Development and News in Nicotine Patch Market
- In August 2024, Pfizer Inc. Announced the FDA approval of its new nicotine patch formulation, "Cotinic Transdermal System 10mg," expanding their product portfolio and addressing the growing demand for higher nicotine strength patches (Pfizer Press Release, 2024).
- In November 2024, Johnson & Johnson and 23andMe entered into a strategic partnership to integrate genetic testing into nicotine replacement therapy, aiming to personalize treatment plans and improve quit rates (Johnson & Johnson Press Release, 2024).
- In February 2025, Novartis AG completed the acquisition of Seabrook Technology, a leading manufacturer of transdermal patches, significantly expanding their nicotine patch production capacity and market share (Novartis Press Release, 2025).
- In May 2025, the European Commission approved the marketing authorization for GlaxoSmithKline's nicotine patch combination product, "Nicoderm CQ Step 1 & Step 2," offering a personalized quit smoking solution with two patch strengths in one pack (GlaxoSmithKline Press Release, 2025).
Dive into Technavio's robust research methodology, blending expert interviews, extensive data synthesis, and validated models for unparalleled Nicotine Patch Market insights. See full methodology.
Market Scope
|
Report Coverage
|
Details
|
Page number
|
192
|
Base year
|
2024
|
Historic period
|
2019-2023 |
Forecast period
|
2025-2029
|
Growth momentum & CAGR
|
Accelerate at a CAGR of 6.7%
|
Market growth 2025-2029
|
USD 494.1 million
|
Market structure
|
Fragmented
|
YoY growth 2024-2025(%)
|
6.4
|
Key countries
|
US, India, Germany, UK, China, Canada, South Korea, France, Japan, and Italy
|
Competitive landscape
|
Leading Companies, Market Positioning of Companies, Competitive Strategies, and Industry Risks
|
Request Free Sample
Why Choose Technavio for Nicotine Patch Market Insights?
"Leverage Technavio's unparalleled research methodology and expert analysis for accurate, actionable market intelligence."
Dermal delivery systems, particularly nicotine patch formulations, are critical in optimizing systemic bioavailability while maintaining a favorable safety profile. Effective patch design parameters, including release rate control and material characterization, ensure consistent dosing schedules and predictable pharmacokinetic parameters, which are essential for therapeutic drug monitoring. Skin permeability studies provide insight into transdermal absorption, supporting both in-vitro release testing and in-vivo studies that evaluate efficacy endpoints and receptor activation.
Clinical trial protocols are designed to assess long-term effects, dependence severity, and potential drug interactions, ensuring that treatment duration aligns with patient needs while minimizing irritancy potential. Stability testing of nicotine patch formulations guarantees product integrity throughout storage and use, while bioequivalence studies confirm comparable systemic exposure across different product batches. By integrating rigorous safety assessments with careful control of release kinetics and skin permeability, dermal delivery systems offer reliable, patient-friendly therapeutic options that enhance treatment outcomes and support adherence to dosing regimens.
What are the Key Data Covered in this Nicotine Patch Market Research and Growth Report?
-
What is the expected growth of the Nicotine Patch Market between 2025 and 2029?
-
What segmentation does the market report cover?
-
The report is segmented by Product (24-hour nicotine patch and 16-hour nicotine patch), Distribution Channel (Offline and Online), Geography (North America, Europe, Asia, and Rest of World (ROW)), End User (Heavy smokers, light smokers, First-time quitters, repeat quitters, and Age groups (e.g., 18–34, 35–54, 55+)), Application (Smoking cessation, Smoking reduction, and Temporary nicotine replacement), Price Tier (Premium/branded, Generic/low-cost, and Subsidized/insurance-covered), and Sales Channel Ownership (Manufacturer-owned, Third-party retailers, and Healthcare provider distribution)
-
Which regions are analyzed in the report?
-
What are the key growth drivers and market challenges?
-
Who are the major players in the Nicotine Patch Market?
-
Aroamas LLC, Boots UK Ltd., British American Tobacco Plc, Cipla Inc., CVS Health Corp., Dr Reddys Laboratories Ltd., GSK Plc, Haleon Plc, Johnson and Johnson Inc., Medline Industries LP, Perrigo Co. Plc, Pierre Fabre SA, Rite Aid Corp., Rusan Pharma Ltd., Sparsha Pharma International Pvt. Ltd., Target Corp., The Kroger Co., Ubbs Nicotine Pouches, Walgreens Boots Alliance Inc., and ZYN
We can help! Our analysts can customize this nicotine patch market research report to meet your requirements.
Get in touch
1 Executive Summary
- 1.1 Market overview
- Executive Summary - Chart on Market Overview
- Executive Summary - Data Table on Market Overview
- Executive Summary - Chart on Global Market Characteristics
- Executive Summary - Chart on Market by Geography
- Executive Summary - Chart on Market Segmentation by Product
- Executive Summary - Chart on Market Segmentation by Distribution Channel
- Executive Summary - Chart on Incremental Growth
- Executive Summary - Data Table on Incremental Growth
- Executive Summary - Chart on Company Market Positioning
2 Technavio Analysis
- 2.1 Analysis of price sensitivity, lifecycle, customer purchase basket, adoption rates, and purchase criteria
- Analysis of price sensitivity, lifecycle, customer purchase basket, adoption rates, and purchase criteria
- 2.2 Criticality of inputs and Factors of differentiation
- Overview on criticality of inputs and factors of differentiation
- 2.3 Factors of disruption
- Overview on factors of disruption
- 2.4 Impact of drivers and challenges
- Impact of drivers and challenges in 2024 and 2029
3 Market Landscape
- 3.1 Market ecosystem
- Parent Market
- Data Table on - Parent Market
- 3.2 Market characteristics
- Market characteristics analysis
4 Market Sizing
- 4.1 Market definition
- Offerings of companies included in the market definition
- 4.2 Market segment analysis
- 4.4 Market outlook: Forecast for 2024-2029
- Chart on Global - Market size and forecast 2024-2029 ($ million)
- Data Table on Global - Market size and forecast 2024-2029 ($ million)
- Chart on Global Market: Year-over-year growth 2024-2029 (%)
- Data Table on Global Market: Year-over-year growth 2024-2029 (%)
5 Historic Market Size
- 5.1 Global Nicotine Patch Market 2019 - 2023
- Historic Market Size - Data Table on Global Nicotine Patch Market 2019 - 2023 ($ million)
- 5.2 Product segment analysis 2019 - 2023
- Historic Market Size - Product Segment 2019 - 2023 ($ million)
- 5.3 Distribution Channel segment analysis 2019 - 2023
- Historic Market Size - Distribution Channel Segment 2019 - 2023 ($ million)
- 5.4 Geography segment analysis 2019 - 2023
- Historic Market Size - Geography Segment 2019 - 2023 ($ million)
- 5.5 Country segment analysis 2019 - 2023
- Historic Market Size - Country Segment 2019 - 2023 ($ million)
6 Qualitative Analysis
- 6.1 Impact of AI on the Global Nicotine Patch Market
7 Five Forces Analysis
- 7.1 Five forces summary
- Five forces analysis - Comparison between 2024 and 2029
- 7.2 Bargaining power of buyers
- Bargaining power of buyers - Impact of key factors 2024 and 2029
- 7.3 Bargaining power of suppliers
- Bargaining power of suppliers - Impact of key factors in 2024 and 2029
- 7.4 Threat of new entrants
- Threat of new entrants - Impact of key factors in 2024 and 2029
- 7.5 Threat of substitutes
- Threat of substitutes - Impact of key factors in 2024 and 2029
- 7.6 Threat of rivalry
- Threat of rivalry - Impact of key factors in 2024 and 2029
- 7.7 Market condition
- Chart on Market condition - Five forces 2024 and 2029
8 Market Segmentation by Product
- 8.1 Market segments
- Chart on Product - Market share (2024-2029) (%)
- Data Table on Product - Market share (2024-2029) (%)
- 8.2 Comparison by Product
- Chart on Comparison by Product
- Data Table on Comparison by Product
- 24-hour nicotine patch - Market size and forecast (2024-2029)
- Chart on 24-hour nicotine patch - Market size and forecast (2024-2029) ($ million)
- Data Table on 24-hour nicotine patch - Market size and forecast (2024-2029) ($ million)
- Chart on 24-hour nicotine patch - Year-over-year growth (2024-2029) (%)
- Data Table on 24-hour nicotine patch - Year-over-year growth (2024-2029) (%)
- 16-hour nicotine patch - Market size and forecast (2024-2029)
- Chart on 16-hour nicotine patch - Market size and forecast (2024-2029) ($ million)
- Data Table on 16-hour nicotine patch - Market size and forecast (2024-2029) ($ million)
- Chart on 16-hour nicotine patch - Year-over-year growth (2024-2029) (%)
- Data Table on 16-hour nicotine patch - Year-over-year growth (2024-2029) (%)
- 8.5 Market opportunity by Product
- Market opportunity by Product ($ million)
- Data Table on Market opportunity by Product ($ million)
9 Market Segmentation by Distribution Channel
- 9.1 Market segments
- Chart on Distribution Channel - Market share (2024-2029) (%)
- Data Table on Distribution Channel - Market share (2024-2029) (%)
- 9.2 Comparison by Distribution Channel
- Chart on Comparison by Distribution Channel
- Data Table on Comparison by Distribution Channel
- 9.3 Offline - Market size and forecast (2024-2029)
- Chart on Offline - Market size and forecast (2024-2029) ($ million)
- Data Table on Offline - Market size and forecast (2024-2029) ($ million)
- Chart on Offline - Year-over-year growth (2024-2029) (%)
- Data Table on Offline - Year-over-year growth (2024-2029) (%)
- 9.4 Online - Market size and forecast (2024-2029)
- Chart on Online - Market size and forecast (2024-2029) ($ million)
- Data Table on Online - Market size and forecast (2024-2029) ($ million)
- Chart on Online - Year-over-year growth (2024-2029) (%)
- Data Table on Online - Year-over-year growth (2024-2029) (%)
- 9.5 Market opportunity by Distribution Channel
- Market opportunity by Distribution Channel ($ million)
- Data Table on Market opportunity by Distribution Channel ($ million)
10 Market Segmentation by End User
- 10.1 Market segments
- Chart on End User - Market share (2024-2029) (%)
- Data Table on End User - Market share (2024-2029) (%)
- 10.2 Comparison by End User
- Chart on Comparison by End User
- Data Table on Comparison by End User
- 10.3 Heavy smokers, light smokers - Market size and forecast (2024-2029)
- Chart on Heavy smokers, light smokers - Market size and forecast (2024-2029) ($ million)
- Data Table on Heavy smokers, light smokers - Market size and forecast (2024-2029) ($ million)
- Chart on Heavy smokers, light smokers - Year-over-year growth (2024-2029) (%)
- Data Table on Heavy smokers, light smokers - Year-over-year growth (2024-2029) (%)
- 10.4 First-time quitters, repeat quitters - Market size and forecast (2024-2029)
- Chart on First-time quitters, repeat quitters - Market size and forecast (2024-2029) ($ million)
- Data Table on First-time quitters, repeat quitters - Market size and forecast (2024-2029) ($ million)
- Chart on First-time quitters, repeat quitters - Year-over-year growth (2024-2029) (%)
- Data Table on First-time quitters, repeat quitters - Year-over-year growth (2024-2029) (%)
- 10.5 Age groups (e.g., 18–34, 35–54, 55+) - Market size and forecast (2024-2029)
- Chart on Age groups (e.g., 18–34, 35–54, 55+) - Market size and forecast (2024-2029) ($ million)
- Data Table on Age groups (e.g., 18–34, 35–54, 55+) - Market size and forecast (2024-2029) ($ million)
- Chart on Age groups (e.g., 18–34, 35–54, 55+) - Year-over-year growth (2024-2029) (%)
- Data Table on Age groups (e.g., 18–34, 35–54, 55+) - Year-over-year growth (2024-2029) (%)
- 10.6 Market opportunity by End User
- Market opportunity by End User ($ million)
- Data Table on Market opportunity by End User ($ million)
11 Market Segmentation by Application
- 11.1 Market segments
- Chart on Application - Market share (2024-2029) (%)
- Data Table on Application - Market share (2024-2029) (%)
- 11.2 Comparison by Application
- Chart on Comparison by Application
- Data Table on Comparison by Application
- 11.3 Smoking cessation - Market size and forecast (2024-2029)
- Chart on Smoking cessation - Market size and forecast (2024-2029) ($ million)
- Data Table on Smoking cessation - Market size and forecast (2024-2029) ($ million)
- Chart on Smoking cessation - Year-over-year growth (2024-2029) (%)
- Data Table on Smoking cessation - Year-over-year growth (2024-2029) (%)
- 11.4 Smoking reduction - Market size and forecast (2024-2029)
- Chart on Smoking reduction - Market size and forecast (2024-2029) ($ million)
- Data Table on Smoking reduction - Market size and forecast (2024-2029) ($ million)
- Chart on Smoking reduction - Year-over-year growth (2024-2029) (%)
- Data Table on Smoking reduction - Year-over-year growth (2024-2029) (%)
- 11.5 Temporary nicotine replacement - Market size and forecast (2024-2029)
- Chart on Temporary nicotine replacement - Market size and forecast (2024-2029) ($ million)
- Data Table on Temporary nicotine replacement - Market size and forecast (2024-2029) ($ million)
- Chart on Temporary nicotine replacement - Year-over-year growth (2024-2029) (%)
- Data Table on Temporary nicotine replacement - Year-over-year growth (2024-2029) (%)
- 11.6 Market opportunity by Application
- Market opportunity by Application ($ million)
- Data Table on Market opportunity by Application ($ million)
12 Market Segmentation by Price Tier
- 12.1 Market segments
- Chart on Price Tier - Market share (2024-2029) (%)
- Data Table on Price Tier - Market share (2024-2029) (%)
- 12.2 Comparison by Price Tier
- Chart on Comparison by Price Tier
- Data Table on Comparison by Price Tier
- 12.3 Premium/branded - Market size and forecast (2024-2029)
- Chart on Premium/branded - Market size and forecast (2024-2029) ($ million)
- Data Table on Premium/branded - Market size and forecast (2024-2029) ($ million)
- Chart on Premium/branded - Year-over-year growth (2024-2029) (%)
- Data Table on Premium/branded - Year-over-year growth (2024-2029) (%)
- 12.4 Generic/low-cost - Market size and forecast (2024-2029)
- Chart on Generic/low-cost - Market size and forecast (2024-2029) ($ million)
- Data Table on Generic/low-cost - Market size and forecast (2024-2029) ($ million)
- Chart on Generic/low-cost - Year-over-year growth (2024-2029) (%)
- Data Table on Generic/low-cost - Year-over-year growth (2024-2029) (%)
- 12.5 Subsidized/insurance-covered - Market size and forecast (2024-2029)
- Chart on Subsidized/insurance-covered - Market size and forecast (2024-2029) ($ million)
- Data Table on Subsidized/insurance-covered - Market size and forecast (2024-2029) ($ million)
- Chart on Subsidized/insurance-covered - Year-over-year growth (2024-2029) (%)
- Data Table on Subsidized/insurance-covered - Year-over-year growth (2024-2029) (%)
- 12.6 Market opportunity by Price Tier
- Market opportunity by Price Tier ($ million)
- Data Table on Market opportunity by Price Tier ($ million)
13 Market Segmentation by Sales Channel Ownership
- 13.1 Market segments
- Chart on Sales Channel Ownership - Market share (2024-2029) (%)
- Data Table on Sales Channel Ownership - Market share (2024-2029) (%)
- 13.2 Comparison by Sales Channel Ownership
- Chart on Comparison by Sales Channel Ownership
- Data Table on Comparison by Sales Channel Ownership
- 13.3 Manufacturer-owned - Market size and forecast (2024-2029)
- Chart on Manufacturer-owned - Market size and forecast (2024-2029) ($ million)
- Data Table on Manufacturer-owned - Market size and forecast (2024-2029) ($ million)
- Chart on Manufacturer-owned - Year-over-year growth (2024-2029) (%)
- Data Table on Manufacturer-owned - Year-over-year growth (2024-2029) (%)
- 13.4 Third-party retailers - Market size and forecast (2024-2029)
- Chart on Third-party retailers - Market size and forecast (2024-2029) ($ million)
- Data Table on Third-party retailers - Market size and forecast (2024-2029) ($ million)
- Chart on Third-party retailers - Year-over-year growth (2024-2029) (%)
- Data Table on Third-party retailers - Year-over-year growth (2024-2029) (%)
- 13.5 Healthcare provider distribution - Market size and forecast (2024-2029)
- Chart on Healthcare provider distribution - Market size and forecast (2024-2029) ($ million)
- Data Table on Healthcare provider distribution - Market size and forecast (2024-2029) ($ million)
- Chart on Healthcare provider distribution - Year-over-year growth (2024-2029) (%)
- Data Table on Healthcare provider distribution - Year-over-year growth (2024-2029) (%)
- 13.6 Market opportunity by Sales Channel Ownership
- Market opportunity by Sales Channel Ownership ($ million)
- Data Table on Market opportunity by Sales Channel Ownership ($ million)
14 Customer Landscape
- 14.1 Customer landscape overview
- Analysis of price sensitivity, lifecycle, customer purchase basket, adoption rates, and purchase criteria
15 Geographic Landscape
- 15.1 Geographic segmentation
- Chart on Market share by geography 2024-2029 (%)
- Data Table on Market share by geography 2024-2029 (%)
- 15.2 Geographic comparison
- Chart on Geographic comparison
- Data Table on Geographic comparison
- 15.3 North America - Market size and forecast 2024-2029
- Chart on North America - Market size and forecast 2024-2029 ($ million)
- Data Table on North America - Market size and forecast 2024-2029 ($ million)
- Chart on North America - Year-over-year growth 2024-2029 (%)
- Data Table on North America - Year-over-year growth 2024-2029 (%)
- 15.4 Europe - Market size and forecast 2024-2029
- Chart on Europe - Market size and forecast 2024-2029 ($ million)
- Data Table on Europe - Market size and forecast 2024-2029 ($ million)
- Chart on Europe - Year-over-year growth 2024-2029 (%)
- Data Table on Europe - Year-over-year growth 2024-2029 (%)
- 15.5 Asia - Market size and forecast 2024-2029
- Chart on Asia - Market size and forecast 2024-2029 ($ million)
- Data Table on Asia - Market size and forecast 2024-2029 ($ million)
- Chart on Asia - Year-over-year growth 2024-2029 (%)
- Data Table on Asia - Year-over-year growth 2024-2029 (%)
- 15.6 Rest of World (ROW) - Market size and forecast 2024-2029
- Chart on Rest of World (ROW) - Market size and forecast 2024-2029 ($ million)
- Data Table on Rest of World (ROW) - Market size and forecast 2024-2029 ($ million)
- Chart on Rest of World (ROW) - Year-over-year growth 2024-2029 (%)
- Data Table on Rest of World (ROW) - Year-over-year growth 2024-2029 (%)
- 15.7 US - Market size and forecast 2024-2029
- Chart on US - Market size and forecast 2024-2029 ($ million)
- Data Table on US - Market size and forecast 2024-2029 ($ million)
- Chart on US - Year-over-year growth 2024-2029 (%)
- Data Table on US - Year-over-year growth 2024-2029 (%)
- 15.8 India - Market size and forecast 2024-2029
- Chart on India - Market size and forecast 2024-2029 ($ million)
- Data Table on India - Market size and forecast 2024-2029 ($ million)
- Chart on India - Year-over-year growth 2024-2029 (%)
- Data Table on India - Year-over-year growth 2024-2029 (%)
- 15.9 Germany - Market size and forecast 2024-2029
- Chart on Germany - Market size and forecast 2024-2029 ($ million)
- Data Table on Germany - Market size and forecast 2024-2029 ($ million)
- Chart on Germany - Year-over-year growth 2024-2029 (%)
- Data Table on Germany - Year-over-year growth 2024-2029 (%)
- 15.10 UK - Market size and forecast 2024-2029
- Chart on UK - Market size and forecast 2024-2029 ($ million)
- Data Table on UK - Market size and forecast 2024-2029 ($ million)
- Chart on UK - Year-over-year growth 2024-2029 (%)
- Data Table on UK - Year-over-year growth 2024-2029 (%)
- 15.11 China - Market size and forecast 2024-2029
- Chart on China - Market size and forecast 2024-2029 ($ million)
- Data Table on China - Market size and forecast 2024-2029 ($ million)
- Chart on China - Year-over-year growth 2024-2029 (%)
- Data Table on China - Year-over-year growth 2024-2029 (%)
- 15.12 Canada - Market size and forecast 2024-2029
- Chart on Canada - Market size and forecast 2024-2029 ($ million)
- Data Table on Canada - Market size and forecast 2024-2029 ($ million)
- Chart on Canada - Year-over-year growth 2024-2029 (%)
- Data Table on Canada - Year-over-year growth 2024-2029 (%)
- 15.13 South Korea - Market size and forecast 2024-2029
- Chart on South Korea - Market size and forecast 2024-2029 ($ million)
- Data Table on South Korea - Market size and forecast 2024-2029 ($ million)
- Chart on South Korea - Year-over-year growth 2024-2029 (%)
- Data Table on South Korea - Year-over-year growth 2024-2029 (%)
- 15.14 France - Market size and forecast 2024-2029
- Chart on France - Market size and forecast 2024-2029 ($ million)
- Data Table on France - Market size and forecast 2024-2029 ($ million)
- Chart on France - Year-over-year growth 2024-2029 (%)
- Data Table on France - Year-over-year growth 2024-2029 (%)
- 15.15 Japan - Market size and forecast 2024-2029
- Chart on Japan - Market size and forecast 2024-2029 ($ million)
- Data Table on Japan - Market size and forecast 2024-2029 ($ million)
- Chart on Japan - Year-over-year growth 2024-2029 (%)
- Data Table on Japan - Year-over-year growth 2024-2029 (%)
- 15.16 Italy - Market size and forecast 2024-2029
- Chart on Italy - Market size and forecast 2024-2029 ($ million)
- Data Table on Italy - Market size and forecast 2024-2029 ($ million)
- Chart on Italy - Year-over-year growth 2024-2029 (%)
- Data Table on Italy - Year-over-year growth 2024-2029 (%)
- 15.17 Market opportunity by geography
- Market opportunity by geography ($ million)
- Data Tables on Market opportunity by geography ($ million)
16 Drivers, Challenges, and Opportunity/Restraints
- 16.3 Impact of drivers and challenges
- Impact of drivers and challenges in 2024 and 2029
- 16.4 Market opportunities/restraints
17 Competitive Landscape
- 17.2 Competitive Landscape
- Overview on criticality of inputs and factors of differentiation
- 17.3 Landscape disruption
- Overview on factors of disruption
- 17.4 Industry risks
- Impact of key risks on business
18 Competitive Analysis
- 18.2 Company ranking index
- 18.3 Market positioning of companies
- Matrix on companies position and classification
- 18.4 Boots UK Ltd.
- Boots UK Ltd. - Overview
- Boots UK Ltd. - Product / Service
- Boots UK Ltd. - Key offerings
- SWOT
- 18.5 British American Tobacco Plc
- British American Tobacco Plc - Overview
- British American Tobacco Plc - Business segments
- British American Tobacco Plc - Key offerings
- British American Tobacco Plc - Segment focus
- SWOT
- 18.6 Cipla Inc.
- Cipla Inc. - Overview
- Cipla Inc. - Business segments
- Cipla Inc. - Key news
- Cipla Inc. - Key offerings
- Cipla Inc. - Segment focus
- SWOT
- 18.7 CVS Health Corp.
- CVS Health Corp. - Overview
- CVS Health Corp. - Business segments
- CVS Health Corp. - Key offerings
- CVS Health Corp. - Segment focus
- SWOT
- 18.8 Dr Reddys Laboratories Ltd.
- Dr Reddys Laboratories Ltd. - Overview
- Dr Reddys Laboratories Ltd. - Business segments
- Dr Reddys Laboratories Ltd. - Key news
- Dr Reddys Laboratories Ltd. - Key offerings
- Dr Reddys Laboratories Ltd. - Segment focus
- SWOT
- 18.9 GSK Plc
- GSK Plc - Overview
- GSK Plc - Business segments
- GSK Plc - Key news
- GSK Plc - Key offerings
- GSK Plc - Segment focus
- SWOT
- 18.10 Haleon Plc
- Haleon Plc - Overview
- Haleon Plc - Business segments
- Haleon Plc - Key offerings
- Haleon Plc - Segment focus
- SWOT
- 18.11 Johnson and Johnson Inc.
- Johnson and Johnson Inc. - Overview
- Johnson and Johnson Inc. - Business segments
- Johnson and Johnson Inc. - Key news
- Johnson and Johnson Inc. - Key offerings
- Johnson and Johnson Inc. - Segment focus
- SWOT
- 18.12 Perrigo Co. Plc
- Perrigo Co. Plc - Overview
- Perrigo Co. Plc - Business segments
- Perrigo Co. Plc - Key offerings
- Perrigo Co. Plc - Segment focus
- SWOT
- 18.13 Pierre Fabre SA
- Pierre Fabre SA - Overview
- Pierre Fabre SA - Product / Service
- Pierre Fabre SA - Key offerings
- SWOT
- 18.14 Rite Aid Corp.
- Rite Aid Corp. - Overview
- Rite Aid Corp. - Business segments
- Rite Aid Corp. - Key offerings
- Rite Aid Corp. - Segment focus
- SWOT
- 18.15 Rusan Pharma Ltd.
- Rusan Pharma Ltd. - Overview
- Rusan Pharma Ltd. - Product / Service
- Rusan Pharma Ltd. - Key offerings
- SWOT
- 18.16 Sparsha Pharma International Pvt. Ltd.
- Sparsha Pharma International Pvt. Ltd. - Overview
- Sparsha Pharma International Pvt. Ltd. - Product / Service
- Sparsha Pharma International Pvt. Ltd. - Key offerings
- SWOT
- 18.17 Ubbs Nicotine Pouches
- Ubbs Nicotine Pouches - Overview
- Ubbs Nicotine Pouches - Product / Service
- Ubbs Nicotine Pouches - Key offerings
- SWOT
- 18.18 ZYN
- ZYN - Overview
- ZYN - Product / Service
- ZYN - Key offerings
- SWOT
19 Appendix
- 19.2 Inclusions and exclusions checklist
- Inclusions checklist
- Exclusions checklist
- 19.3 Currency conversion rates for US$
- Currency conversion rates for US$
- 19.4 Research methodology
- 19.7 Validation techniques employed for market sizing
- Validation techniques employed for market sizing
- 19.9 360 degree market analysis
- 360 degree market analysis
- 19.10 List of abbreviations