Non-Invasive Intracranial Pressure Monitoring Devices Market Size 2025-2029
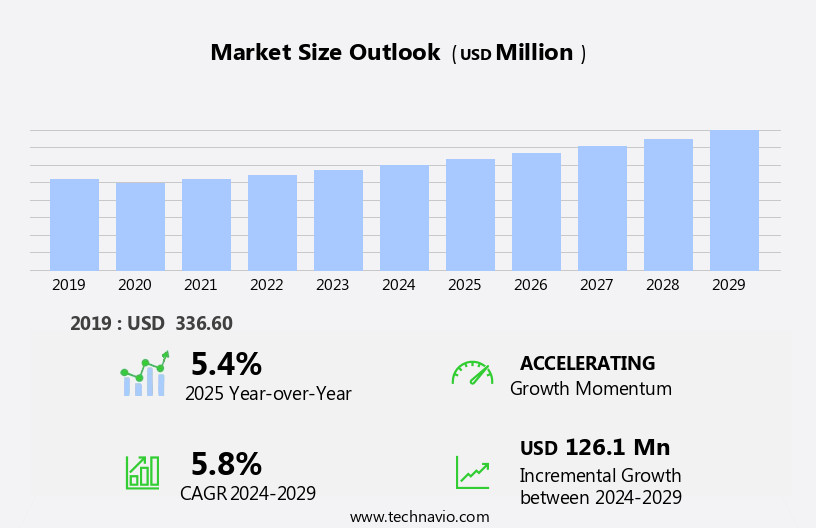
The non-invasive intracranial pressure monitoring devices market size is forecast to increase by USD 126.1 million, at a CAGR of 5.8% between 2024 and 2029.
- The Non-Invasive Intracranial Pressure (ICP) Monitoring Devices market is experiencing significant growth due to increasing awareness of these devices' benefits. This trend is driven by the growing number of clinical studies and research activities focused on non-invasive ICP monitoring techniques. However, the market faces challenges from the widespread availability and use of invasive ICP monitoring devices. Despite this competition, non-invasive ICP monitoring devices offer advantages such as improved patient comfort and reduced risk of complications associated with invasive procedures. Companies seeking to capitalize on market opportunities should focus on enhancing the accuracy and reliability of non-invasive ICP monitoring technologies to differentiate themselves from invasive alternatives.
- Additionally, collaborations with healthcare institutions and research organizations can help drive innovation and expand market reach. Overall, the Non-Invasive ICP Monitoring Devices market holds potential for significant growth, with opportunities for companies to address unmet clinical needs and improve patient care.
What will be the Size of the Non-Invasive Intracranial Pressure Monitoring Devices Market during the forecast period?
Explore in-depth regional segment analysis with market size data - historical 2019-2023 and forecasts 2025-2029 - in the full report.
Request Free Sample
The market continues to evolve, driven by advancements in technology and the growing demand for improved patient safety and clinical outcomes in critical care medicine. These devices, which utilize various techniques such as data acquisition, clinical trials, early warning systems, data visualization, and predictive analytics, are essential tools in neurocritical care. CE marking and compliance with medical device regulations are crucial aspects of this market, ensuring the quality and safety of these devices. The integration of wireless technology, signal processing, and wireless communication enables remote monitoring and real-time data access, enhancing the efficiency and effectiveness of healthcare delivery.
Power consumption and data security are significant concerns in this market, with ongoing efforts to develop longer battery life and robust data protection measures. The use of optical sensors and external sensors expands the application of these devices, offering flexibility and versatility in various healthcare settings. The supply chain and distribution channels play a vital role in ensuring timely access to these devices, with technical support and service contracts essential for maintaining optimal performance. FDA approval and regulatory approvals are necessary steps in product development, ensuring the devices meet the highest standards of safety and efficacy. The healthcare economics of non-invasive intracranial pressure monitoring devices continue to evolve, with ongoing discussions on reimbursement models and cost-effectiveness.
As the market unfolds, we can expect continued innovation and development in this field, driven by the need for improved patient care and clinical outcomes.
How is this Non-Invasive Intracranial Pressure Monitoring Devices Industry segmented?
The non-invasive intracranial pressure monitoring devices industry research report provides comprehensive data (region-wise segment analysis), with forecasts and estimates in "USD million" for the period 2025-2029, as well as historical data from 2019-2023 for the following segments.
- Application
- Traumatic brain injury
- Intracerebral hemorrhage
- Subarachnoid hemorrhage
- Meningitis
- Others
- Geography
- North America
- US
- Canada
- Mexico
- Europe
- France
- Germany
- UK
- APAC
- China
- India
- Japan
- South America
- Brazil
- Rest of World (ROW)
- North America
By Application Insights
The traumatic brain injury segment is estimated to witness significant growth during the forecast period.
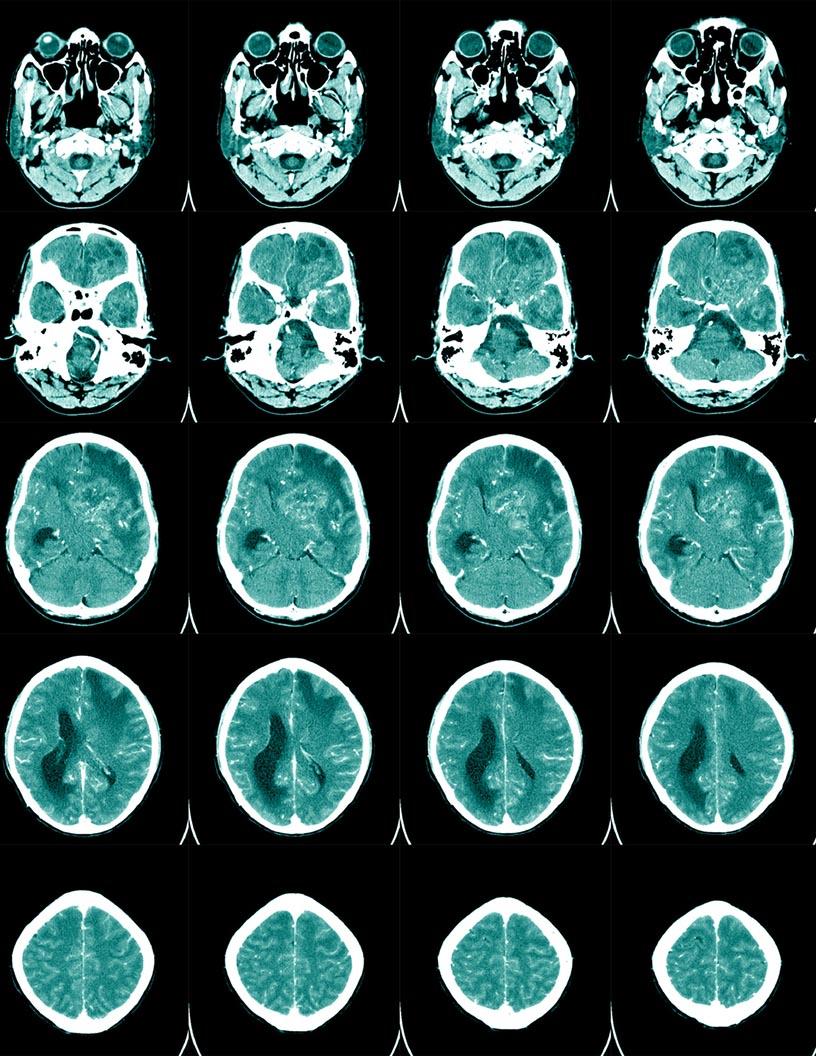
Traumatic brain injury (TBI), a significant cause of disability and death in adults, results from violent head blows or jolts. In the US, according to the Centers for Disease Control and Prevention (CDC), there were approximately 214,110 TBI-related hospitalizations and 69,473 TBI-related deaths in 2020 and 2021, respectively - equating to over 580 hospitalizations and nearly 200 deaths daily. The medical community's focus on improving patient safety and clinical outcomes has led to advancements in intracranial pressure monitoring technology. Non-invasive intracranial pressure monitoring devices have gained traction due to their ability to provide real-time data acquisition, enabling early warning systems and predictive analytics.
These devices employ various technologies, including wireless communication, signal processing, and optical sensors, ensuring data security and minimizing power consumption. The technology transfer from research institutions to market access has accelerated product development, with regulatory approvals from institutions like the FDA. Critical care medicine professionals rely on these devices for ICU monitoring, with data visualization and user interfaces designed for ease of use. Quality control and supply chain management are crucial aspects of these systems, with remote monitoring and technical support ensuring seamless implementation. Market access and service contracts are essential components of the business model, with distribution channels and external sensors expanding the reach of these devices.
The healthcare economics of TBI treatment and care are substantial, with clinical trials ongoing to evaluate the cost-effectiveness and clinical outcomes of non-invasive intracranial pressure monitoring devices. As the technology continues to evolve, it is poised to revolutionize neurocritical care and improve patient safety, making it a vital area of focus for the healthcare technology industry.
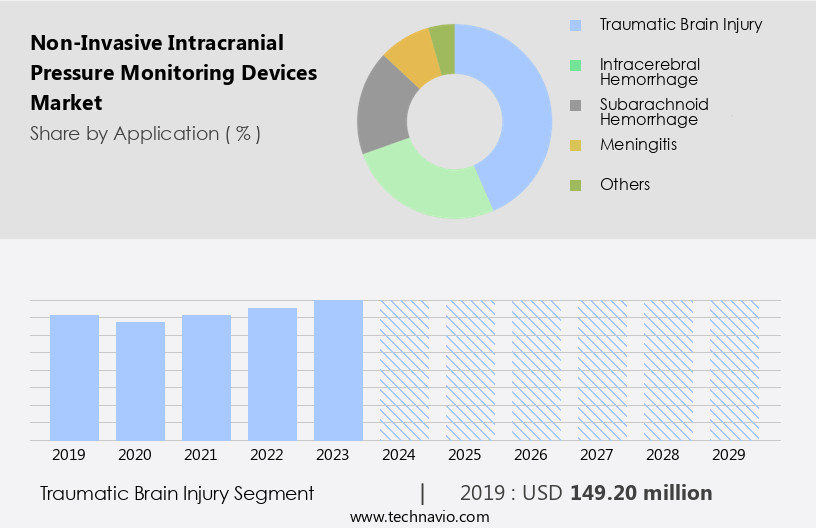
The Traumatic brain injury segment was valued at USD 149.20 million in 2019 and showed a gradual increase during the forecast period.
Regional Analysis
North America is estimated to contribute 54% to the growth of the global market during the forecast period.Technavio’s analysts have elaborately explained the regional trends and drivers that shape the market during the forecast period.
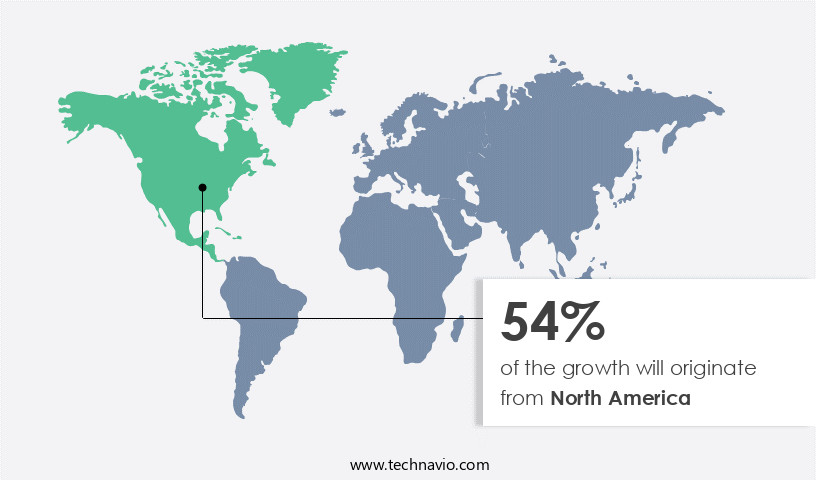
The market in North America is experiencing steady growth, driven by the presence of major market players and advanced technology offerings. With the US and Canada being significant contributors to the market, North America held a dominant position in the global market in 2024. Key players, such as Natus Medical Inc., Integra LifeSciences, Medtronic Plc, and Johnson & Johnson Inc., headquartered in the US, are driving the regional market growth through their extensive product portfolios. Patient safety and clinical outcomes are primary concerns in neurocritical care, leading to an increased focus on non-invasive monitoring solutions. Data security and power consumption are crucial factors influencing the market, with companies investing in wireless technology, signal processing, and data analytics to address these concerns.
The market is witnessing the integration of predictive analytics, data visualization, and early warning systems to improve clinical decision-making and patient outcomes. Regulatory approvals, such as FDA approval and CE marking, are essential for market access, ensuring quality control and supply chain efficiency. Remote monitoring and user interface design are also critical factors, with companies focusing on battery life, response time, and technical support to enhance the user experience. The market is expected to continue its growth trajectory, driven by the evolving needs of critical care medicine and healthcare economics.
Market Dynamics
Our researchers analyzed the data with 2024 as the base year, along with the key drivers, trends, and challenges. A holistic analysis of drivers will help companies refine their marketing strategies to gain a competitive advantage.
The market is experiencing significant growth due to the increasing prevalence of neurological disorders and traumatic brain injuries. These devices offer an alternative to invasive methods, providing real-time pressure monitoring without the need for invasive procedures. Technologies such as transcranial doppler ultrasonography, optic nerve sheath diameter measurement, and non-invasive brain tissue oxygen monitoring are driving innovation in this field. Patients benefit from fewer complications, improved accuracy, and enhanced patient comfort. The market is further fueled by advancements in wireless technology, enabling remote monitoring and real-time data transmission. Additionally, collaborations between industry leaders and research institutions are pushing the boundaries of non-invasive monitoring capabilities. These developments are transforming the intracranial pressure monitoring landscape, offering promising solutions for neurological care.
What are the key market drivers leading to the rise in the adoption of Non-Invasive Intracranial Pressure Monitoring Devices Industry?
- The increasing recognition of non-invasive Intracranial Pressure (ICP) monitoring devices is the primary catalyst fueling market growth. These advanced devices offer accurate ICP measurement without invasive procedures, making them a preferred choice for medical professionals and patients alike.
- Non-invasive intracranial pressure monitoring devices have gained significant attention in the healthcare industry due to their importance in managing neurological conditions and brain injuries. Global organizations, including Headway in the UK, European Brain Injury Society (EBIS), and Collaborative European NeuroTrauma Effectiveness Research in TBI (CENTER-TBI,) are advocating for their use. These organizations promote awareness about brain injuries and provide guidelines to hospitals for diagnosing and treating patients. They emphasize the importance of non-invasive ICP monitoring devices in managing conditions like traumatic brain injury (TBI), intracerebral hemorrhage, meningitis, and subarachnoid hemorrhage.
- By providing accurate and timely pressure readings, these devices enable healthcare professionals to make informed decisions regarding patient care, ultimately improving patient outcomes. The use of non-invasive ICP monitoring devices aligns with the global trend towards minimally invasive medical procedures and patient-centric care.
What are the market trends shaping the Non-Invasive Intracranial Pressure Monitoring Devices Industry?
- The current market landscape is characterized by a significant increase in research and development activities and clinical studies. This trend reflects the growing importance of innovation and scientific advancements in various industries.
- Non-invasive Intracranial Pressure (ICP) monitoring devices have gained significant traction in hospital equipment due to their ability to enhance patient safety and improve clinical outcomes in neurocritical care. The intellectual property landscape is witnessing increased activity as governments in developed countries fund small-scale research and manufacturing companies to develop non-invasive ICP monitoring solutions. For instance, in 2024, SanBio Co., Ltd., a Tokyo-based company led by CEO Keita Mori, received conditional and time-limited marketing approval in Japan for AKUUGO suspension for intracranial implantation. This human somatic stem cell-processed product, approved for improving chronic motor paralysis caused by traumatic brain injury, underscores the potential of non-invasive ICP monitoring technology.
- Data security and power consumption are crucial considerations in the development of these devices. Implantable sensors and advanced technology transfer are essential to achieving response time requirements for brain injury monitoring. The market dynamics are driven by the need for minimally invasive solutions, which offer several advantages over traditional invasive methods. Non-invasive ICP monitoring devices provide real-time data, reducing the risk of complications and improving patient care. The technology's ability to harmoniously integrate with existing hospital systems and its potential to strike a balance between data accuracy and patient comfort further underscores its importance in neurocritical care.
What challenges does the Non-Invasive Intracranial Pressure Monitoring Devices Industry face during its growth?
- The implementation and optimization of invasive intracranial pressure (ICP) monitoring devices pose a significant challenge to the industry's expansion due to their limited availability and frequent utilization requirements.
- Non-invasive intracranial pressure monitoring devices offer an alternative to the traditional invasive method for monitoring intracranial pressure (ICP) in patients with brain-related conditions. Unlike invasive methods, which involve inserting a catheter into the brain tissue or a ventricle, non-invasive devices use data acquisition techniques to measure ICP from external sources. These devices are gaining popularity due to their potential benefits, including minimized risk of complications, improved patient comfort, and ease of use. Clinical trials and research have shown that non-invasive ICP monitoring devices provide accurate and reliable data. These devices employ various technologies, such as data visualization, predictive analytics, and early warning systems, to provide real-time ICP data and alerts for potential pressure changes.
- The non-invasive ICP monitoring market is subject to quality control measures and regulatory approvals, including CE marking and supply chain management. Remote monitoring capabilities enable healthcare professionals to monitor patients from a distance, improving accessibility and efficiency. Data acquisition and analysis are crucial aspects of non-invasive ICP monitoring, ensuring accurate and timely diagnosis and treatment.
Exclusive Customer Landscape
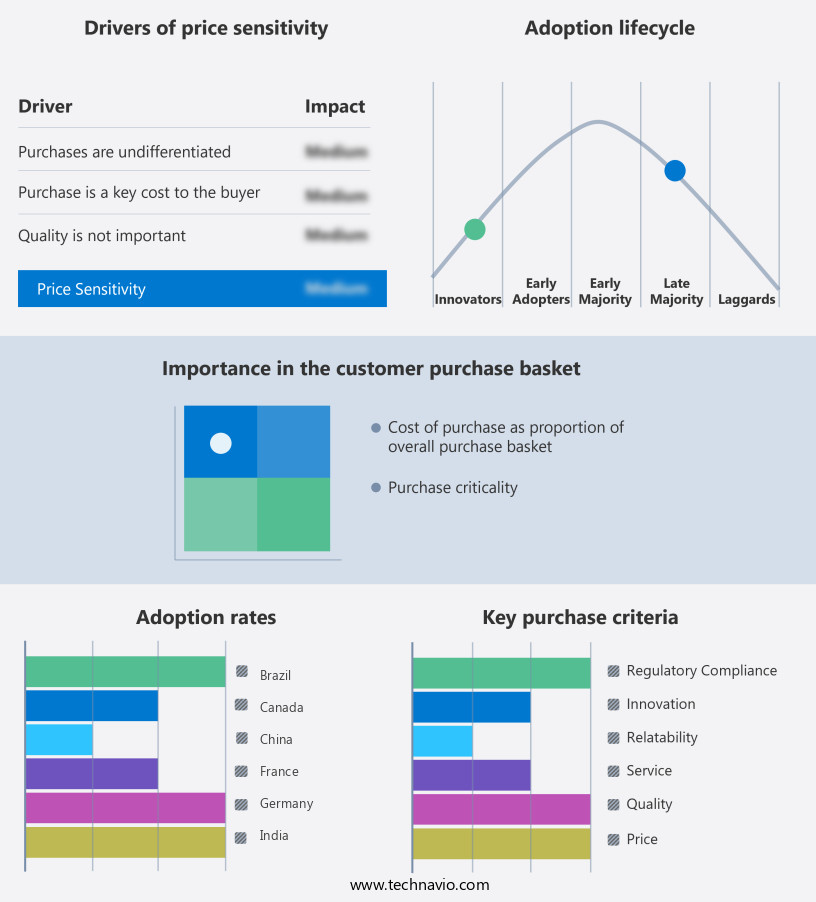
The non-invasive intracranial pressure monitoring devices market forecasting report includes the adoption lifecycle of the market, covering from the innovator’s stage to the laggard’s stage. It focuses on adoption rates in different regions based on penetration. Furthermore, the non-invasive intracranial pressure monitoring devices market report also includes key purchase criteria and drivers of price sensitivity to help companies evaluate and develop their market growth analysis strategies.
Customer Landscape
Key Companies & Market Insights
Companies are implementing various strategies, such as strategic alliances, non-invasive intracranial pressure monitoring devices market forecast, partnerships, mergers and acquisitions, geographical expansion, and product/service launches, to enhance their presence in the industry.
Compumedics Ltd. - The company specializes in advanced intracranial pressure monitoring solutions, featuring non-invasive electrode arrays and ambulatory electroencephalography (EEG) technology for continuous monitoring in critical care units (ICUs). Our offerings include continuous EEG (CEEG) systems, enabling healthcare professionals to assess and manage complex neurological conditions with precision and accuracy. By integrating non-invasive techniques with cutting-edge technology, we aim to improve patient outcomes and enhance clinical decision-making processes. Our intracranial pressure monitoring devices are designed to deliver reliable, real-time data, enabling timely interventions and optimizing patient care.
The industry research and growth report includes detailed analyses of the competitive landscape of the market and information about key companies, including:
- Compumedics Ltd.
- Integra LifeSciences Holdings Corp.
- Johnson and Johnson Inc.
- Medtronic Plc
- Natus Medical Inc.
- Nihon Kohden Corp.
- RAUMEDIC AG
- Sophysa
- Spiegelberg GmbH and Co. KG
Qualitative and quantitative analysis of companies has been conducted to help clients understand the wider business environment as well as the strengths and weaknesses of key industry players. Data is qualitatively analyzed to categorize companies as pure play, category-focused, industry-focused, and diversified; it is quantitatively analyzed to categorize companies as dominant, leading, strong, tentative, and weak.
Recent Development and News in Non-Invasive Intracranial Pressure Monitoring Devices Market
- In January 2024, Medtronic plc, a global healthcare solutions company, announced the FDA approval of its new non-invasive intracranial pressure monitoring system, Signia⢠Optima. This advanced technology uses acoustic monitoring to measure intracranial pressure without the need for invasive procedures (Medtronic Press Release, 2024).
- In March 2024, Cerebralix Biosciences, a leading neuro-diagnostics company, entered into a strategic partnership with Siemens Healthineers to integrate Cerebralix's non-invasive intracranial pressure monitoring technology with Siemens' Syngo platform. This collaboration aims to enhance the diagnostic capabilities of hospitals and improve patient care (Siemens Healthineers Press Release, 2024).
- In May 2024, Integra LifeSciences Holdings Corporation completed the acquisition of NeuroVentures, a pioneer in non-invasive intracranial pressure monitoring. The acquisition will strengthen Integra's neurocritical care portfolio and expand its presence in the non-invasive monitoring market (Integra LifeSciences Press Release, 2024).
- In April 2025, the European Commission granted marketing authorization to Natus Medical Incorporated for its non-invasive intracranial pressure monitoring system, CerebriScan. This approval marks a significant expansion of Natus' offerings in Europe and further solidifies its position as a key player in the non-invasive intracranial pressure monitoring market (Natus Medical Press Release, 2025).
Research Analyst Overview
- The non-invasive intracranial pressure monitoring market is witnessing significant advancements, driven by the integration of technology such as big data, machine learning (ML), and artificial intelligence (AI) in healthcare. Pulse oximetry and EEG monitoring are increasingly being used for neurological assessment, while real-time data analysis from fiber optic sensors and strain gauge technology enable early detection and intervention. Clinical guidelines and predictive modeling help improve treatment protocols and outcome measures, reducing alert fatigue and false positives. Wearable sensors and home healthcare solutions facilitate long-term monitoring, integrating data from various sources such as health informatics and mHealth.
- Neurological assessment tools using capacitive sensing, impedance plethysmography, and ventricular monitoring are essential for accurate diagnosis and outcome measurement. Medical standards ensure device longevity and sensor calibration, mitigating concerns related to sensor drift and false negatives. Subarachnoid monitoring and deep learning algorithms contribute to remote diagnostics and cognitive function assessment, enhancing patient care in post-acute care and long-term settings.
Dive into Technavio’s robust research methodology, blending expert interviews, extensive data synthesis, and validated models for unparalleled Non-Invasive Intracranial Pressure Monitoring Devices Market insights. See full methodology.
|
Market Scope |
|
|
Report Coverage |
Details |
|
Page number |
172 |
|
Base year |
2024 |
|
Historic period |
2019-2023 |
|
Forecast period |
2025-2029 |
|
Growth momentum & CAGR |
Accelerate at a CAGR of 5.8% |
|
Market growth 2025-2029 |
USD 126.1 million |
|
Market structure |
Concentrated |
|
YoY growth 2024-2025(%) |
5.4 |
|
Key countries |
US, UK, Germany, China, Japan, Canada, Mexico, France, India, and Brazil |
|
Competitive landscape |
Leading Companies, Market Positioning of Companies, Competitive Strategies, and Industry Risks |
What are the Key Data Covered in this Non-Invasive Intracranial Pressure Monitoring Devices Market Research and Growth Report?
- CAGR of the Non-Invasive Intracranial Pressure Monitoring Devices industry during the forecast period
- Detailed information on factors that will drive the growth and forecasting between 2025 and 2029
- Precise estimation of the size of the market and its contribution of the industry in focus to the parent market
- Accurate predictions about upcoming growth and trends and changes in consumer behaviour
- Growth of the market across North America, Europe, Asia, and Rest of World (ROW)
- Thorough analysis of the market’s competitive landscape and detailed information about companies
- Comprehensive analysis of factors that will challenge the non-invasive intracranial pressure monitoring devices market growth of industry companies
We can help! Our analysts can customize this non-invasive intracranial pressure monitoring devices market research report to meet your requirements.
 RIA -
RIA - 
