Nootropics Market Size 2025-2029
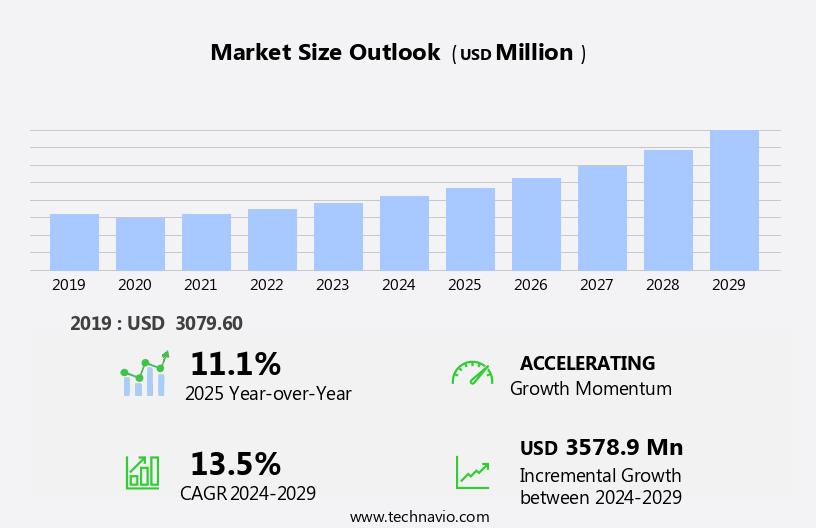
The nootropics market size is forecast to increase by USD 3.58 billion at a CAGR of 13.5% between 2024 and 2029.
- The market is experiencing significant growth, driven by several key factors. Firstly, the rising urban population and increasing demand for cognitive enhancement solutions are fueling market expansion. With the global urban population projected to reach 68% by 2050, the need for productivity-enhancing supplements is expected to increase. Additionally, the growing trend towards online retail and diet supplements has made Nootropics more accessible to consumers, enabling greater market penetration. Despite this promising outlook, the market faces several challenges. One of the most significant hurdles is the low penetration in developing regions, particularly in Asia and Africa. However, as awareness of the benefits of cognitive enhancement supplements spreads, there is a significant opportunity for market expansion in these regions.
- Furthermore, regulatory challenges and negative media attention surrounding Nootropics can impact market growth. Companies seeking to capitalize on market opportunities must navigate these challenges effectively by investing in research and development, building strong regulatory relationships, and implementing effective marketing strategies to counteract negative perceptions. Overall, the market presents a compelling investment opportunity for companies willing to navigate regulatory complexities and capitalize on the growing demand for cognitive enhancement solutions.
What will be the Size of the Nootropics Market during the forecast period?

Request Free Sample
- The market encompasses a diverse range of products designed to enhance cognitive abilities, often referred to as "smart drugs." This market has experienced significant growth due to increasing consumer interest in cognitive health and productivity. According to market research, global consumer spending on nootropics is projected to reach billions of dollars by 2026. The market caters to various demographics, including students, professionals, and older adults seeking to mitigate age-related cognitive decline. Nootropics are also being explored as potential treatments for neurodegenerative diseases such as Alzheimer's, Parkinson's, and Huntington's diseases.
- Omega-3 fatty acids, a common dietary supplement, are also gaining popularity as nootropics due to their cognitive benefits. Overall, the market is poised for continued expansion as consumers and researchers explore the potential of these substances to enhance brain function and improve quality of life.
How is this Nootropics Industry segmented?
The nootropics industry research report provides comprehensive data (region-wise segment analysis), with forecasts and estimates in "USD million" for the period 2025-2029, as well as historical data from 2019-2023 for the following segments.
- Formulation
- Capsules
- Powder
- Drinks
- Others
- Distribution Channel
- By Type
- Over-the-counter (OTC)
- Prescription, Natural
- Others
- Material Type
- Memory Enhancement
- Attention and Focus
- Mood and Depression
- Longevity and Anti-aging
- Sleep and Recovery
- Geography
- North America
- Europe
- Asia
- China
- India
- Japan
- South Korea
- Rest of World (ROW)
By Formulation Insights
The capsules segment is estimated to witness significant growth during the forecast period. Key ingredients, such as Omega-3 fatty acids, Ginkgo biloba, and Panax ginseng, are commonly used in these products. Healthcare providers and meal-replacement companies, like Soylent Nutrition, also offer nootropics as part of their offerings. To maintain cognitive ability and brain function, consumers are turning to nootropics for memory enhancement, mental performance, and productivity enhancement. While natural ingredients and plant-based nootropics are popular, independent testing and ethical concerns are important considerations for consumers.

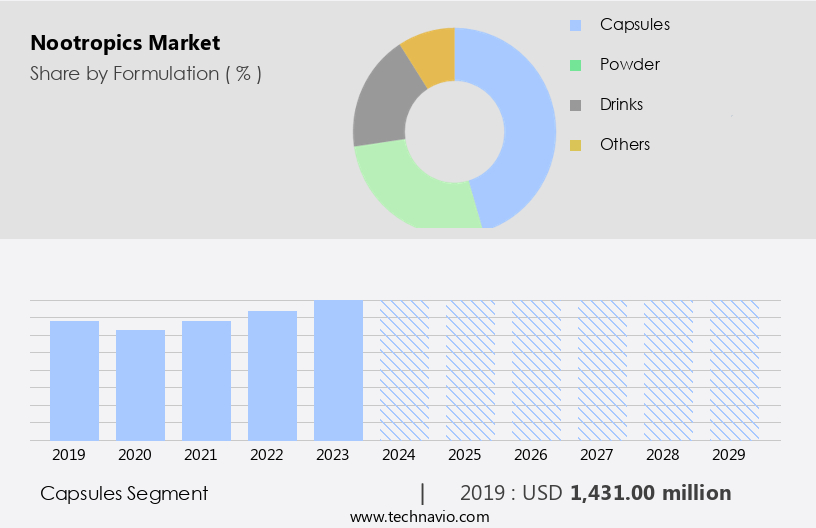
Get a glance at the market report of share of various segments Request Free Sample
The Capsules segment was valued at USD 1.43 billion in 2019 and showed a gradual increase during the forecast period.
Regional Analysis
North America is estimated to contribute 51% to the growth of the global market during the forecast period. Technavio's analysts have elaborately explained the regional trends and drivers that shape the market during the forecast period.

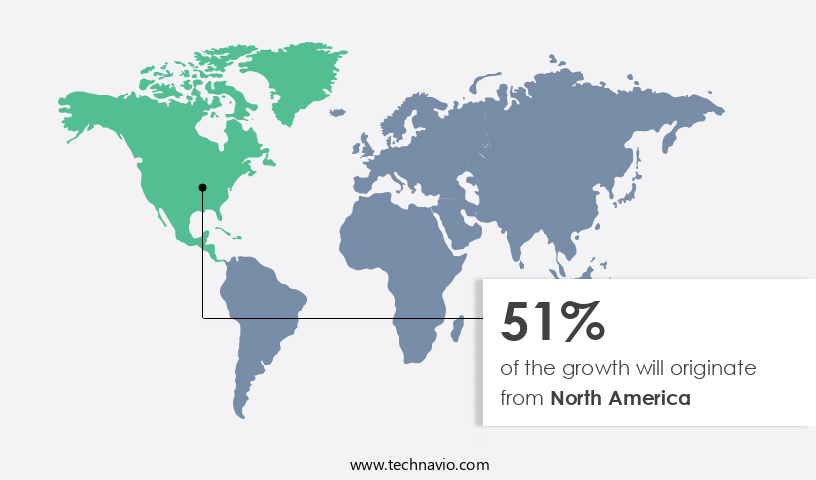
For more insights on the market size of various regions, Request Free Sample
The North American market for nootropics, which includes products like Alpha Brain, Smart Drugs, and cognitive enhancers, emerged as the largest in 2024. Factors driving this growth include increased health and wellness spending, a growing healthcare sector, and greater consumer awareness of brain health. The US, in particular, leads the region in spending on brain health supplements due to heightened awareness of their benefits. As cultural values shift and interest in advanced brain health products grows, demand for nootropics in forms such as capsules is anticipated to rise. Major retailers in the US, including Walmart, Target, CVS, and Walgreens, now offer a wide selection of nootropic supplements.
Market Dynamics
Our researchers analyzed the data with 2024 as the base year, along with the key drivers, trends, and challenges. A holistic analysis of drivers will help companies refine their marketing strategies to gain a competitive advantage.
What are the key market drivers leading to the rise in the adoption of Nootropics Industry?
- Rising urban population is the key driver of the market. The global urban population has experienced significant growth, with over half of the world's population now residing in urban areas, according to The World Bank Group. This urbanization has resulted in lifestyle changes, improved living standards, and increased disposable income. However, with aging populations, there is also a rise in health concerns such as dementia and chronic diseases like Alzheimer's. In response, health consciousness among urban residents has grown, leading to increased demand for brain health supplements. In developed nations, stable per capita disposable income, driven by the rise of double-income households, has significantly enhanced consumer purchasing power.
- Meanwhile, in developing countries, brain health supplements have become more affordable. These market dynamics have fueled the growth of the market, providing opportunities for companies to cater to the evolving health needs of urban populations. Second, the demand for productivity enhancement and mental clarity in today's fast-paced world has fueled interest in nootropics as a means of improving focus and cognitive function.
What are the market trends shaping the Nootropics Industry?
- Growing demand in online retail is the upcoming market trend. The global market for nootropic supplements is experiencing significant growth in online retail channels. Factors such as increasing internet connectivity, expanding smartphone usage, and a vast consumer base are driving this trend. Major market players are focusing on distributing these supplements via online platforms to reach a larger audience. Effective online marketing strategies enable manufacturers to offer consumers easy access to a diverse range of products. E-commerce platforms like Amazon, IndiaMart, and Alibaba provide an extensive selection of nootropic supplements at competitive prices, making them an attractive option for consumers.
- Discounts, promotions, and the availability of multiple brands further encourage bulk purchases through these channels. As a result, online sales of nootropic supplements are projected to increase substantially during the forecast period. Nootropics come in various forms, including capsules, powders, and drinks. Some nootropics are derived from natural sources such as omega-3 fatty acids, Ginkgo biloba, and Panax ginseng, while others are synthetic compounds. Natural nootropics are often marketed as plant-based or nutritional supplements, while synthetic nootropics may be sold as prescription drugs or over-the-counter supplements.
What challenges does the Nootropics Industry face during its growth?
- Low penetration in developing regions is a key challenge affecting the industry growth. Nootropic supplements have witnessed growing recognition in developed markets due to heightened awareness of their cognitive benefits. In contrast, adoption in developing and underdeveloped regions, such as Africa and the Middle East, lags significantly behind. This disparity can be attributed to affordability constraints and lower awareness levels in these regions. In areas with limited purchasing power, manufacturers often produce low-cost nootropic supplements, potentially compromising on quality.
- Moreover, consumers in these regions view these supplements as non-essential, leading to reluctance in purchasing. Furthermore, product visibility and availability are hindered by weak distribution networks and limited internet access. Despite the growing popularity of nootropics, there are ethical concerns surrounding their use. Some critics argue that the use of cognitive enhancers gives an unfair advantage to individuals and could lead to a widening gap between those who can afford them and those who cannot.
Exclusive Customer Landscape
The nootropics market forecasting report includes the adoption lifecycle of the market, covering from the innovator's stage to the laggard's stage. It focuses on adoption rates in different regions based on penetration. Furthermore, the nootropics market report also includes key purchase criteria and drivers of price sensitivity to help companies evaluate and develop their market growth analysis strategies.
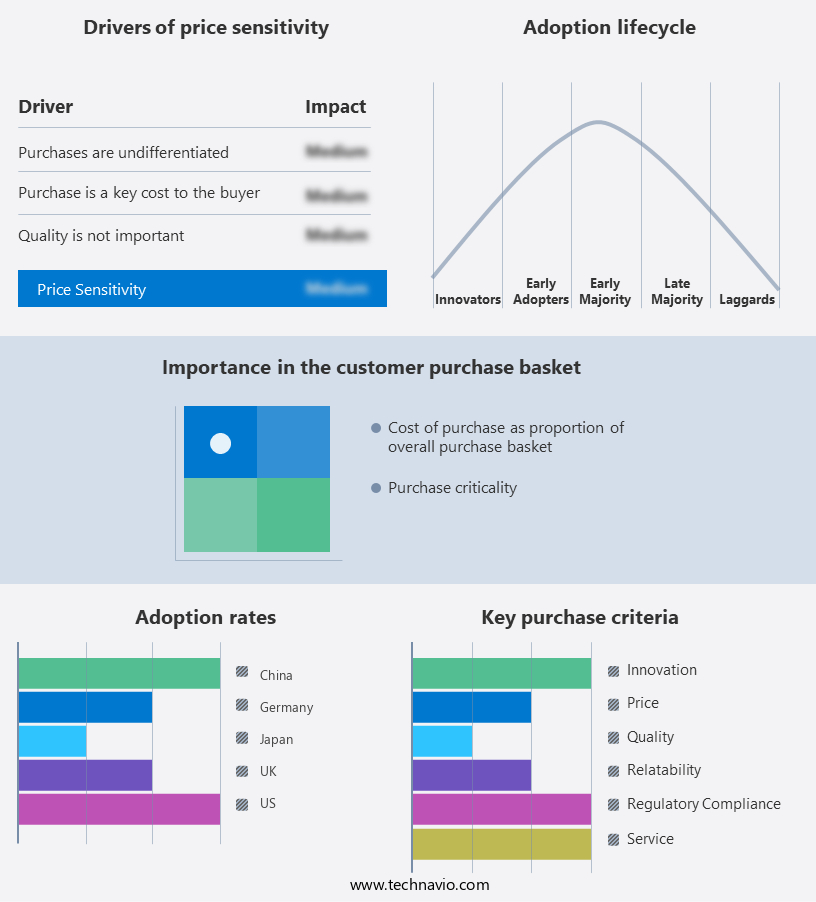
Customer Landscape
Key Companies & Market Insights
Companies are implementing various strategies, such as strategic alliances, nootropics market forecast, partnerships, mergers and acquisitions, geographical expansion, and product/service launches, to enhance their presence in the industry.
Accelerated Intelligence Inc. - The company provides coffee blends infused with cognitive enhancers Alpha GPC, L-Theanine, and DMAE. These ingredients promote mental clarity, focus, and sustained energy without causing crashes.
The industry research and growth report includes detailed analyses of the competitive landscape of the market and information about key companies, including:
- Accelerated Intelligence Inc.
- Applied Food Sciences Inc.
- Careforsons LTD.
- Gaia Herbs Inc.
- Gridiron Nutrition
- Health Via Modern Nutrition Inc.
- Kraken Koffee LLC
- Mental Mojo LLC
- NEU Energy
- Nutraceutical Corp.
- Onnit Labs Inc.
- Opti-Nutra Ltd.
- Peak Nootropics
- Performance Lab Ltd.
- PowderCity.com Ltd.
- Purelife bioscience Co Ltd.
- Reckitt Benckiser Group Plc
- Roar Ambition Ltd
- truBrain Inc.
- Wolfson Holdco Ltd.
Qualitative and quantitative analysis of companies has been conducted to help clients understand the wider business environment as well as the strengths and weaknesses of key industry players. Data is qualitatively analyzed to categorize companies as pure play, category-focused, industry-focused, and diversified; it is quantitatively analyzed to categorize companies as dominant, leading, strong, tentative, and weak.
Research Analyst Overview
Nootropics, also known as cognitive enhancers or smart drugs, are a class of substances that are purported to enhance brain function and cognitive abilities. These substances have gained popularity in recent years due to their potential to improve mental performance, memory, focus, and overall brain health. The market has experienced significant growth as more individuals seek to optimize their cognitive abilities for professional and personal reasons. The market is driven by several factors. First, the increasing prevalence of cognitive disorders such as Alzheimer's disease, Parkinson's disease, and Huntington's disease has led to a greater focus on brain health and the search for effective interventions.
Additionally, there are concerns about the long-term safety and efficacy of nootropics, particularly those with synthetic compounds. To address these concerns, reputable companies are investing in independent testing and clinical trials to ensure the safety and efficacy of their nootropic products. Healthcare professionals are also playing a crucial role in educating consumers about the potential benefits and risks of nootropics and providing guidance on their use. In the marketplace, nootropics are available from various sources, including drug stores, healthcare professionals, and online retailers. Consumers can also explore biohacking practices and wellness products that incorporate nootropics as part of a holistic approach to brain health.
The market is driven by the growing demand for cognitive enhancement and brain health. While natural nootropics derived from sources such as omega-3 fatty acids, Ginkgo biloba, and Panax ginseng have gained popularity, synthetic nootropics remain a subject of controversy due to ethical concerns and safety issues. Reputable companies are investing in independent testing and clinical trials to ensure the safety and efficacy of their nootropic products, and healthcare professionals are playing a crucial role in educating consumers about their use. As the market continues to evolve, it is essential to prioritize ethical considerations and scientific evidence to promote the safe and effective use of nootropics for cognitive enhancement and brain health.
Market Scope
|
Report Coverage
|
Details
|
Page number
|
184
|
Base year
|
2024
|
Historic period
|
2019-2023 |
Forecast period
|
2025-2029
|
Growth momentum & CAGR
|
Accelerate at a CAGR of 13.5%
|
Market growth 2025-2029
|
USD 3.58 billion
|
Market structure
|
Fragmented
|
YoY growth 2024-2025(%)
|
11.1
|
Key countries
|
US, China, Canada, Germany, UK, France, Italy, Japan, India, and South Korea
|
Competitive landscape
|
Leading Companies, Market Positioning of Companies, Competitive Strategies, and Industry Risks
|
Request Free Sample
What are the Key Data Covered in this Nootropics Market Research and Growth Report?
- CAGR of the Nootropics industry during the forecast period
- Detailed information on factors that will drive the growth and forecasting between 2025 and 2029
- Precise estimation of the size of the market and its contribution of the industry in focus to the parent market
- Accurate predictions about upcoming growth and trends and changes in consumer behaviour
- Growth of the market across North America, Europe, Asia, and Rest of World (ROW)
- Thorough analysis of the market's competitive landscape and detailed information about companies
- Comprehensive analysis of factors that will challenge the nootropics market growth of industry companies
We can help! Our analysts can customize this nootropics market research report to meet your requirements.
Get in touch
1 Executive Summary
- 1.1 Market overview
- Executive Summary - Chart on Market Overview
- Executive Summary - Data Table on Market Overview
- Executive Summary - Chart on Global Market Characteristics
- Executive Summary - Chart on Market by Geography
- Executive Summary - Chart on Market Segmentation by Formulation
- Executive Summary - Chart on Market Segmentation by Distribution Channel
- Executive Summary - Chart on Incremental Growth
- Executive Summary - Data Table on Incremental Growth
- Executive Summary - Chart on Company Market Positioning
2 Technavio Analysis
- 2.1 Analysis of price sensitivity, lifecycle, customer purchase basket, adoption rates, and purchase criteria
- Analysis of price sensitivity, lifecycle, customer purchase basket, adoption rates, and purchase criteria
- 2.2 Criticality of inputs and Factors of differentiation
- Overview on criticality of inputs and factors of differentiation
- 2.3 Factors of disruption
- Overview on factors of disruption
- 2.4 Impact of drivers and challenges
- Impact of drivers and challenges in 2024 and 2029
3 Market Landscape
- 3.1 Market ecosystem
- Parent Market
- Data Table on - Parent Market
- 3.2 Market characteristics
- Market characteristics analysis
4 Market Sizing
- 4.1 Market definition
- Offerings of companies included in the market definition
- 4.2 Market segment analysis
- 4.4 Market outlook: Forecast for 2024-2029
- Chart on Global - Market size and forecast 2024-2029 ($ million)
- Data Table on Global - Market size and forecast 2024-2029 ($ million)
- Chart on Global Market: Year-over-year growth 2024-2029 (%)
- Data Table on Global Market: Year-over-year growth 2024-2029 (%)
5 Historic Market Size
- 5.1 Global Nootropics Market 2019 - 2023
- Historic Market Size - Data Table on Global Nootropics Market 2019 - 2023 ($ million)
- 5.2 Formulation segment analysis 2019 - 2023
- Historic Market Size - Formulation Segment 2019 - 2023 ($ million)
- 5.3 Distribution Channel segment analysis 2019 - 2023
- Historic Market Size - Distribution Channel Segment 2019 - 2023 ($ million)
- 5.4 Geography segment analysis 2019 - 2023
- Historic Market Size - Geography Segment 2019 - 2023 ($ million)
- 5.5 Country segment analysis 2019 - 2023
- Historic Market Size - Country Segment 2019 - 2023 ($ million)
6 Qualitative Analysis
- 6.1 Impact of AI in global nootropics market
7 Five Forces Analysis
- 7.1 Five forces summary
- Five forces analysis - Comparison between 2024 and 2029
- 7.2 Bargaining power of buyers
- Bargaining power of buyers - Impact of key factors 2024 and 2029
- 7.3 Bargaining power of suppliers
- Bargaining power of suppliers - Impact of key factors in 2024 and 2029
- 7.4 Threat of new entrants
- Threat of new entrants - Impact of key factors in 2024 and 2029
- 7.5 Threat of substitutes
- Threat of substitutes - Impact of key factors in 2024 and 2029
- 7.6 Threat of rivalry
- Threat of rivalry - Impact of key factors in 2024 and 2029
- 7.7 Market condition
- Chart on Market condition - Five forces 2024 and 2029
8 Market Segmentation by Formulation
- 8.1 Market segments
- Chart on Formulation - Market share (2024-2029) (%)
- Data Table on Formulation - Market share (2024-2029) (%)
- 8.2 Comparison by Formulation
- Chart on Comparison by Formulation
- Data Table on Comparison by Formulation
- 8.3 Capsules - Market size and forecast (2024-2029)
- Chart on Capsules - Market size and forecast (2024-2029) ($ million)
- Data Table on Capsules - Market size and forecast (2024-2029) ($ million)
- Chart on Capsules - Year-over-year growth (2024-2029) (%)
- Data Table on Capsules - Year-over-year growth (2024-2029) (%)
- 8.4 Powder - Market size and forecast (2024-2029)
- Chart on Powder - Market size and forecast (2024-2029) ($ million)
- Data Table on Powder - Market size and forecast (2024-2029) ($ million)
- Chart on Powder - Year-over-year growth (2024-2029) (%)
- Data Table on Powder - Year-over-year growth (2024-2029) (%)
- 8.5 Drinks - Market size and forecast (2024-2029)
- Chart on Drinks - Market size and forecast (2024-2029) ($ million)
- Data Table on Drinks - Market size and forecast (2024-2029) ($ million)
- Chart on Drinks - Year-over-year growth (2024-2029) (%)
- Data Table on Drinks - Year-over-year growth (2024-2029) (%)
- 8.6 Others - Market size and forecast (2024-2029)
- Chart on Others - Market size and forecast (2024-2029) ($ million)
- Data Table on Others - Market size and forecast (2024-2029) ($ million)
- Chart on Others - Year-over-year growth (2024-2029) (%)
- Data Table on Others - Year-over-year growth (2024-2029) (%)
- 8.7 Market opportunity by Formulation
- Market opportunity by Formulation ($ million)
- Data Table on Market opportunity by Formulation ($ million)
9 Market Segmentation by Distribution Channel
- 9.1 Market segments
- Chart on Distribution Channel - Market share (2024-2029) (%)
- Data Table on Distribution Channel - Market share (2024-2029) (%)
- 9.2 Comparison by Distribution Channel
- Chart on Comparison by Distribution Channel
- Data Table on Comparison by Distribution Channel
- 9.3 Offline - Market size and forecast (2024-2029)
- Chart on Offline - Market size and forecast (2024-2029) ($ million)
- Data Table on Offline - Market size and forecast (2024-2029) ($ million)
- Chart on Offline - Year-over-year growth (2024-2029) (%)
- Data Table on Offline - Year-over-year growth (2024-2029) (%)
- 9.4 Online - Market size and forecast (2024-2029)
- Chart on Online - Market size and forecast (2024-2029) ($ million)
- Data Table on Online - Market size and forecast (2024-2029) ($ million)
- Chart on Online - Year-over-year growth (2024-2029) (%)
- Data Table on Online - Year-over-year growth (2024-2029) (%)
- 9.5 Market opportunity by Distribution Channel
- Market opportunity by Distribution Channel ($ million)
- Data Table on Market opportunity by Distribution Channel ($ million)
10 Market Segmentation by By Type
- 10.1 Market segments
- Chart on By Type - Market share (2024-2029) (%)
- Data Table on By Type - Market share (2024-2029) (%)
- 10.2 Comparison by By Type
- Chart on Comparison by By Type
- Data Table on Comparison by By Type
- 10.3 Over-the-counter (OTC) - Market size and forecast (2024-2029)
- Chart on Over-the-counter (OTC) - Market size and forecast (2024-2029) ($ million)
- Data Table on Over-the-counter (OTC) - Market size and forecast (2024-2029) ($ million)
- Chart on Over-the-counter (OTC) - Year-over-year growth (2024-2029) (%)
- Data Table on Over-the-counter (OTC) - Year-over-year growth (2024-2029) (%)
- 10.4 Prescription, Natural - Market size and forecast (2024-2029)
- Chart on Prescription, Natural - Market size and forecast (2024-2029) ($ million)
- Data Table on Prescription, Natural - Market size and forecast (2024-2029) ($ million)
- Chart on Prescription, Natural - Year-over-year growth (2024-2029) (%)
- Data Table on Prescription, Natural - Year-over-year growth (2024-2029) (%)
- 10.5 Others - Market size and forecast (2024-2029)
- Chart on Others - Market size and forecast (2024-2029) ($ million)
- Data Table on Others - Market size and forecast (2024-2029) ($ million)
- Chart on Others - Year-over-year growth (2024-2029) (%)
- Data Table on Others - Year-over-year growth (2024-2029) (%)
- 10.6 Market opportunity by By Type
- Market opportunity by By Type ($ million)
- Data Table on Market opportunity by By Type ($ million)
11 Market Segmentation by Material Type
- 11.1 Market segments
- Chart on Material Type - Market share (2024-2029) (%)
- Data Table on Material Type - Market share (2024-2029) (%)
- 11.2 Comparison by Material Type
- Chart on Comparison by Material Type
- Data Table on Comparison by Material Type
- 11.3 Memory Enhancement - Market size and forecast (2024-2029)
- Chart on Memory Enhancement - Market size and forecast (2024-2029) ($ million)
- Data Table on Memory Enhancement - Market size and forecast (2024-2029) ($ million)
- Chart on Memory Enhancement - Year-over-year growth (2024-2029) (%)
- Data Table on Memory Enhancement - Year-over-year growth (2024-2029) (%)
- 11.4 Attention and Focus - Market size and forecast (2024-2029)
- Chart on Attention and Focus - Market size and forecast (2024-2029) ($ million)
- Data Table on Attention and Focus - Market size and forecast (2024-2029) ($ million)
- Chart on Attention and Focus - Year-over-year growth (2024-2029) (%)
- Data Table on Attention and Focus - Year-over-year growth (2024-2029) (%)
- 11.5 Mood and Depression - Market size and forecast (2024-2029)
- Chart on Mood and Depression - Market size and forecast (2024-2029) ($ million)
- Data Table on Mood and Depression - Market size and forecast (2024-2029) ($ million)
- Chart on Mood and Depression - Year-over-year growth (2024-2029) (%)
- Data Table on Mood and Depression - Year-over-year growth (2024-2029) (%)
- 11.6 Longevity and Anti-aging - Market size and forecast (2024-2029)
- Chart on Longevity and Anti-aging - Market size and forecast (2024-2029) ($ million)
- Data Table on Longevity and Anti-aging - Market size and forecast (2024-2029) ($ million)
- Chart on Longevity and Anti-aging - Year-over-year growth (2024-2029) (%)
- Data Table on Longevity and Anti-aging - Year-over-year growth (2024-2029) (%)
- 11.7 Sleep and Recovery - Market size and forecast (2024-2029)
- Chart on Sleep and Recovery - Market size and forecast (2024-2029) ($ million)
- Data Table on Sleep and Recovery - Market size and forecast (2024-2029) ($ million)
- Chart on Sleep and Recovery - Year-over-year growth (2024-2029) (%)
- Data Table on Sleep and Recovery - Year-over-year growth (2024-2029) (%)
- 11.8 Market opportunity by Material Type
- Market opportunity by Material Type ($ million)
- Data Table on Market opportunity by Material Type ($ million)
12 Customer Landscape
- 12.1 Customer landscape overview
- Analysis of price sensitivity, lifecycle, customer purchase basket, adoption rates, and purchase criteria
13 Geographic Landscape
- 13.1 Geographic segmentation
- Chart on Market share by geography 2024-2029 (%)
- Data Table on Market share by geography 2024-2029 (%)
- 13.2 Geographic comparison
- Chart on Geographic comparison
- Data Table on Geographic comparison
- 13.3 North America - Market size and forecast 2024-2029
- Chart on North America - Market size and forecast 2024-2029 ($ million)
- Data Table on North America - Market size and forecast 2024-2029 ($ million)
- Chart on North America - Year-over-year growth 2024-2029 (%)
- Data Table on North America - Year-over-year growth 2024-2029 (%)
- 13.4 Europe - Market size and forecast 2024-2029
- Chart on Europe - Market size and forecast 2024-2029 ($ million)
- Data Table on Europe - Market size and forecast 2024-2029 ($ million)
- Chart on Europe - Year-over-year growth 2024-2029 (%)
- Data Table on Europe - Year-over-year growth 2024-2029 (%)
- 13.5 Asia - Market size and forecast 2024-2029
- Chart on Asia - Market size and forecast 2024-2029 ($ million)
- Data Table on Asia - Market size and forecast 2024-2029 ($ million)
- Chart on Asia - Year-over-year growth 2024-2029 (%)
- Data Table on Asia - Year-over-year growth 2024-2029 (%)
- 13.6 Rest of World (ROW) - Market size and forecast 2024-2029
- Chart on Rest of World (ROW) - Market size and forecast 2024-2029 ($ million)
- Data Table on Rest of World (ROW) - Market size and forecast 2024-2029 ($ million)
- Chart on Rest of World (ROW) - Year-over-year growth 2024-2029 (%)
- Data Table on Rest of World (ROW) - Year-over-year growth 2024-2029 (%)
- 13.7 US - Market size and forecast 2024-2029
- Chart on US - Market size and forecast 2024-2029 ($ million)
- Data Table on US - Market size and forecast 2024-2029 ($ million)
- Chart on US - Year-over-year growth 2024-2029 (%)
- Data Table on US - Year-over-year growth 2024-2029 (%)
- 13.8 China - Market size and forecast 2024-2029
- Chart on China - Market size and forecast 2024-2029 ($ million)
- Data Table on China - Market size and forecast 2024-2029 ($ million)
- Chart on China - Year-over-year growth 2024-2029 (%)
- Data Table on China - Year-over-year growth 2024-2029 (%)
- 13.9 Canada - Market size and forecast 2024-2029
- Chart on Canada - Market size and forecast 2024-2029 ($ million)
- Data Table on Canada - Market size and forecast 2024-2029 ($ million)
- Chart on Canada - Year-over-year growth 2024-2029 (%)
- Data Table on Canada - Year-over-year growth 2024-2029 (%)
- 13.10 Germany - Market size and forecast 2024-2029
- Chart on Germany - Market size and forecast 2024-2029 ($ million)
- Data Table on Germany - Market size and forecast 2024-2029 ($ million)
- Chart on Germany - Year-over-year growth 2024-2029 (%)
- Data Table on Germany - Year-over-year growth 2024-2029 (%)
- 13.11 UK - Market size and forecast 2024-2029
- Chart on UK - Market size and forecast 2024-2029 ($ million)
- Data Table on UK - Market size and forecast 2024-2029 ($ million)
- Chart on UK - Year-over-year growth 2024-2029 (%)
- Data Table on UK - Year-over-year growth 2024-2029 (%)
- 13.12 France - Market size and forecast 2024-2029
- Chart on France - Market size and forecast 2024-2029 ($ million)
- Data Table on France - Market size and forecast 2024-2029 ($ million)
- Chart on France - Year-over-year growth 2024-2029 (%)
- Data Table on France - Year-over-year growth 2024-2029 (%)
- 13.13 Japan - Market size and forecast 2024-2029
- Chart on Japan - Market size and forecast 2024-2029 ($ million)
- Data Table on Japan - Market size and forecast 2024-2029 ($ million)
- Chart on Japan - Year-over-year growth 2024-2029 (%)
- Data Table on Japan - Year-over-year growth 2024-2029 (%)
- 13.14 Italy - Market size and forecast 2024-2029
- Chart on Italy - Market size and forecast 2024-2029 ($ million)
- Data Table on Italy - Market size and forecast 2024-2029 ($ million)
- Chart on Italy - Year-over-year growth 2024-2029 (%)
- Data Table on Italy - Year-over-year growth 2024-2029 (%)
- 13.15 India - Market size and forecast 2024-2029
- Chart on India - Market size and forecast 2024-2029 ($ million)
- Data Table on India - Market size and forecast 2024-2029 ($ million)
- Chart on India - Year-over-year growth 2024-2029 (%)
- Data Table on India - Year-over-year growth 2024-2029 (%)
- 13.16 South Korea - Market size and forecast 2024-2029
- Chart on South Korea - Market size and forecast 2024-2029 ($ million)
- Data Table on South Korea - Market size and forecast 2024-2029 ($ million)
- Chart on South Korea - Year-over-year growth 2024-2029 (%)
- Data Table on South Korea - Year-over-year growth 2024-2029 (%)
- 13.17 Market opportunity by geography
- Market opportunity by geography ($ million)
- Data Tables on Market opportunity by geography ($ million)
14 Drivers, Challenges, and Opportunity/Restraints
- 14.3 Impact of drivers and challenges
- Impact of drivers and challenges in 2024 and 2029
- 14.4 Market opportunities/restraints
15 Competitive Landscape
- 15.2 Competitive Landscape
- Overview on criticality of inputs and factors of differentiation
- 15.3 Landscape disruption
- Overview on factors of disruption
- 15.4 Industry risks
- Impact of key risks on business
16 Competitive Analysis
- 16.2 Company ranking index
- 16.3 Market positioning of companies
- Matrix on companies position and classification
- 16.4 Applied Food Sciences Inc.
- Applied Food Sciences Inc. - Overview
- Applied Food Sciences Inc. - Product / Service
- Applied Food Sciences Inc. - Key offerings
- SWOT
- 16.5 Gaia Herbs Inc.
- Gaia Herbs Inc. - Overview
- Gaia Herbs Inc. - Product / Service
- Gaia Herbs Inc. - Key news
- Gaia Herbs Inc. - Key offerings
- SWOT
- 16.6 Health Via Modern Nutrition Inc.
- Health Via Modern Nutrition Inc. - Overview
- Health Via Modern Nutrition Inc. - Product / Service
- Health Via Modern Nutrition Inc. - Key offerings
- SWOT
- 16.7 Kraken Koffee LLC
- Kraken Koffee LLC - Overview
- Kraken Koffee LLC - Product / Service
- Kraken Koffee LLC - Key offerings
- SWOT
- 16.8 Mental Mojo LLC
- Mental Mojo LLC - Overview
- Mental Mojo LLC - Product / Service
- Mental Mojo LLC - Key offerings
- SWOT
- 16.9 NEU Energy
- NEU Energy - Overview
- NEU Energy - Product / Service
- NEU Energy - Key offerings
- SWOT
- 16.10 Nutraceutical Corp.
- Nutraceutical Corp. - Overview
- Nutraceutical Corp. - Product / Service
- Nutraceutical Corp. - Key offerings
- SWOT
- 16.11 Onnit Labs Inc.
- Onnit Labs Inc. - Overview
- Onnit Labs Inc. - Product / Service
- Onnit Labs Inc. - Key offerings
- SWOT
- 16.12 Opti-Nutra Ltd.
- Opti-Nutra Ltd. - Overview
- Opti-Nutra Ltd. - Product / Service
- Opti-Nutra Ltd. - Key offerings
- SWOT
- 16.13 Peak Nootropics
- Peak Nootropics - Overview
- Peak Nootropics - Product / Service
- Peak Nootropics - Key offerings
- SWOT
- 16.14 PowderCity.com Ltd.
- PowderCity.com Ltd. - Overview
- PowderCity.com Ltd. - Product / Service
- PowderCity.com Ltd. - Key offerings
- SWOT
- 16.15 Purelife bioscience Co Ltd.
- Purelife bioscience Co Ltd. - Overview
- Purelife bioscience Co Ltd. - Product / Service
- Purelife bioscience Co Ltd. - Key offerings
- SWOT
- 16.16 Reckitt Benckiser Group Plc
- Reckitt Benckiser Group Plc - Overview
- Reckitt Benckiser Group Plc - Business segments
- Reckitt Benckiser Group Plc - Key news
- Reckitt Benckiser Group Plc - Key offerings
- Reckitt Benckiser Group Plc - Segment focus
- SWOT
- 16.17 truBrain Inc.
- truBrain Inc. - Overview
- truBrain Inc. - Product / Service
- truBrain Inc. - Key offerings
- SWOT
- 16.18 Wolfson Holdco Ltd.
- Wolfson Holdco Ltd. - Overview
- Wolfson Holdco Ltd. - Product / Service
- Wolfson Holdco Ltd. - Key offerings
- SWOT
17 Appendix
- 17.2 Inclusions and exclusions checklist
- Inclusions checklist
- Exclusions checklist
- 17.3 Currency conversion rates for US$
- Currency conversion rates for US$
- 17.4 Research methodology
- 17.7 Validation techniques employed for market sizing
- Validation techniques employed for market sizing
- 17.9 360 degree market analysis
- 360 degree market analysis
- 17.10 List of abbreviations