
North America Dietary Supplements Market Size 2025-2029
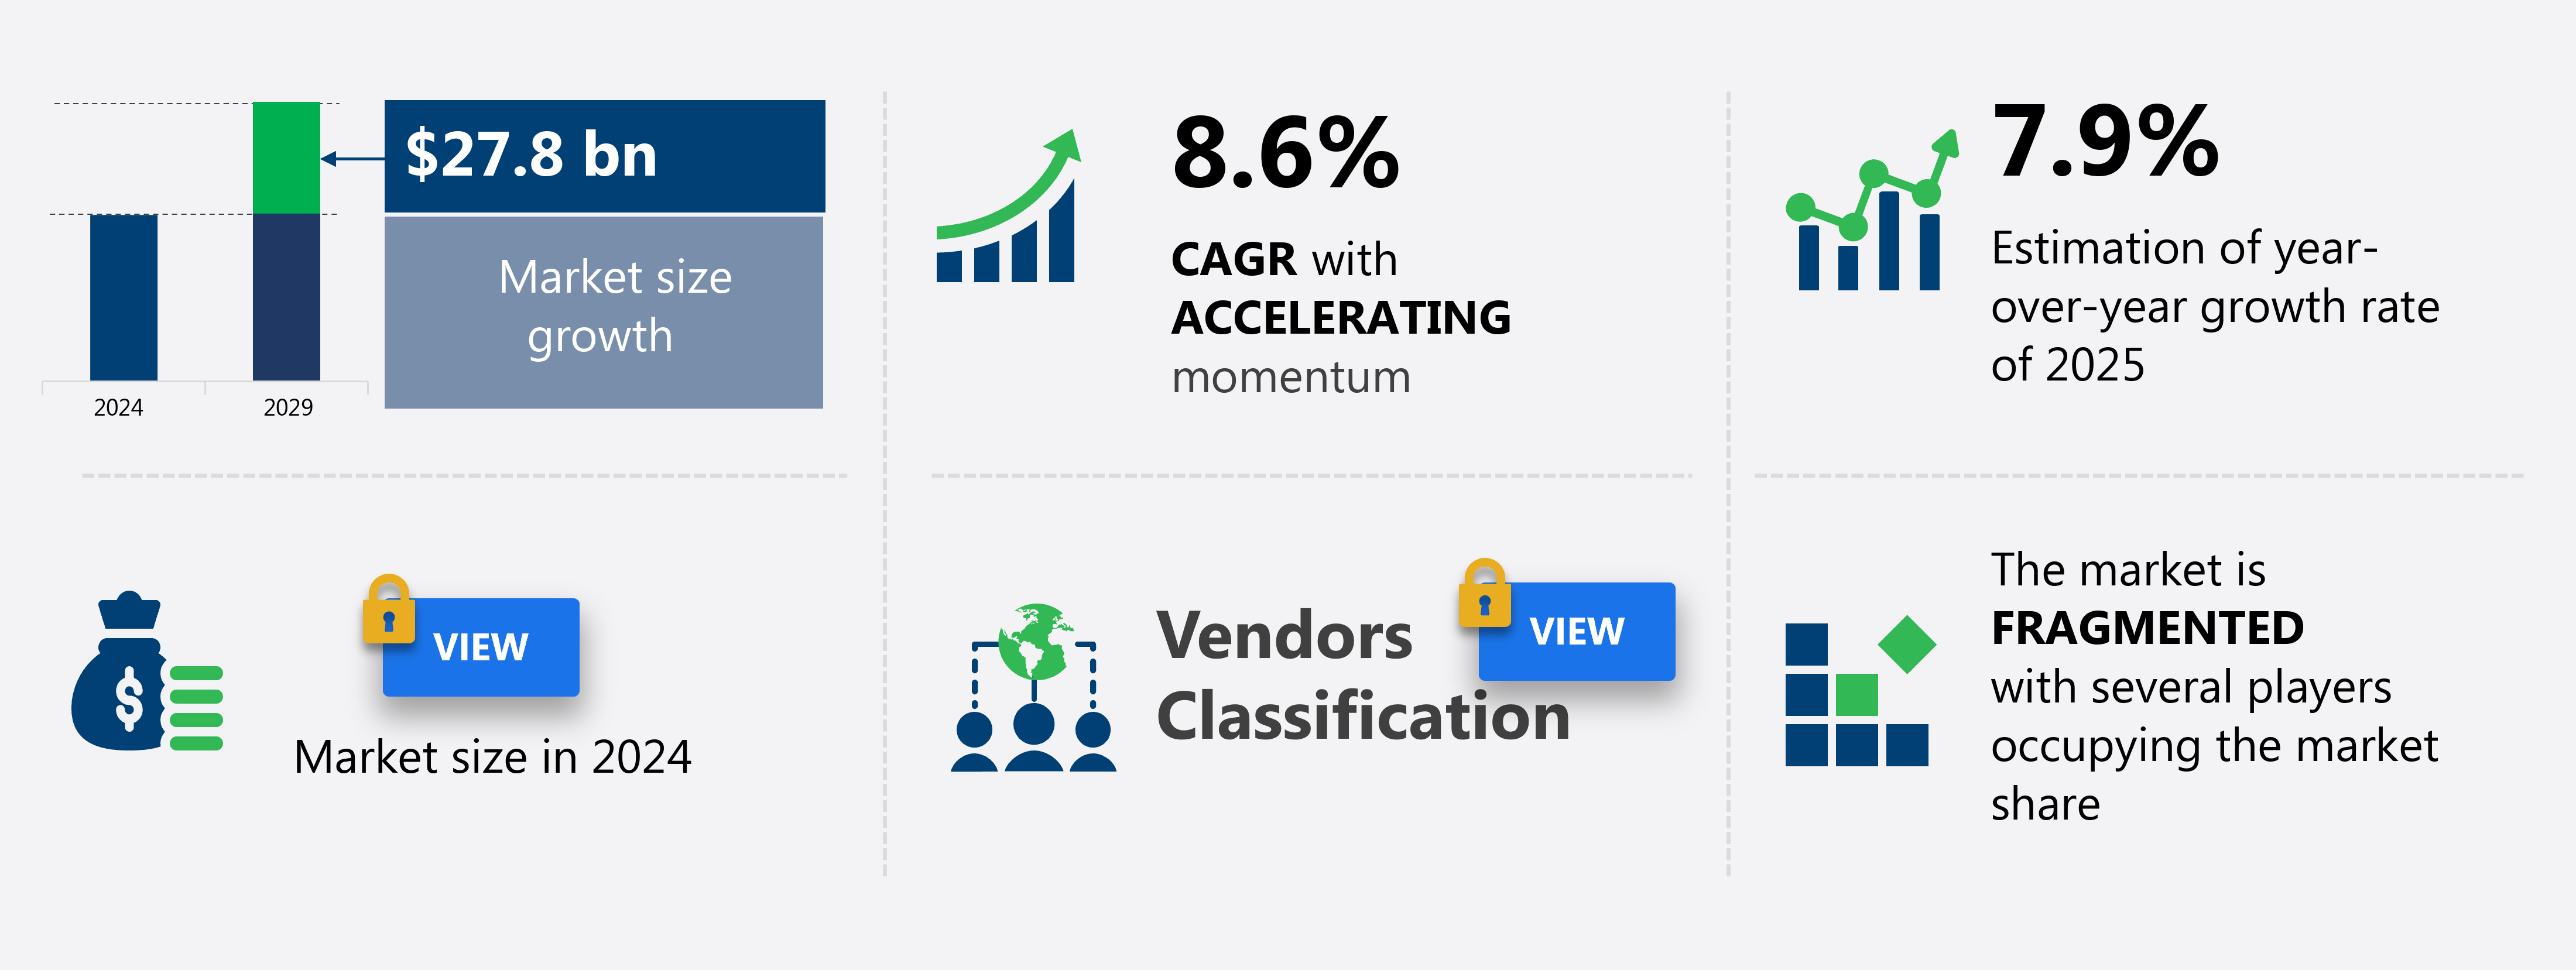
The dietary supplements market in North America size is forecast to increase by USD 27.8 billion at a CAGR of 8.6% between 2024 and 2029.
-
The dietary supplements market is experiencing significant growth, driven by the increasing popularity of e-commerce channels and the rising demand for personalized nutrition solutions. With more consumers prioritizing health and wellness, the market is witnessing a rise in demand for customized supplements tailored to individual needs. However, this market expansion is not without challenges. Navigating this complex regulatory landscape requires a deep understanding of the evolving regulatory requirements and a commitment to maintaining the highest standards of quality and safety.
-
As the market continues to evolve, stakeholders must stay informed of the latest trends and challenges to capitalize on opportunities and mitigate risks. Regulatory hurdles continue to pose a significant barrier, with stringent regulations governing the production, labeling, and distribution of dietary supplements. Dietary supplements, including vitamins, minerals, amino acids, proteins, and nutraceuticals, are increasingly popular for their ability to enhance personal health online grocery, support weight management, and improve overall well-being.
What will be the Size of the market During the Forecast Period?
The dietary supplement industry caters to the growing demand for personalized nutrition, particularly among the aging and elderly population. Vitamin dietary supplements remain popular, but prebiotic supplements and nutraceuticals, such as those offered by Hum Nutrition, are gaining traction due to their nutritional benefits. Dietary supplement companies innovate with new formulations, including premium liquid supplements, microencapsulation technologies, and nanoencapsulation for improved bioavailability.
Weight management and preventive healthcare continue to drive market growth, with fortification of food and self-directed care contributing to the trend. Internet resources enable consumers to research and compare various dietary supplements, including tablets, powders, amino acids, protein supplements, and sports nutritional supplements, to meet their unique well-being needs. The dietary supplements market is experiencing significant growth, driven by the increasing popularity of e-commerce channels and the rising demand for personalized nutrition solutions.
How is this market segmented and which is the largest segment?
The market research report provides comprehensive data (region-wise segment analysis), with forecasts and estimates in "USD billion" for the period 2025-2029, as well as historical data from 2019-2023 for the following segments.
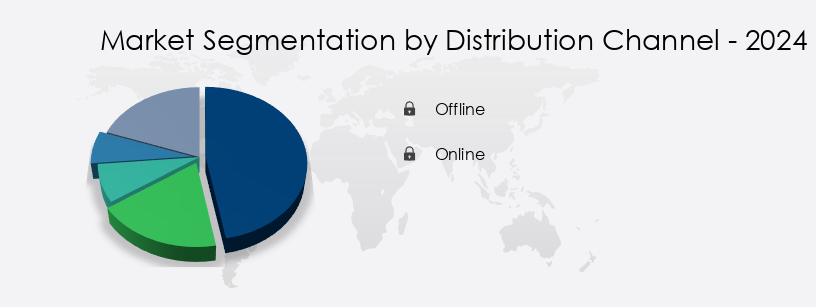
- Distribution Channel
- Offline
- Online
- Product
- Vitamins
- Fatty acids
- Combination
- Probiotics
- Others
- Source
- Plant-based
- Animal-based
- Synthetic-based
- Microbial-based
- Mineral-based
- Form Factor
- Tablets
- Capsules
- Powders
- Gummies
- Geography
- North America
- US
- Canada
- Mexico
- North America
By Distribution Channel Insights
The offline segment is estimated to witness significant growth during the forecast period. Dietary supplements are widely available through various offline distribution channels, including hypermarkets, supermarkets, drug stores, and discount stores. Supermarkets and hypermarkets have gained significant popularity in North America as the preferred distribution channels for dietary supplements. The expanding retail industry and the proliferation of retail outlets contribute to the market's growth. Consumers benefit from the convenience of having a diverse range of supplements under one roof, along with frequent discounts offered for promotional purposes. Prebiotic, premium, and customized dietary supplements, among others, are anticipated to see increased demand in the coming years. Doctor's recommendations, personalized nutrition, and preventive healthcare are driving the market for these supplements.
The geriatric population, with its unique health requirements, presents a significant opportunity for dietary supplements. Cardiovascular health, joint health, immune system function, and bone strength are some of the key health concerns addressed by these supplements. The dietary supplement industry caters to various consumer needs, offering tablets, powders, liquids, soft gels, and capsules. Consumer skepticism regarding supplement safety and bioavailability has led to the adoption of advanced technologies like nanoencapsulation and microencapsulation. Malnourishment and micronutrient deficiencies are prevalent issues, particularly in the elderly population. Dietary supplements offer nutritional benefits, addressing these deficiencies and contributing to overall well-being.
Protein, minerals, vitamins, and amino acids are essential nutrients commonly found in dietary supplements. Herbal and botanical supplements, such as green tea extract and beetroot, cater to specific health concerns. Dietary supplements are not a substitute for whole food sources but can complement a balanced diet. However, adverse effects, such as toxicity and blood pressure concerns, necessitate careful consideration. The food industry's fortification with essential nutrients and the availability of internet resources facilitate consumer education and informed decision-making. Pharmacists and healthcare professionals play a crucial role in recommending suitable dietary supplements based on individual health conditions and needs.
The dietary supplement industry is dynamic, with ongoing research and innovation. Weight management, sports nutrition, and cognitive function are some of the emerging areas of focus. Companies are investing in raw materials, protein supplements, and prescription-based supplements to cater to diverse consumer needs. The market is expected to continue evolving, with a growing emphasis on personalization and customization.
Get a glance at the market report of share of various segments Request Free Sample
Market Dynamics
Our North America Dietary Supplements Market researchers analyzed the data with 2024 as the base year, along with the key drivers, trends, and challenges. A holistic analysis of drivers will help companies refine their marketing strategies to gain a competitive advantage.
The North America dietary supplements market size and forecast projects robust growth, driven by dietary supplements market trends 2025-2029. B2B supplement supply solutions leverage advanced nutraceutical technologies for quality. Dietary supplements market growth opportunities 2025 include supplements for immune health and vegan dietary supplements, meeting consumer demand. Supplement supply chain software optimizes operations, while dietary supplements market competitive analysis highlights key brands. Sustainable supplement production practices align with eco-friendly health trends. Dietary supplements regulations 2025-2029 shapes supplement demand in North America 2025. High-potency supplement solutions and premium dietary supplement insights boost adoption. Supplements for fitness enthusiasts and customized supplement formulations target niches. Dietary supplements market challenges and solutions address compliance, with direct procurement strategies for supplements and supplement pricing optimization enhancing profitability
What are the key market drivers leading to the rise in adoption of North America Dietary Supplements Market?
-
Growing popularity of e-commerce channels is the key driver of the market. The dietary supplement industry has experienced notable growth due to the increasing awareness of obesity and the pursuit of well-being. HUM Nutrition, one of the leading brands, offers a range of supplements with nutritional benefits for weight management and overall health. Raw materials used in dietary supplements include glutamine, protein supplements, green tea extract, nutraceuticals, beetroot, and beta-alanine. The demand for personalization and customization in dietary supplements is on the rise. Consumers seek supplements tailored to their specific needs, such as cognitive function or sports nutrition. Processed food consumption and prescription medication usage can deplete essential nutrients, making dietary supplements an essential addition to daily routines.
-
E-commerce platforms have made purchasing dietary supplements more accessible and convenient. Online retailers like Amazon.Com and vitacost.Com provide specialized portals for health products and dietary supplements. These platforms offer filters to help customers choose supplements based on age and category, real-time chat support, and extensive product and nutritional information. The rise of smartphones and the increasing number of e-commerce providers have made it easier for consumers to access a wide variety of dietary supplements from around the world. With the convenience of online shopping and the availability of extensive product information, consumers can make informed decisions about their health and well-being.
What are the market trends shaping the North America Dietary Supplements Market?
-
Increased focus on personalized nutrition is the upcoming trend in the market. The dietary supplement market in North America caters to the growing trend of personalized nutrition by providing specialized supplements and services. Personalized nutrition involves tailoring dietary recommendations and supplement choices based on an individual's unique needs, preferences, and health goals. Nutrient deficiencies, such as those related to immune system function, diabetes, joint health, and fiber intake, can be identified through assessments, enabling targeted supplementation. Dietary preferences, including vegetarian, vegan, paleo, and gluten-free diets, are also considered to ensure compatibility with an individual's eating pattern. Nanoencapsulation technology, such as soft gels and customized formulations, enhances nutrient absorption and shelf life.
-
Fortification of food and the use of herbal (botanical) supplements are other market trends. Pharmacists and healthcare professionals play a crucial role in recommending personalized dietary supplements to optimize health and wellness. Protein and amino acids are popular supplement categories for athletes and those seeking improved muscle function. Overall, the dietary supplement market continues to evolve, offering innovative solutions to meet the diverse health needs of consumers.
What challenges doesNorth America Dietary Supplements Market face during the growth?
-
Challenging regulatory environment is a key challenge affecting the market growth. The market is experiencing significant growth, leading to increased scrutiny from regulatory bodies like the US Food and Drug Administration (FDA). Over the past decade, the FDA has heightened safety standards for consumable foods and drugs, resulting in a rise in labeling violations related to dietary supplements. Consequently, manufacturers must exercise caution when making nutritional claims and efficacy statements about their products to avoid false advertising. Personalized nutrition and preventive healthcare are key drivers of the market, with consumers seeking supplements for specific health concerns, such as cardiovascular health and blood pressure management. Premium dietary supplements, including tablets, powders, and liquids, cater to various demographics, including the geriatric population and athletes.
-
Prebiotic dietary supplements are gaining popularity due to their potential benefits for gut health. However, consumer skepticism remains regarding the safety and efficacy of some supplements, particularly those with adverse effects. Manufacturers must prioritize bioavailability and transparency in their production processes to build trust with consumers. The market encompasses a wide range of products, from plant-based supplements to sports nutritional supplements. Malnourishment and the desire for optimal health and wellness continue to fuel demand for dietary supplements. As regulations evolve, manufacturers must stay informed and adapt to ensure the safety and efficacy of their offerings.
Exclusive Customer Landscape
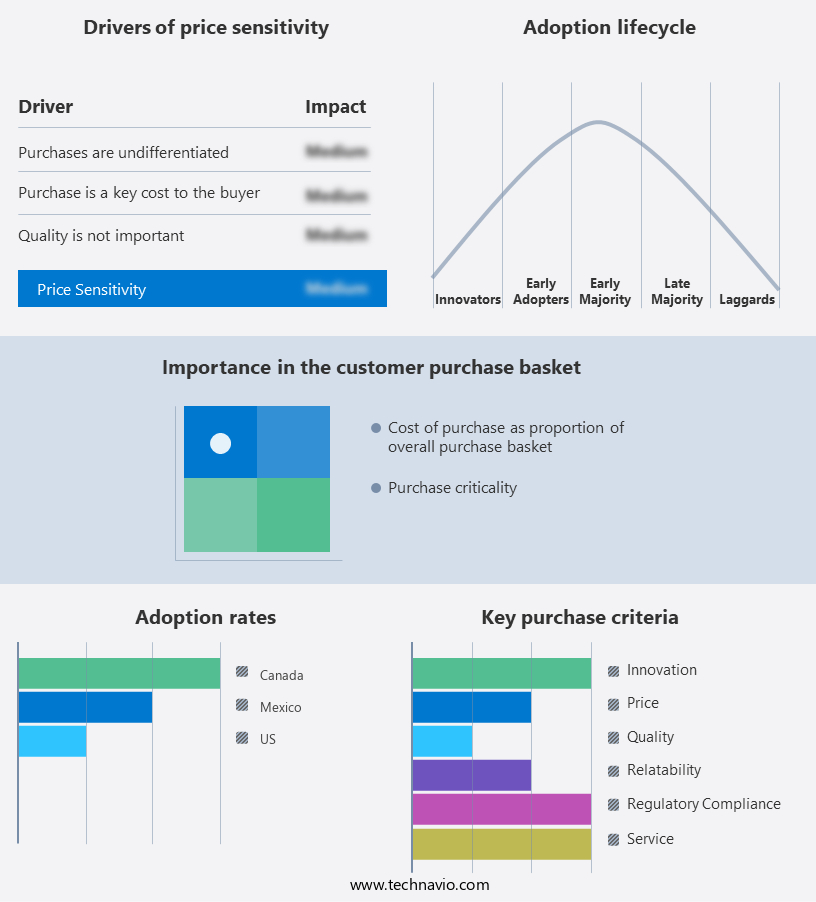
The market forecasting report includes the adoption lifecycle of the market, covering from the innovator's stage to the laggard's stage. It focuses on adoption rates in different regions based on penetration. Furthermore, the market report also includes key purchase criteria and drivers of price sensitivity to help companies evaluate and develop their market growth analysis strategies.
Customer Landscape
Key Companies & Market Insights
Companies are implementing various strategies, such as strategic alliances, market forecast , partnerships, mergers and acquisitions, geographical expansion, and product/service launches, to enhance their presence in the market.
AEGLE Nutrition - The company specializes in the production and distribution of a diverse portfolio of dietary supplements, offering a wide range of health and wellness products.
The market research and growth report includes detailed analyses of the competitive landscape of the market and information about key companies, including:
- AEGLE Nutrition
- BioTech Pharmacal
- Divine Design Manufacturing
- FoodScience LLC
- Gemini Pharmaceuticals
- Gummi World
- Life All Natural
- Life Solution
- Makers Nutrition LLC
- Organimed LLC
- Pharma Natural
- Pharmatech Inc.
- ROCKTOMIC LABS LLC
- Superior Supplement Manufacturing LLC
- Supplement Manufacturing Partner
- Twinlab Consolidated Corp.
- Veluca Inc.
Qualitative and quantitative analysis of companies has been conducted to help clients understand the wider business environment as well as the strengths and weaknesses of key market players. Data is qualitatively analyzed to categorize companies as pure play, category-focused, industry-focused, and diversified; it is quantitatively analyzed to categorize companies as dominant, leading, strong, tentative, and weak.
Recent Development and News in Dietary Supplements Market In North America
- In January 2024, Nestle Health Science, a global leader in nutritional science, announced the launch of its new line of medical food supplements, "Peptamen Orally Unfortified," specifically designed for individuals with gastrointestinal disorders. This expansion marks a significant entry of Nestle into the dietary supplements market for medical conditions (Source: Nestle Health Science Press Release).
- In March 2024, DSM, a leading global science-based company in Nutrition, Health, and Sustainable Living, entered into a strategic partnership with Vitamin D3 manufacturer, DSM Nutritional Products. The collaboration aimed to strengthen DSM's position in the dietary supplements market by expanding its vitamin D3 product offerings (Source: DSM Press Release).
- In May 2024, Amway, a leading direct selling company, announced the acquisition of Nutrilite, a well-known brand in the dietary supplements market. The acquisition was valued at approximately USD1.3 billion, and Nutrilite's product portfolio, including vitamins, minerals, and phytonutrients, would be integrated into Amway's offerings (Source: Amway Press Release).
- In February 2025, the U.S. Food and Drug Administration (FDA) approved the new dietary ingredient (NDI) status for a new form of curcumin, BCM-95, produced by DolCas Biotech. This approval marked a significant milestone for the company and the dietary supplements industry, as BCM-95 is a patented, high-absorption curcumin formulation (Source: DolCas Biotech Press Release).
Research Analyst Overview
The dietary supplement industry continues to evolve, responding to shifting consumer preferences and emerging health trends. Obesity and weight management remain key areas of focus, with hum nutrition and glutamine supplements gaining popularity for their nutritional benefits. However, the industry's scope extends beyond weight management, encompassing well-being and preventive healthcare. Raw materials play a pivotal role in supplement development, with protein supplements, prescription nutraceuticals, and green tea extract among the top choices. The use of plant-based ingredients, such as beetroot and beta alanine, adds to the industry's diversity. Consumer skepticism and adverse effects, including potential interactions with prescription medication, necessitate ongoing research and transparency.
The industry's commitment to bioavailability, nutrient absorption, and personalized nutrition addresses these concerns, with customized dietary supplements and pharmacist consultations becoming more common. Market dynamics are influenced by various factors, including lifestyle disorders, clinical disorders, and the aging population. Preventive healthcare and self-directed care are driving demand for dietary supplements, while fortification of food and nanoencapsulation technologies offer innovative solutions. The industry's evolution is not limited to traditional tablet, powder, and liquid supplements. Soft gels, capsules, and personalized formulations cater to diverse consumer needs. The role of dietary supplements in cardiovascular health, immune system function, and joint health further underscores their importance in maintaining overall well-being.
The dietary supplement industry's continuous adaptation to market demands and consumer preferences underscores its dynamic nature. From obesity and weight management to cognitive function and aging population, dietary supplements offer a range of benefits, making them an integral part of personal health and wellness. The Dietary Supplements Market in North America is experiencing rapid growth, driven by rising self directed care, increasing awareness of well being, and escalating overweight issues. Consumers are shifting from junk food to plant based products and plant protein ingredients to address micronutrient deficiency. Popular offerings include powder dietary supplements, liquid dietary supplements, sports nutrition supplements, and weight management supplements. Products such as multivitamins, glucosamine, and mineral supplementsâoften encapsulated in a gelatin based shellâare gaining momentum due to strong doctors recommendation. With a focus on immune health, the market continues to evolve in line with personalized wellness goals.
Dive into Technavio's strong research methodology, blending expert interviews, extensive data synthesis, and validated models for unparalleled Dietary Supplements Market in North America insights. See full methodology.
|
Market Scope |
|
|
Report Coverage |
Details |
|
Page number |
201 |
|
Base year |
2024 |
|
Historic period |
2019-2023 |
|
Forecast period |
2025-2029 |
|
Growth momentum & CAGR |
Accelerate at a CAGR of 8.6% |
|
Market growth 2025-2029 |
USD 27.8 billion |
|
Market structure |
Fragmented |
|
YoY growth 2024-2025(%) |
7.9 |
|
Key countries |
US, Mexico, and Canada |
|
Competitive landscape |
Leading Companies, Market Positioning of Companies, Competitive Strategies, and Industry Risks |
What are the Key Data Covered in this Market Research and Growth Report?
- CAGR of the market during the forecast period
- Detailed information on factors that will drive the market growth and forecasting between 2025 and 2029
- Precise estimation of the size of the market and its contribution of the market in focus to the parent market
- Accurate predictions about upcoming market growth and trends and changes in consumer behaviour
- Growth of the market across North America
- Thorough analysis of the market's competitive landscape and detailed information about companies
- Comprehensive analysis of factors that will challenge the growth of market companies
We can help! Our analysts can customize this market research report to meet your requirements. Get in touch
 RIA -
RIA - 
