
Protein Ingredients Market Size 2024-2028
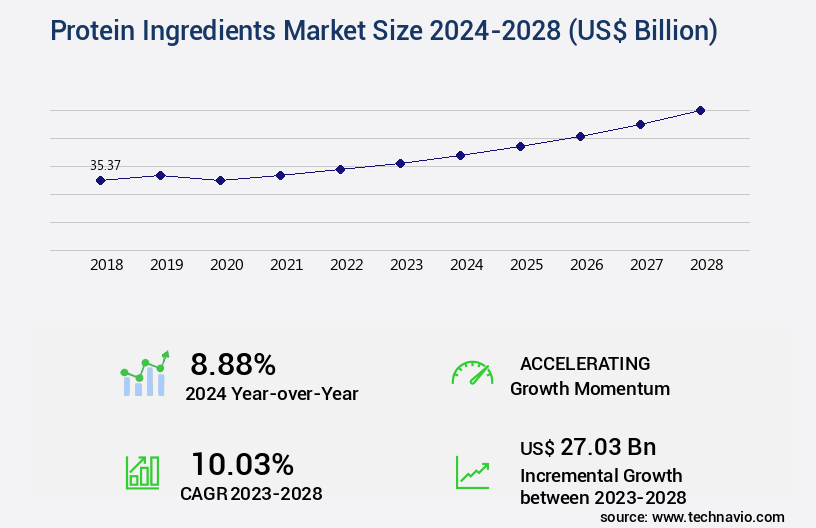
The protein ingredients market size is valued to increase by USD 27.03 billion, at a CAGR of 10.03% from 2023 to 2028. Growing infant formula market will drive the protein ingredients market.
Market Insights
- Europe dominated the market and accounted for a 36% growth during the 2024-2028.
- By Source - Animal based protein segment was valued at USD 27.19 billion in 2022
- By Application - Food and Beverage segment accounted for the largest market revenue share in 2022
Market Size & Forecast
- Market Opportunities: USD 101.13 billion
- Market Future Opportunities 2023: USD 27025.60 billion
- CAGR from 2023 to 2028 : 10.03%
Market Summary
- The market is a dynamic and globally dispersed industry that caters to the demand for high-quality, nutrient-rich components in various sectors, including food and beverage, pharmaceuticals, and sports nutrition. Fueled by the surge in consumer preference for healthier and more sustainable food options, the market is witnessing significant growth. One of the primary drivers is the increasing demand for protein in the infant formula industry, as parents seek to provide optimal nutrition for their growing children. Another trend shaping the market is the rise in promotional and marketing initiatives by manufacturers to boost sales and expand their customer base.
- Despite this growth, the market remains highly fragmented, with numerous players competing for market share. This fragmentation poses challenges for companies seeking to optimize their supply chains and ensure operational efficiency. For instance, a leading protein ingredient supplier might face challenges in managing its global supply chain to meet the increasing demand for its products. To address this, the company could invest in advanced technologies, such as predictive analytics and real-time inventory management systems, to streamline operations and ensure timely delivery to customers. Additionally, the company could explore strategic partnerships and collaborations to expand its product offerings and cater to diverse market segments.
- In conclusion, the market is a vibrant and evolving industry, driven by factors such as consumer preferences, marketing initiatives, and the need for operational efficiency. Companies must navigate the challenges of a fragmented market while capitalizing on opportunities to grow and thrive in this dynamic landscape.
What will be the size of the Protein Ingredients Market during the forecast period?
Get Key Insights on Market Forecast (PDF) Request Free Sample
- Protein ingredients have been a pivotal component in various industries, including food and beverage, pharmaceuticals, and nutraceuticals. The protein market continues to evolve, with ongoing advancements in protein characterization, protein blends, and protein modification. One significant trend is the increasing demand for gluten-free proteins, as consumer preferences shift towards healthier and allergen-free options. Protein structure and protein degradation have been critical areas of focus for researchers and manufacturers. Hydrolyzed proteins and protein isolates have gained popularity due to their improved protein digestibility and bioavailability. Protein quality is another essential factor, with animal-based proteins and plant-based proteins each offering unique advantages.
- Single-cell proteins have emerged as a promising alternative to traditional animal-based proteins, providing a sustainable and ethical solution for meeting the growing protein demand. Amino acid composition plays a crucial role in protein quality and functionality. Protein engineering and protein synthesis have enabled the production of proteins with specific properties, such as improved protein stability and protein bioavailability. Protein quantification is essential for ensuring product consistency and meeting regulatory requirements. Protein unfolding and protein folding are key aspects of protein structure and function, with implications for protein crystallization and protein synthesis. Peptide bonds, the linkages between amino acids, are vital to protein structure and functionality.
- Incorporating protein fortification into various applications, from food and beverages to pharmaceuticals, can enhance nutritional value and cater to diverse consumer needs. Protein metabolism is a complex process that impacts overall health and wellness, making protein research a vital area of ongoing investigation.
Unpacking the Protein Ingredients Market Landscape
In the dynamic the market, digestibility studies play a pivotal role in ensuring optimal nutritional value for various food and pharmaceutical applications. For instance, whey protein isolate, derived through advanced filtration and membrane technologies, boasts a higher protein content and superior digestibility compared to other protein sources. Moreover, protein hydrolysates, obtained through enzymatic hydrolysis, offer improved solubility and gelation properties, enhancing emulsion stability and functional performance in food formulations. Molecular weight distribution and amino acid profiles are essential factors in evaluating protein ingredients. Mass spectrometry and electrophoretic analysis enable precise identification and quantification of protein components, ensuring compliance with regulatory standards and maintaining consistency in product quality. Nitrogen content analysis is another critical method for assessing protein content and purity, contributing to cost reduction and increased ROI for manufacturers. Protein interactions, allergen detection, and microbial contamination are significant concerns in the industry. Chromatographic separation techniques, such as high-performance liquid chromatography (HPLC), facilitate the purification of protein ingredients and ensure the elimination of potential contaminants, thereby improving product safety and shelf-life stability. Sensory evaluation, rheological behavior, and textural characteristics are essential factors in assessing protein functionality and meeting consumer preferences. Protein denaturation, casein protein micelles, and protein purification are essential aspects of the market, with each process contributing to the optimization of protein functionality and nutritional value. In feed formulations, protein interactions and functional properties play a crucial role in enhancing animal performance and overall efficiency. Pharmaceutical uses of protein ingredients, such as peptide sequencing and bioactive peptides, offer significant potential for therapeutic applications and improving patient outcomes.
Key Market Drivers Fueling Growth
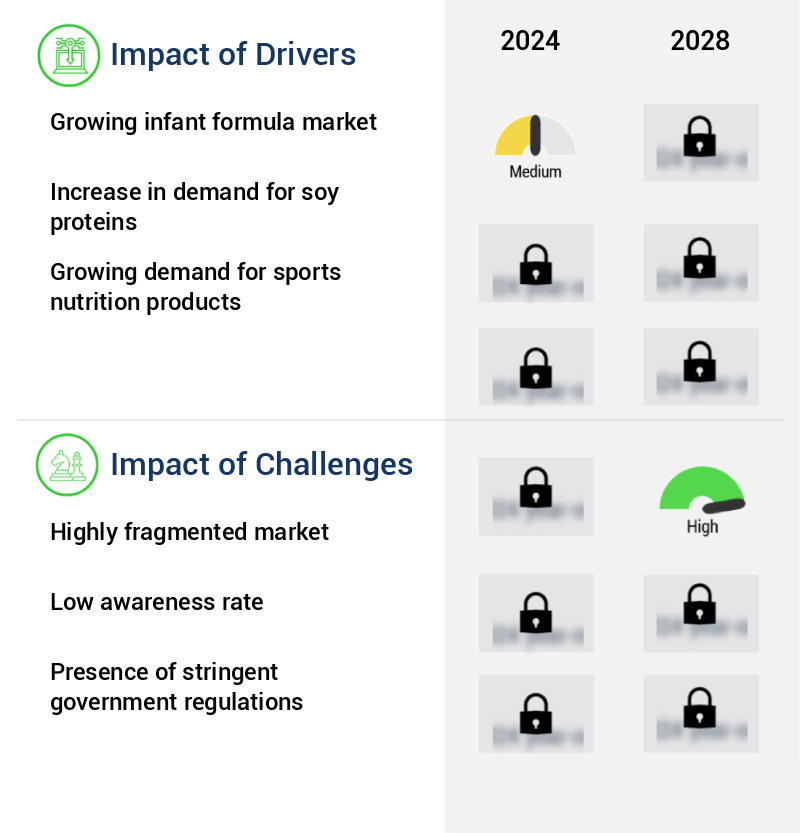
The expanding infant formula market serves as the primary catalyst for market growth.
- The market showcases a dynamic evolution, driven by its extensive applications across various sectors. In the health and nutrition domain, infant formula represents a significant growth area. Infant formula, a crucial source of nutrition for babies between 6 to 12 months, is increasingly gaining popularity due to its nutritional benefits, rising awareness among parents, and demographic shifts such as an increase in birth rates and working women. Consequently, the demand for protein ingredients, primarily soy and whey, used in infant formula production, is experiencing a notable surge.
- Additionally, the food and beverage industry leverages protein ingredients for their functional, nutritional, and textural benefits, contributing to the market's expansion. Overall, the market's growth trajectory is marked by continuous innovation and increasing demand for high-quality, sustainable, and functional protein ingredients.
Prevailing Industry Trends & Opportunities
Increase in promotional and marketing initiatives is the current market trend. This refers to the growing emphasis on strategic marketing campaigns and promotional activities to engage customers and boost sales.
- The market is experiencing significant evolution, driven by increasing promotional efforts from companies and supportive initiatives by government bodies. Soy protein, a prominent segment, has witnessed substantial growth due to extensive marketing campaigns. companies have invested heavily in promoting soy protein to food manufacturers and consumers, resulting in increased market penetration. The US government's support for soy protein health claims and promotion further boosts the market's growth.
- This strategic approach has led to a notable increase in product adoption across various sectors, including food and beverage, pharmaceuticals, and nutraceuticals. Consequently, the demand for protein ingredients has risen, with soy protein experiencing a significant market share. This trend underscores the dynamic nature of the market and its expanding applications.
Significant Market Challenges
A highly fragmented market structure poses a significant challenge to the growth and development of the industry.
- The market showcases an evolving landscape, driven by the expanding applications across various sectors. Despite the market's highly fragmented nature, characterized by a vast array of small and large players, competition remains fierce. For instance, in plant-based protein ingredients, the number of end-users, primarily in the food and beverage industry, is limited. However, innovation is the key to overcoming this challenge. companies are investing in research and development to create novel protein sources and improve existing ones. For example, soy protein manufacturers have reduced their production costs by 12%, making it a more cost-effective alternative to animal-derived proteins.
- Similarly, the use of pea protein in plant-based meat alternatives has increased by 18%, offering consumers a more sustainable and ethical option. These advancements not only cater to the growing demand for plant-based protein sources but also contribute to the overall market growth.
In-Depth Market Segmentation: Protein Ingredients Market
The protein ingredients industry research report provides comprehensive data (region-wise segment analysis), with forecasts and estimates in "USD billion" for the period 2024-2028, as well as historical data from 2018-2022 for the following segments.
- Source
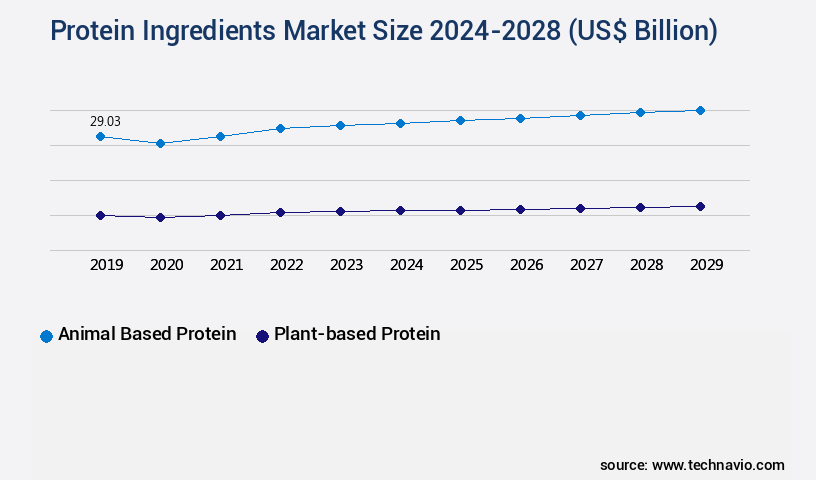
- Animal based protein
- Plant-based protein
- Application
- Food and Beverage
- Nutraceuticals
- Animal Feed
- Cosmetics
- Form
- Powder
- Liquid
- Concentrates
- Geography
- North America
- US
- Canada
- Europe
- France
- Germany
- Italy
- Russia
- UK
- Middle East and Africa
- South Africa
- UAE
- APAC
- China
- India
- Japan
- South Korea
- South America
- Argentina
- Brazil
- Rest of World (ROW)
- North America
By Source Insights
The animal based protein segment is estimated to witness significant growth during the forecast period.
Protein ingredients, derived from animal sources like eggs and milk, hold significant importance in various food applications, including desserts, sports nutrition, dietary supplements, and bakery products. Dairy protein ingredients, particularly whey protein isolate and casein protein micelles, are extensively utilized in nutrient-rich food products, especially in sports nutrition and infant nutrition. However, the market for protein ingredients faces intense competition due to the emergence of plant-based alternatives, which offer cost advantages. The incidence of diseases such as bovine spongiform encephalopathy (BSE) among cattle poses a challenge. Protein ingredients undergo various processes, such as extraction methods, chromatographic separation, and enzymatic hydrolysis, to ensure desirable textural characteristics, protein solubility, and gelation properties.
Quality control testing, sensory evaluation, and protein functionality are crucial aspects of ensuring product consistency and nutritional value. Protein interactions, allergen detection, and microbial contamination are also key considerations. The market's evolution involves continuous research on improving protein hydrolysates, bioactive peptides, and understanding protein denaturation and molecular weight distribution for optimized amino acid profiles and nitrogen content.
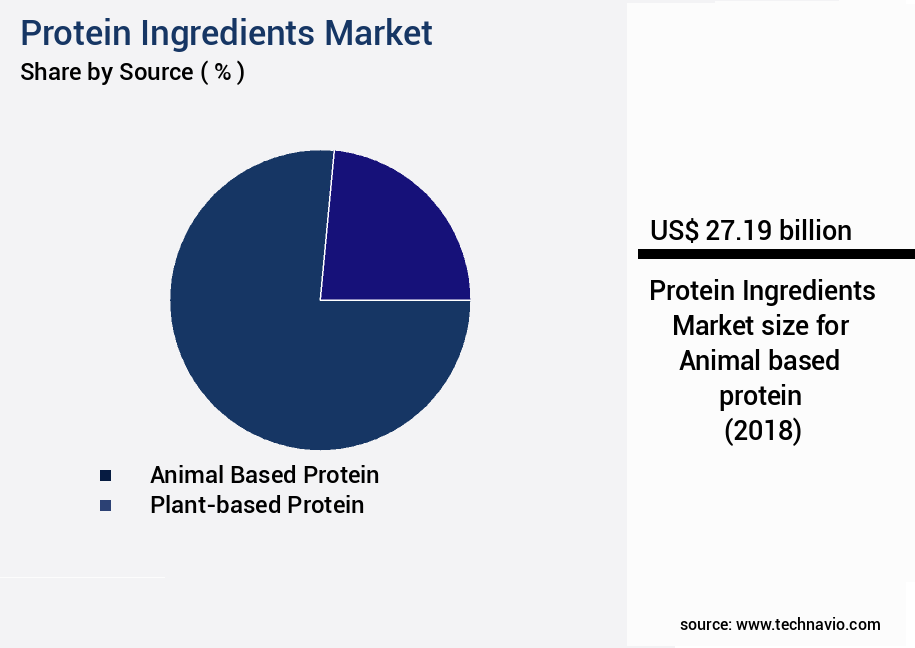
The Animal based protein segment was valued at USD 27.19 billion in 2018 and showed a gradual increase during the forecast period.
Regional Analysis
Europe is estimated to contribute 36% to the growth of the global market during the forecast period.Technavio’s analysts have elaborately explained the regional trends and drivers that shape the market during the forecast period.

See How Protein Ingredients Market Demand is Rising in Europe Request Free Sample
The market in Europe is experiencing significant growth, fueled by the increasing demand for high-nutrition products, particularly in the sports nutrition and functional food sectors. This trend is driven by a health-conscious population, rising disposable income, and the growing adoption of plant-based diets in countries like the UK, Germany, and France. According to industry reports, the European sports nutrition market is projected to expand at a rate above 3%, reflecting this demand.
The market's fragmented landscape hosts numerous companies, offering opportunities for operational efficiency gains and cost reductions through strategic collaborations and innovation. These dynamics underline the market's evolving nature and its potential for continued growth.

Customer Landscape of Protein Ingredients Industry
Competitive Intelligence by Technavio Analysis: Leading Players in the Protein Ingredients Market
Companies are implementing various strategies, such as strategic alliances, protein ingredients market forecast, partnerships, mergers and acquisitions, geographical expansion, and product/service launches, to enhance their presence in the industry.
Archer Daniels Midland Co. - This company specializes in Animal Nutrition, delivering cutting-edge ingredient solutions and services to enhance performance, profitability, and efficiency for animal feed, aquaculture, and pet food producers globally. Through innovative approaches, it empowers clients to make informed decisions and optimize their operations.
The industry research and growth report includes detailed analyses of the competitive landscape of the market and information about key companies, including:
- Archer Daniels Midland Co.
- Axiom Foods Inc.
- Burcon NutraScience Corp
- Cargill Inc.
- CHS Inc
- Darling Ingredients Inc.
- DuPont de Nemours Inc.
- Farbest Brands
- Fonterra Cooperative Group Ltd.
- Ingenza Ltd.
- Kewpie Corp.
- Mead Johnson and Co. LLC
- Perfect Day Inc.
- Proeon
- Protera
- Roquette Freres SA
- Rousselot SDN. BHD.
- Sotexpro
- The Peterson Company
- Victory Hemp Foods
- Ynsect SAS
Qualitative and quantitative analysis of companies has been conducted to help clients understand the wider business environment as well as the strengths and weaknesses of key industry players. Data is qualitatively analyzed to categorize companies as pure play, category-focused, industry-focused, and diversified; it is quantitatively analyzed to categorize companies as dominant, leading, strong, tentative, and weak.
Recent Development and News in Protein Ingredients Market
- In August 2024, Arla Foods, a leading dairy cooperative, announced the launch of its new plant-based protein ingredient line, ProFit Plant, at the Food Ingredients Europe trade show. This expansion marks Arla's entry into the growing plant-based protein market (Source: Arla Foods Press Release).
- In November 2024, DSM, a global science-based company in nutrition, health, and sustainable living, entered into a strategic partnership with Perfect Day, a California-based food tech company, to produce animal-free protein using microorganisms. This collaboration aims to reduce the carbon footprint and improve sustainability in the protein ingredients industry (Source: DSM Press Release).
- In March 2025, Ajinomoto Co. Inc., a world leader in amino acids and protein solutions, completed the acquisition of Kerry's Taste & Nutrition business for €3.4 billion. This acquisition significantly expanded Ajinomoto's portfolio of functional ingredients, including proteins, and strengthened its position in the global market (Source: Ajinomoto Co. Inc. Press Release).
- In May 2025, DuPont Nutrition & Biosciences, a leading global producer of food and beverage ingredients, received regulatory approval for its new soy protein isolate, Protique Soy 9700. This high-performance protein ingredient offers improved functionality and taste, making it a popular choice for various food and beverage applications (Source: DuPont Nutrition & Biosciences Press Release).
Dive into Technavio’s robust research methodology, blending expert interviews, extensive data synthesis, and validated models for unparalleled Protein Ingredients Market insights. See full methodology.
|
Market Scope |
|
|
Report Coverage |
Details |
|
Page number |
147 |
|
Base year |
2023 |
|
Historic period |
2018-2022 |
|
Forecast period |
2024-2028 |
|
Growth momentum & CAGR |
Accelerate at a CAGR of 10.03% |
|
Market growth 2024-2028 |
USD 27.03 billion |
|
Market structure |
Fragmented |
|
YoY growth 2023-2024(%) |
8.88 |
|
Key countries |
Brazil, South Africa, UAE, US, Canada, Germany, UK, China, France, Italy, Japan, India, South Korea, Argentina, and Russia |
|
Competitive landscape |
Leading Companies, Market Positioning of Companies, Competitive Strategies, and Industry Risks |
Why Choose Technavio for Protein Ingredients Market Insights?
"Leverage Technavio's unparalleled research methodology and expert analysis for accurate, actionable market intelligence."
The market encompasses a diverse range of products, including whey protein isolates, soy protein concentrates, casein proteins, and plant-based sources. Each type offers unique functionalities and food applications. For instance, whey protein isolates, with their high functionality, are widely used in nutritional supplements and food systems due to their solubility and emulsifying properties. Soy protein concentrates, known for their rheological properties, are suitable for use in various food systems, from meat analogs to baked goods. Casein proteins, with their micelles stability, play a crucial role in dairy products, providing texture and improving the nutritional value. Amino acid profiles influence protein digestibility, and plant-based protein extraction methods comparison is essential for businesses seeking to optimize supply chain and compliance. Enzymatic hydrolysis impacts protein functionality, affecting solubility and gelation properties, which in turn influence food texture and structure. Mass spectrometry analysis and protein characterization techniques, such as protein purification methods comparison, are vital for quality control testing in protein ingredients production. Allergen detection methods are essential to ensure food safety and operational planning in protein-based products. Protein interaction effects on food system stability and bioactive peptides identification and characterization are areas of ongoing research, offering potential benefits for health-conscious consumers. Protein denaturation effects from processing techniques must be considered to maintain product quality and consistency. Microbial contamination detection is crucial to maintain product safety and regulatory compliance. Functional properties of whey protein concentrates, such as their high nutritional value and molecular weight distribution, make them a popular choice for various applications. The nutritional value of plant-based protein sources continues to grow in popularity, accounting for over 10% of the market. Protein metabolism effects on health and molecular weight distribution impact protein functionality are key considerations for businesses seeking to develop innovative and high-performing protein ingredients.
What are the Key Data Covered in this Protein Ingredients Market Research and Growth Report?
-
What is the expected growth of the Protein Ingredients Market between 2024 and 2028?
-
USD 27.03 billion, at a CAGR of 10.03%
-
-
What segmentation does the market report cover?
-
The report is segmented by Source (Animal based protein and Plant-based protein), Geography (Europe, North America, APAC, South America, and Middle East and Africa), Application (Food and Beverage, Nutraceuticals, Animal Feed, and Cosmetics), and Form (Powder, Liquid, and Concentrates)
-
-
Which regions are analyzed in the report?
-
Europe, North America, APAC, South America, and Middle East and Africa
-
-
What are the key growth drivers and market challenges?
-
Growing infant formula market, Highly fragmented market
-
-
Who are the major players in the Protein Ingredients Market?
-
Archer Daniels Midland Co., Axiom Foods Inc., Burcon NutraScience Corp, Cargill Inc., CHS Inc, Darling Ingredients Inc., DuPont de Nemours Inc., Farbest Brands, Fonterra Cooperative Group Ltd., Ingenza Ltd., Kewpie Corp., Mead Johnson and Co. LLC, Perfect Day Inc., Proeon, Protera, Roquette Freres SA, Rousselot SDN. BHD., Sotexpro, The Peterson Company, Victory Hemp Foods, and Ynsect SAS
-
We can help! Our analysts can customize this protein ingredients market research report to meet your requirements.
 RIA -
RIA - 
