Nuclear Medicine Market Size 2025-2029
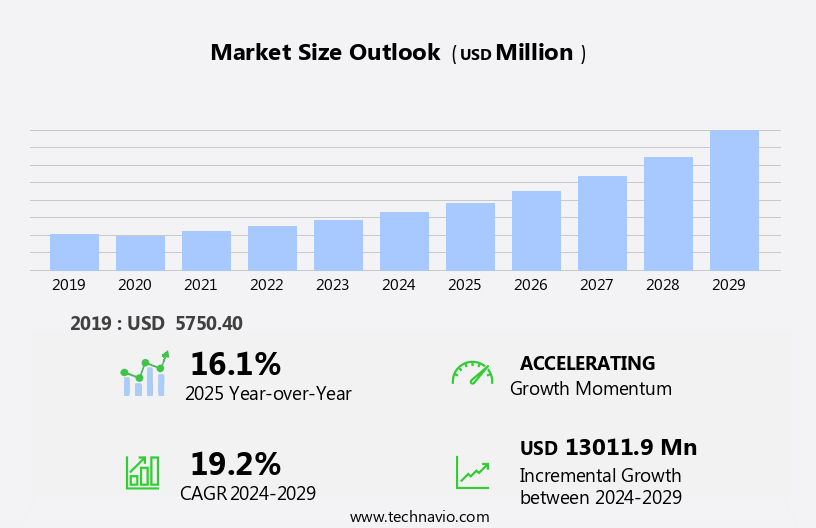
The nuclear medicine market size is forecast to increase by USD 13.01 billion at a CAGR of 19.2% between 2024 and 2029.
- The market is experiencing significant growth, driven by the increasing adoption of advanced imaging technologies such as single-photon emission computed tomography (SPECT) and SPECT/CT hybrid systems. These innovative imaging solutions offer enhanced diagnostic capabilities, improving medical diagnostics and enabling early detection of various diseases. Additionally, the minimal side effects of radiopharmaceuticals, compared to their potential benefits, are fueling market growth. However, regulatory hurdles related to the preparation and distribution of radiopharmaceuticals pose challenges to market expansion. In the field of cancer treatment, the integration of nuclear medicine with chemotherapy methods is gaining traction, further expanding the market's scope. Technological advancements in medical diagnostics, including the development of MRI systems and X-ray crystallography, are also contributing to the market's growth trajectory.
What will be the Size of the Nuclear Medicine Market During the Forecast Period?
- The market encompasses the production and application of radioisotopes and radiopharmaceuticals for diagnostic and therapeutic purposes. This market is driven by several factors, including the growing prevalence of chronic diseases such as cancer, cardiovascular disease, neurology, and lymphoma. The geriatric population, with its higher incidence of these conditions, represents a significant market opportunity. Technologically advanced systems, including SPECT diagnosis and MRI, are increasingly utilized in clinical areas like cardiology, oncology, and neurology.
- Hospital budgets and insurance coverage remain key considerations, with reimbursement facilities playing a crucial role in market expansion. Pharmaceutical drugs and radioactive isotopes are integral components of therapeutic radiopharmaceuticals, which are gaining traction in cancer treatment through minimally invasive techniques and chemotherapy methods. The market's size and direction reflect the ongoing demand for nuclear medicine In the diagnosis and treatment of various clinical conditions.
How is the Nuclear Medicine Industry segmented and which is the largest segment?
The industry research report provides comprehensive data (region-wise segment analysis), with forecasts and estimates in "USD billion" for the period 2025-2029, as well as historical data from 2019-2023 for the following segments.
- Product
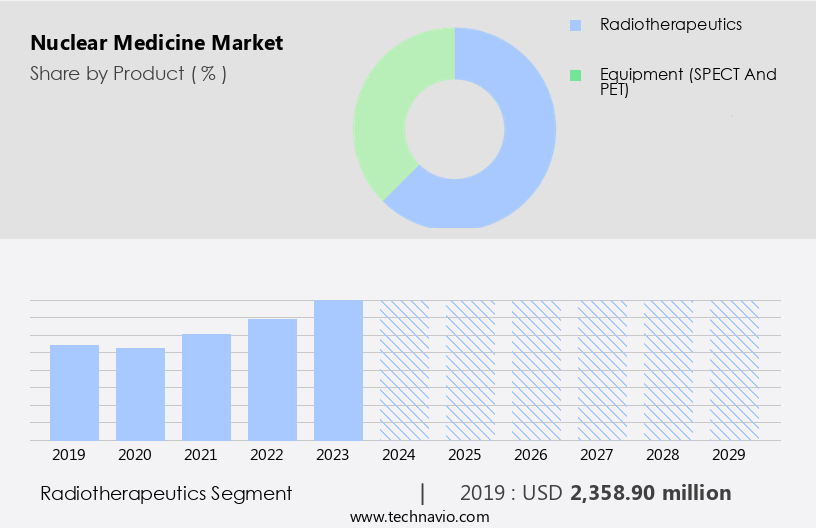
- Radiotherapeutics
- Equipment (SPECT and PET)
- Application
- Oncology
- Cardiology
- Neurology
- Others
- Geography
- North America
- Canada
- US
- Asia
- China
- India
- Japan
- South Korea
- Europe
- Germany
- UK
- France
- Rest of World (ROW)
- North America
By Product Insights
- The radiotherapeutics segment is estimated to witness significant growth during the forecast period. Radiotherapeutics, comprised of radioisotopes bonded to organic molecules, serve as essential pharmaceutical drugs with therapeutic and diagnostic applications. Their utilization extends to treating various diseases, including cancer and cardiac conditions. The importance of precise diagnosis has fueled the demand for advanced diagnostic techniques. In the realm of therapeutics, radioisotopes emitting short-range particles, such as beta or alpha, are employed for localized treatment, causing significant cell damage. The radiopharmaceutical industry encompasses diagnostic and therapeutic modalities, with applications in neurology, cardiology, and oncology, among others. Disease areas like neurological disorders, such as Alzheimer's and Parkinson's diseases, and chronic conditions, such as lymphoma and bone metastasis, are increasingly being addressed with radiotherapeutics.
- Radiopharmaceuticals, including SPECT radiopharmaceuticals like Technetium 99m, Iodine 123, Xenon 133, and Thallium 201, play a crucial role in diagnostic imaging. Therapeutic radiopharmaceuticals, such as Lutathera injection for neuroendocrine tumors, and various isotopes for brachytherapy, offer effective cancer treatment options. The healthcare infrastructure, including hospitals, imaging centers, contract research organizations, and diagnostic centers, relies on these advanced technologies for accurate diagnosis and treatment. Medical specialties, such as radiology, oncology, and cardiology, leverage radiotherapeutics and imaging technology, including PET, SPECT, MRI, CT scanners, and ultrasonography, to provide minimally invasive techniques and chemotherapy methods. Trained medical personnel employ radiolabeling and targeting specificity to enhance therapeutic efficacy and ensure accurate diagnosis.
Get a glance at the market report of share of various segments Request Free Sample
The Radiotherapeutics segment was valued at USD 2.36 billion in 2019 and showed a gradual increase during the forecast period.
Regional Analysis
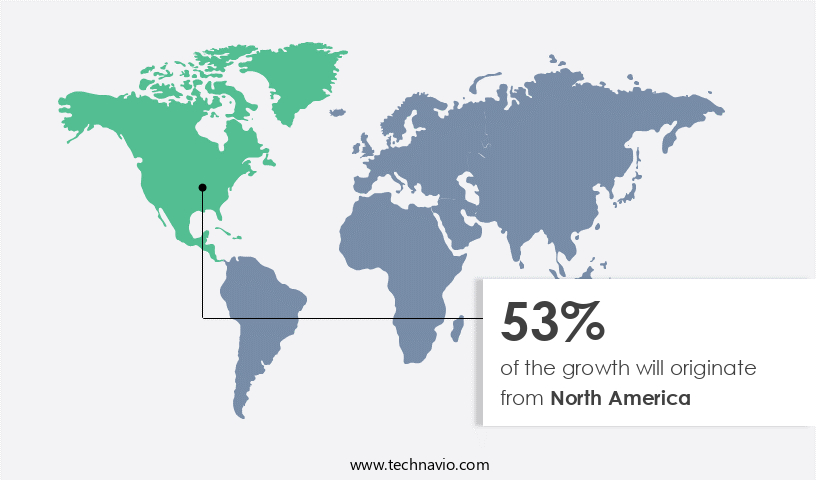
- North America is estimated to contribute 53% to the growth of the global market during the forecast period. Technavio's analysts have elaborately explained the regional trends and drivers that shape the market during the forecast period.
For more insights on the market size of various regions, Request Free Sample
The North American region dominates the market, with the US and Canada being the leading contributors due to advances in hospital infrastructure and healthcare policies. The adoption of hybrid operating rooms and cloud computing in healthcare is driving market expansion. SPECT scanning systems, which offer lower costs and technological advancements, are experiencing increased utilization, fueling the demand for nuclear medicine In the region. SPECT scanners, which are extensively used and one of the oldest medical imaging devices, are widely adopted across clinical areas such as neurology, cardiology, and oncology for diagnosing chronic diseases like Alzheimer's, Parkinson's, cardiovascular diseases, and cancers.
Nuclear medicine's non-invasive nature, combined with the availability of diagnostic equipment like PET scans, MRI, CT scanners, and ultrasonography, ensures accurate diagnosis and effective therapeutic modalities. The market's growth is further supported by the increasing prevalence of diseases, insurance coverage, and reimbursement facilities, making it an essential component of the healthcare system.
Market Dynamics
Our researchers analyzed the data with 2024 as the base year, along with the key drivers, trends, and challenges. A holistic analysis of drivers will help companies refine their marketing strategies to gain a competitive advantage.
What are the key market drivers leading to the rise in the adoption of Nuclear Medicine Industry?
- Growing adoption of SPECT/CT hybrid imaging systems is the key driver of the market. Nuclear medicine, which includes diagnostic and therapeutic modalities, is a significant segment in healthcare systems. The geriatric population's increasing prevalence, particularly in chronic diseases such as cancer and cardiovascular disease, fuels the market's growth. Technologically advanced systems like SPECT and PET radiopharmaceuticals, such as Technetium 99m, Iodine 123, Xenon 133, Thallium 201, Lutathera injection, and Neuroendocrine tumors, contribute to accurate diagnosis and therapeutic efficacy. Hospital budgets and insurance coverage influence the adoption of these advanced systems. Reimbursement facilities for radioactive isotopes and trained medical personnel are essential for the effective implementation of these diagnostic and therapeutic tools. Neurological disorders like Alzheimer's disease and Parkinson's disease, as well as cardiovascular diseases, are common clinical areas where nuclear medicine plays a crucial role.
- Cardiac patients benefit from clear imaging techniques provided by SPECT and PET scans. Diagnostic centers and imaging centers use various radiopharmaceuticals for diagnostic purposes, while contract research organizations and pharmaceutical drugs use them for research and development. Minimally invasive techniques and chemotherapy methods are enhanced by therapeutic radiopharmaceuticals in cancer treatment. Hybrid imaging technologies, such as PET-CT and SPECT-CT, offer improved diagnostic accuracy. Magnetic resonance imaging (MRI), CT scanners, ultrasonography, and nuclear imaging techniques are essential diagnostic equipment in the medical diagnostic sector. Radiolabeling and targeting specificity are essential factors in enhancing the therapeutic efficacy of radiopharmaceuticals. The radiopharmaceuticals industry continues to evolve, with ongoing research and development in PET, SPECT, and therapeutic radiopharmaceuticals.
What are the market trends shaping the Nuclear Medicine Industry?
- Minimal side effects of radiopharmaceuticals as compared with its potential benefits is the upcoming market trend. Nuclear medicine, which utilizes radioisotopes for diagnostic and therapeutic purposes, has gained significant traction in the healthcare industry due to its minimal side effects and high benefits. Common side effects include soreness, bleeding, and swelling at the injection site, but these occurrences are infrequent. The NIH reported that the rate of adverse effects for the lung visualization agent macro aggregated albumin was 1 in 400 cases, and for bone-seeking radiopharmaceutical methylene diphosphonate, it was 1 in 800 cases.
- The use of radiopharmaceuticals in nuclear medicine is essential in various clinical areas, including neurology, cardiology, and oncology, for diagnosing and treating chronic diseases such as cancer, neurological disorders like Alzheimer's and Parkinson's disease, and cardiovascular diseases. Technologically advanced systems, such as SPECT, PET radiopharmaceuticals, and hybrid imaging technologies, enable accurate diagnosis and effective therapeutic modalities. Hospitals, imaging centers, and contract research organizations increasingly invest in radiopharmaceuticals and diagnostic equipment to cater to the growing demand for non-invasive nuclear imaging techniques. Insurance coverage and reimbursement facilities further boost the market's growth.
What challenges does the Nuclear Medicine Industry face during its growth?
- Regulatory hurdles regarding preparation of radiopharmaceuticals is a key challenge affecting the industry growth. The market is driven by the growing geriatric population and the increasing prevalence of chronic diseases such as cancer and cardiovascular disease. Technologically advanced systems, including SPECT and PET radiopharmaceuticals, are used for diagnosis and treatment in clinical areas like neurology, cardiology, and oncology. Insurance coverage and reimbursement facilities are crucial factors influencing market growth. Radioisotopes, such as Technetium 99m, Iodine 123, Xenon 133, Thallium 201, and various beta and alpha emitters, are used In the production of radiopharmaceuticals. Cyclotrons and generators are essential for the production of these isotopes. Neurological disorders, including Alzheimer's disease and Parkinson's disease, are significant diagnostic areas for nuclear medicine.
- Healthcare systems, including hospitals, imaging centers, and contract research organizations, use diagnostic and therapeutic nuclear medicine for prescription drugs and imaging technology. The non-invasive nature of nuclear imaging techniques, such as SPECT and PET scans, provides accurate diagnosis and minimally invasive therapeutic modalities. Cancer treatment, including chemotherapy methods and therapeutic radiopharmaceuticals, is a significant application area for nuclear medicine. Medical diagnostic sector growth is expected due to the clear imaging technique and the ability to target specificity for therapeutic efficacy. MRI, CT scanners, ultrasonography, and nuclear imaging techniques are used in diagnostic centers. Radiolabeling and targeting specificity are essential for the development of new radiopharmaceuticals. The market is dynamic, with ongoing research and development in hybrid imaging technologies, such as PET and MRI, and the use of magnetic resonance imaging and computed tomography.
Exclusive Customer Landscape
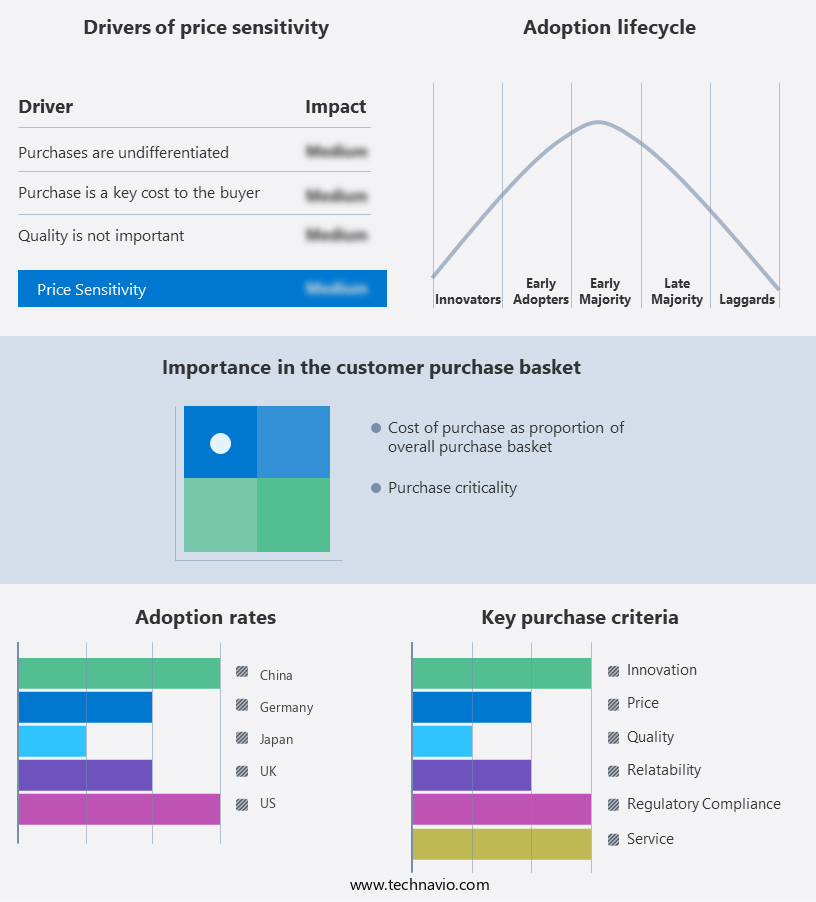
The market forecasting report includes the adoption lifecycle of the market, covering from the innovator's stage to the laggard's stage. It focuses on adoption rates in different regions based on penetration. Furthermore, the market report also includes key purchase criteria and drivers of price sensitivity to help companies evaluate and develop their market growth analysis strategies.
Customer Landscape
Key Companies & Market Insights
Companies are implementing various strategies, such as strategic alliances, market forecast, partnerships, mergers and acquisitions, geographical expansion, and product/service launches, to enhance their presence In the industry.
Koninklijke Philips NV- The company offers nuclear medicine, such as the Spectral Computed Tomography 7500 system.
The industry research and growth report includes detailed analyses of the competitive landscape of the market and information about key companies, including:
- Bayer AG
- Bracco Spa
- Cardinal Health Inc.
- Eckert and Ziegler AG
- ECZACIBASI MONROL NUCLEAR PRODUCTS CO.
- GE Healthcare Technologies Inc.
- IBA Radiopharma Solutions
- Jubilant Pharmova Ltd.
- Koninklijke Philips NV
- Lantheus
- Mallinckrodt Plc
- Medi-Radiopharma
- Mirion Technologies Inc.
- Necsa
- Novartis AG
- Siemens Healthineers AG
- Sirtex Medical Pty Ltd.
- Telix Pharmaceuticals Ltd.
- Tema Sinergie SpA
- TTG Imaging Solutions LLC
Qualitative and quantitative analysis of companies has been conducted to help clients understand the wider business environment as well as the strengths and weaknesses of key industry players. Data is qualitatively analyzed to categorize companies as pure play, category-focused, industry-focused, and diversified; it is quantitatively analyzed to categorize companies as dominant, leading, strong, tentative, and weak.
Research Analyst Overview
Nuclear medicine is a specialized field of healthcare that utilizes radiopharmaceuticals, radioisotopes, and imaging technologies to diagnose and treat various medical conditions. This sector has gained significant attention due to its ability to provide clear and accurate diagnostic information, particularly in the context of complex diseases such as cancer and neurological disorders. The market is driven by several key factors. One significant factor is the increasing prevalence of chronic diseases, particularly cancer and cardiovascular disease, which require diagnostic and therapeutic interventions. According to the World Health Organization, non-communicable diseases accounted for 71% of all global deaths in 2016, with cancer and cardiovascular diseases being the leading causes.
Another factor driving the growth of the market is the availability of technologically advanced systems and the increasing use of hybrid imaging technologies. These systems enable more precise diagnosis and treatment, leading to better patient outcomes and increased demand for nuclear medicine services. Moreover, the aging population is also contributing to the growth of the market. Geriatric patients often require more frequent diagnostic tests due to the higher prevalence of chronic diseases in this population. Additionally, the non-invasive nature of nuclear medicine procedures makes them an attractive option for elderly patients who may have limited mobility or other health concerns.
Furthermore, insurance coverage and reimbursement facilities also play a crucial role in the growth of the market. As the use of nuclear medicine procedures becomes more widespread, insurance companies and healthcare systems are recognizing their value and increasing coverage and reimbursement for these services. The radiopharmaceutical production sector is a critical component of the nuclear medicine industry. Radioisotopes such as technetium 99m, iodine 123, xenon 133, and thallium 201 are commonly used in diagnostic procedures, while beta emitters, alpha emitters, and brachytherapy isotopes are used In therapeutic applications. Cyclotrons and generators are essential tools used in the production of these radioisotopes.
|
Market Scope |
|
|
Report Coverage |
Details |
|
Page number |
201 |
|
Base year |
2024 |
|
Historic period |
2019-2023 |
|
Forecast period |
2025-2029 |
|
Growth momentum & CAGR |
Accelerate at a CAGR of 19.2% |
|
Market growth 2025-2029 |
USD 13.01 billion |
|
Market structure |
Fragmented |
|
YoY growth 2024-2025(%) |
16.1 |
|
Key countries |
US, China, Japan, Canada, India, UK, Germany, South Korea, France, and Australia |
|
Competitive landscape |
Leading Companies, Market Positioning of Companies, Competitive Strategies, and Industry Risks |
What are the Key Data Covered in this Nuclear Medicine Market Research and Growth Report?
- CAGR of the Nuclear Medicine industry during the forecast period
- Detailed information on factors that will drive the market growth and forecasting between 2025 and 2029
- Precise estimation of the size of the market and its contribution of the industry in focus to the parent market
- Accurate predictions about upcoming growth and trends and changes in consumer behaviour
- Growth of the market across North America, Asia, Europe, and Rest of World (ROW)
- Thorough analysis of the market's competitive landscape and detailed information about companies
- Comprehensive analysis of factors that will challenge the nuclear medicine market growth of industry companies
We can help! Our analysts can customize this nuclear medicine market research report to meet your requirements.
 RIA -
RIA - 
