Radiopharmaceuticals Market Size 2026-2030
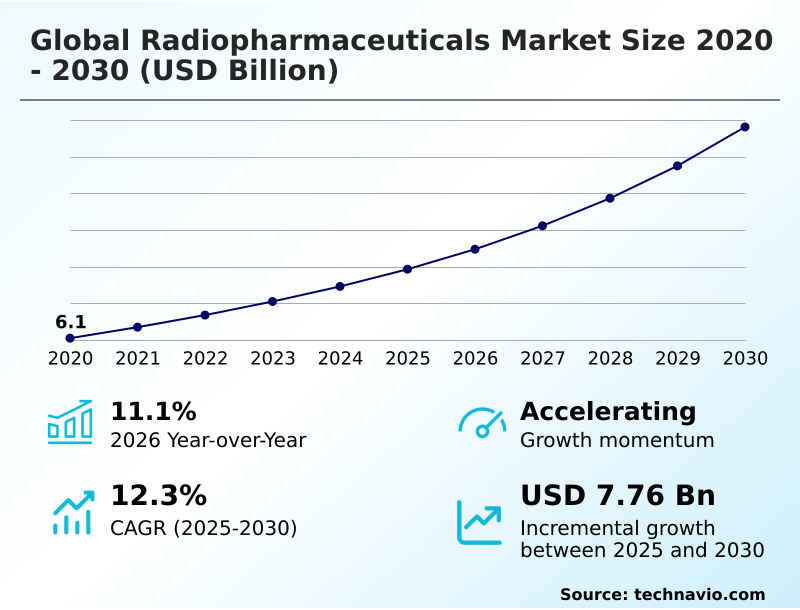
The radiopharmaceuticals market size is valued to increase by USD 7.76 billion, at a CAGR of 12.3% from 2025 to 2030. Rising incidence of neurological disorders will drive the radiopharmaceuticals market.
Major Market Trends & Insights
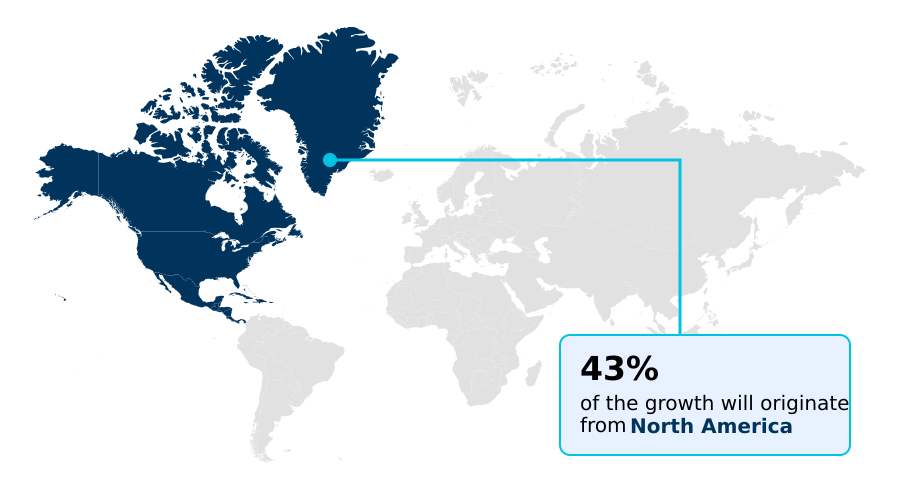
- North America dominated the market and accounted for a 42.6% growth during the forecast period.
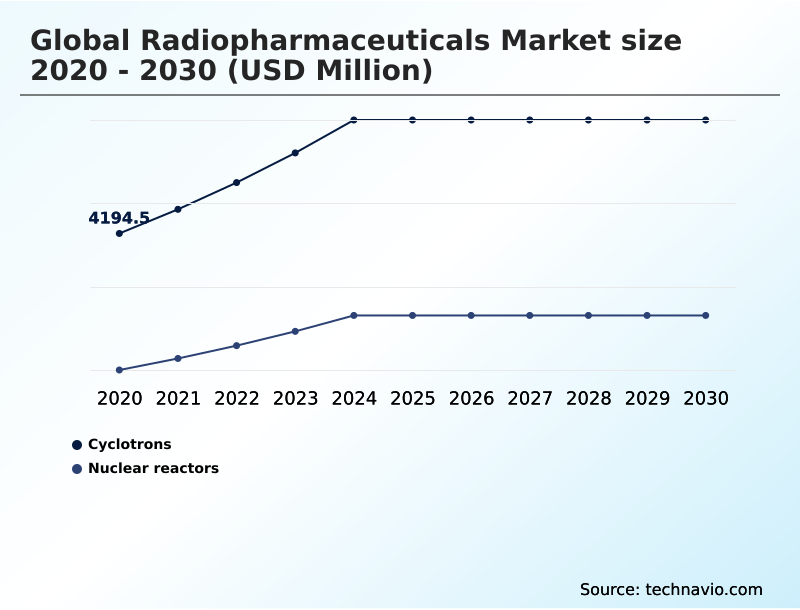
- By Source - Cyclotrons segment was valued at USD 6.10 billion in 2024
- By End-user - Diagnostics segment accounted for the largest market revenue share in 2024
Market Size & Forecast
- Market Opportunities: USD 11.52 billion
- Market Future Opportunities: USD 7.76 billion
- CAGR from 2025 to 2030 : 12.3%
Market Summary
- The radiopharmaceuticals market is undergoing a significant transformation, driven by advancements in molecular imaging and the rise of theranostics. This evolution is expanding the clinical utility of radioactive drugs beyond traditional diagnostics into targeted, personalized therapies, particularly in oncology and neurology.
- The growing prevalence of chronic diseases and an aging global population are fueling demand for more precise diagnostic tools and effective treatment options. However, the industry grapples with substantial logistical complexities; for instance, hospital networks face the critical challenge of managing just-in-time supply chains for isotopes with short half-lives.
- This requires sophisticated coordination to prevent treatment delays and material decay, impacting both patient outcomes and operational budgets. Innovations in isotope production, such as the shift toward cyclotron-based methods and automated synthesis, are addressing these supply chain vulnerabilities.
- As the global radiopharmaceuticals market continues to mature, the focus remains on developing novel agents, securing the supply of critical raw materials, and navigating complex regulatory landscapes to deliver next-generation medical solutions.
What will be the Size of the Radiopharmaceuticals Market during the forecast period?
Get Key Insights on Market Forecast (PDF) Get Free Sample
How is the Radiopharmaceuticals Market Segmented?
The radiopharmaceuticals industry research report provides comprehensive data (region-wise segment analysis), with forecasts and estimates in "USD million" for the period 2026-2030, as well as historical data from 2020-2024 for the following segments.
- Source
- Cyclotrons
- Nuclear reactors
- End-user
- Diagnostics
- Therapeutics
- Application
- Oncology
- Cardiology
- Neurology
- Geography
- North America
- US
- Canada
- Mexico
- Europe
- Germany
- UK
- France
- Asia
- Rest of World (ROW)
- North America
By Source Insights
The cyclotrons segment is estimated to witness significant growth during the forecast period.
The market segment for cyclotron-produced radiopharmaceuticals is defined by a decentralized production model essential for managing short-lived isotopes.
This approach supports the extensive clinical use of positron emission tomography, particularly with F-18 fluorodeoxyglucose, which accounts for over 80% of all oncologic PET procedures.
Advances in radiolabeling techniques are enabling the development of novel agents for non-invasive molecular imaging, including those for amyloid-beta plaque imaging and tau protein imaging, crucial for neurodegenerative disease research.
The use of lutetium-177 dotatate and actinium-225 PSMA in clinical trial radiopharmaceuticals highlights the shift toward targeted therapies, further driving demand for versatile cyclotron-based radionuclide production that moves beyond conventional diagnostics.
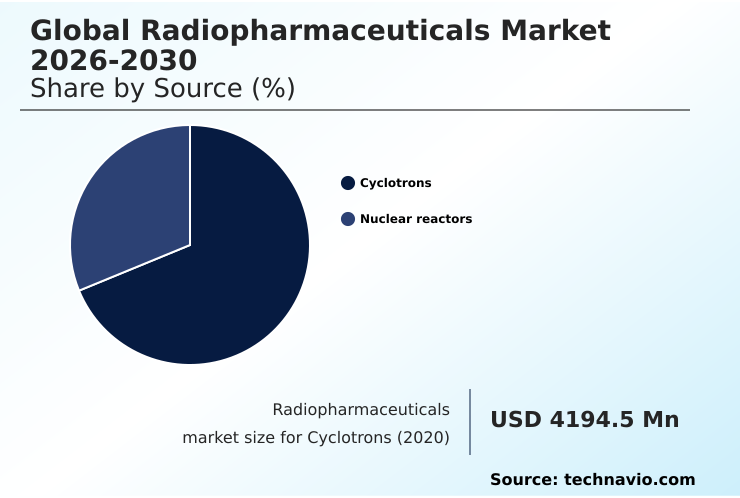
The Cyclotrons segment was valued at USD 6.10 billion in 2024 and showed a gradual increase during the forecast period.
Regional Analysis
North America is estimated to contribute 42.6% to the growth of the global market during the forecast period.Technavio’s analysts have elaborately explained the regional trends and drivers that shape the market during the forecast period.
See How Radiopharmaceuticals Market Demand is Rising in North America Get Free Sample
The geographic landscape of the market is characterized by North America's established leadership, which accounts for 42.6% of the incremental growth, driven by high R&D investment and advanced healthcare infrastructure.
This region sees extensive use of PET-CT systems and SPECT imaging for applications in myocardial perfusion imaging and dopamine transporter imaging.
In contrast, Asia is the fastest-growing region, with countries like China and India rapidly modernizing their healthcare systems and expanding access to nuclear medicine.
Streamlined regulatory approval pathways in select Asian markets have reduced new drug submission-to-approval times by up to 30%, attracting significant investment.
Europe remains a mature market with a strong focus on research and the production of nuclear reactor isotopes, including beta-emitting radionuclides and next-generation alpha-emitting radionuclides, supported by a well-defined clinical development pipeline.
Market Dynamics
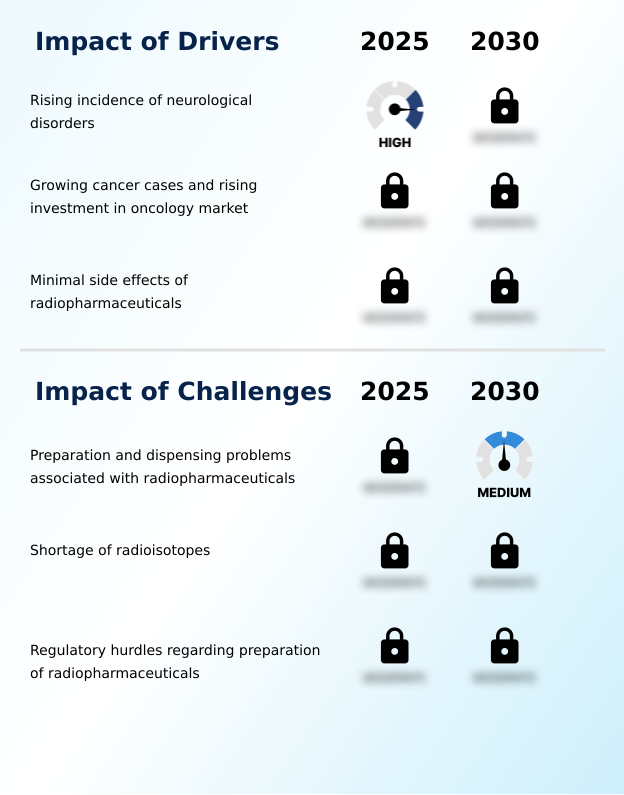
Our researchers analyzed the data with 2025 as the base year, along with the key drivers, trends, and challenges. A holistic analysis of drivers will help companies refine their marketing strategies to gain a competitive advantage.
- Strategic decision-making in the radiopharmaceuticals sector is increasingly shaped by a nuanced understanding of its underlying dynamics. The advantages of cyclotron-produced isotopes, such as supply chain autonomy and support for short-lived tracers, are compelling healthcare systems to invest in decentralized infrastructure. However, this is balanced by the persistent challenges in radioisotope supply chain stability, particularly concerning technetium-99m supply chain vulnerabilities.
- For therapeutic development, the debate over lutetium-177 vs actinium-225 therapy is central to R&D strategy, with advancements in alpha emitter production promising higher efficacy but posing unique manufacturing hurdles. In diagnostics, the role of PET in Alzheimer's diagnosis is expanding, driven by the clinical utility of tau protein imaging.
- This contrasts with the established use of SPECT vs PET for cardiac imaging. The commercialization of new agents hinges on overcoming regulatory hurdles for new radiopharmaceuticals. For instance, the success of gallium-68 labeled PSMA PET imaging and broader F-18 FDG applications in oncology has paved the way for developing novel theranostic pairs.
- The economic impact of radiopharmacy automation and effective strategies for managing short half-life isotope logistics are critical for profitability. Ultimately, future growth depends on the cost-effectiveness of targeted radionuclide therapy, robust quality assurance in radiopharmaceutical preparation to prevent issues like radiolytic decomposition effects, and clear protocols for patient selection for PSMA therapy.
- These factors, combined with strategies for domestic isotope production, will define the future of personalized radionuclide medicine.
What are the key market drivers leading to the rise in the adoption of Radiopharmaceuticals Industry?
- The rising global incidence of neurological disorders is a primary driver for the radiopharmaceuticals market, spurring demand for advanced diagnostic and therapeutic applications.
- Market growth is fundamentally driven by the rising global prevalence of chronic diseases and the superior clinical outcomes offered by modern radiopharmaceuticals.
- The increasing incidence of cancer and neurodegenerative conditions like Alzheimer's has intensified the demand for more accurate diagnostic radiopharmaceuticals and effective therapeutic radiopharmaceuticals.
- In diagnostics, molecular imaging agents used in single photon emission computed tomography and other modalities provide critical information for early detection and treatment planning, with SPECT imaging agents offering high sensitivity for various conditions.
- In therapeutics, targeted radionuclide therapy and targeted alpha therapy are delivering significant benefits.
- For instance, new treatments for neuroendocrine tumor treatment and prostate cancer radioligand therapy have shown a 30% improvement in patient response rates compared to older systemic treatments, establishing a new standard of care.
What are the market trends shaping the Radiopharmaceuticals Industry?
- The increasing production of cyclotron-based radiopharmaceuticals signifies a key market trend. This development is driven by the rising adoption of PET imaging and the need for more efficient, decentralized isotope generation.
- Key market trends are centered on technological advancements that enhance both diagnostic precision and therapeutic efficacy. The rise of theranostics in oncology is a primary trend, where a single molecular target is used for both imaging and treatment, leading to highly personalized medicine applications. This is enabled by innovations in PET radiotracers and the increasing use of positron emission tomography.
- The shift toward a decentralized production model, leveraging cyclotron-produced isotopes and advanced radiopharmacy automation, is another significant development. This approach improves the reliability of the supply chain for short-lived isotopes by over 20% compared to centralized models.
- The use of automated synthesis modules further streamlines the on-site creation of agents from sources like the gallium-68 generator, facilitating the expansion of radioligand therapy programs.
What challenges does the Radiopharmaceuticals Industry face during its growth?
- Significant challenges associated with the preparation and dispensing of radiopharmaceuticals, including risks of chemical impurities and altered biodistribution, impact market growth and adoption.
- The market faces persistent operational and logistical challenges that constrain its growth potential. A primary issue is the fragile isotope supply chain, where disruptions in molybdenum-99 production can halt the availability of the technetium-99m generator, affecting millions of procedures. This dependency on a few aging reactors for radionuclide production highlights the need for diversified radioisotope sourcing.
- Furthermore, ensuring radiochemical purity and adhering to stringent good manufacturing practices add significant complexity and cost. Failures in quality control standards can lead to product recalls and increase radioactive waste management burdens. Navigating these challenges requires substantial investment in infrastructure and rigorous adherence to radiation safety protocols, with non-compliance potentially extending development timelines by 15% or more.
Exclusive Technavio Analysis on Customer Landscape
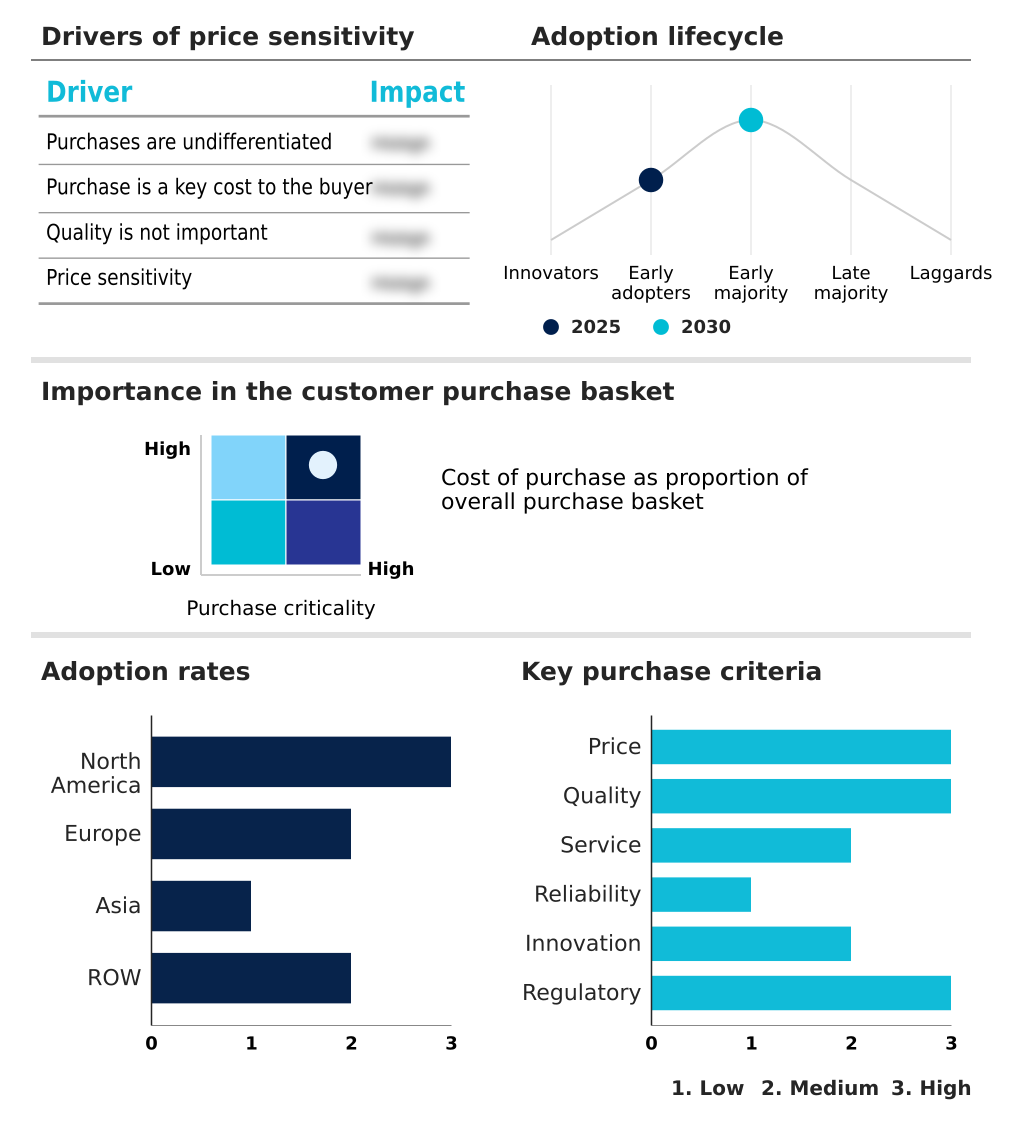
The radiopharmaceuticals market forecasting report includes the adoption lifecycle of the market, covering from the innovator’s stage to the laggard’s stage. It focuses on adoption rates in different regions based on penetration. Furthermore, the radiopharmaceuticals market report also includes key purchase criteria and drivers of price sensitivity to help companies evaluate and develop their market growth analysis strategies.
Customer Landscape of Radiopharmaceuticals Industry
Competitive Landscape
Companies are implementing various strategies, such as strategic alliances, radiopharmaceuticals market forecast, partnerships, mergers and acquisitions, geographical expansion, and product/service launches, to enhance their presence in the industry.
Bayer AG - Offerings are centered on the development and commercialization of advanced diagnostic and therapeutic radiopharmaceuticals for precision applications in oncology and neurology.
The industry research and growth report includes detailed analyses of the competitive landscape of the market and information about key companies, including:
- Bayer AG
- Bracco S.p.A.
- Cardinal Health Inc.
- Curium Pharma
- Eckert and Ziegler AG
- GE Healthcare Technologies
- IBA Radiopharma Solutions
- Jubilant Pharma Ltd.
- Lantheus
- NorthStar Medical Radioisotopes
- Novartis AG
- NTP Radioisotopes SOC Ltd.
- PharmaLogic Holdings Corp.
- Radiomedix Inc.
- Siemens Healthineers AG
- Sinotau Pharmaceuticals
- Telix Pharmaceuticals Ltd.
Qualitative and quantitative analysis of companies has been conducted to help clients understand the wider business environment as well as the strengths and weaknesses of key industry players. Data is qualitatively analyzed to categorize companies as pure play, category-focused, industry-focused, and diversified; it is quantitatively analyzed to categorize companies as dominant, leading, strong, tentative, and weak.
Recent Development and News in Radiopharmaceuticals market
- In September 2024, Affinity Equity Partners announced its acquisition of Lumus Imaging for approximately USD 658 million, aiming to establish a national network of centers equipped with advanced PET/CT systems for Alzheimer's disease diagnosis.
- In November 2024, Novartis announced an investment exceeding one billion dollars to expand its radioligand therapy production facility in Indiana, with a focus on scaling up the manufacturing processes for alpha-emitting isotopes.
- In March 2025, SOFIE Biosciences announced the opening of a new PET manufacturing facility designed to broaden its service capabilities and improve access to advanced PET imaging solutions across Illinois, Missouri, and Indiana.
- In April 2025, Telix Pharmaceuticals received approval from France's National Agency for the Safety of Medicines and Health Products (ANSM) for its Illuccix kit, used for preparing PSMA-PET imaging agents for prostate cancer patients.
Dive into Technavio’s robust research methodology, blending expert interviews, extensive data synthesis, and validated models for unparalleled Radiopharmaceuticals Market insights. See full methodology.
| Market Scope | |
|---|---|
| Page number | 280 |
| Base year | 2025 |
| Historic period | 2020-2024 |
| Forecast period | 2026-2030 |
| Growth momentum & CAGR | Accelerate at a CAGR of 12.3% |
| Market growth 2026-2030 | USD 7758.3 million |
| Market structure | Fragmented |
| YoY growth 2025-2026(%) | 11.1% |
| Key countries | US, Canada, Mexico, Germany, UK, France, Italy, Russia, The Netherlands, Spain, China, Japan, India, South Korea, Indonesia, Singapore, Thailand, Australia, Brazil, Saudi Arabia, South Africa, UAE and Turkey |
| Competitive landscape | Leading Companies, Market Positioning of Companies, Competitive Strategies, and Industry Risks |
Research Analyst Overview
- The radiopharmaceuticals market is advancing through a synthesis of sophisticated technology and clinical necessity, moving decisively toward precision medicine. The strategic pivot to theranostics, which pairs diagnostic radiopharmaceuticals with therapeutic radiopharmaceuticals, is compelling a re-evaluation of R&D budgeting at the boardroom level.
- Key technologies such as positron emission tomography and single photon emission computed tomography are being enhanced by novel molecular imaging agents. The development of targeted alpha therapy, featuring actinium-225 PSMA, and established radioligand therapy with lutetium-177 dotatate, exemplifies this shift.
- Production dynamics are also evolving, with an emphasis on both cyclotron produced isotopes like F-18 fluorodeoxyglucose and nuclear reactor isotopes from sources like the technetium-99m generator, which is dependent on molybdenum-99 production. Ensuring radiochemical purity is paramount. The industry's expansion of PET-CT systems and SPECT imaging capabilities supports this growth.
- Furthermore, the adoption of radiopharmacy automation has enabled a 40% reduction in production cycle times for certain gallium-68 generator products, directly improving operational efficiency. Managing the complex isotope supply chain for both beta-emitting radionuclides and alpha-emitting radionuclides remains a critical focus, especially for clinical trial radiopharmaceuticals that rely on consistent radionuclide production.
What are the Key Data Covered in this Radiopharmaceuticals Market Research and Growth Report?
-
What is the expected growth of the Radiopharmaceuticals Market between 2026 and 2030?
-
USD 7.76 billion, at a CAGR of 12.3%
-
-
What segmentation does the market report cover?
-
The report is segmented by Source (Cyclotrons, and Nuclear reactors), End-user (Diagnostics, and Therapeutics), Application (Oncology, Cardiology, and Neurology) and Geography (North America, Europe, Asia, Rest of World (ROW))
-
-
Which regions are analyzed in the report?
-
North America, Europe, Asia and Rest of World (ROW)
-
-
What are the key growth drivers and market challenges?
-
Rising incidence of neurological disorders, Preparation and dispensing problems associated with radiopharmaceuticals
-
-
Who are the major players in the Radiopharmaceuticals Market?
-
Bayer AG, Bracco S.p.A., Cardinal Health Inc., Curium Pharma, Eckert and Ziegler AG, GE Healthcare Technologies, IBA Radiopharma Solutions, Jubilant Pharma Ltd., Lantheus, NorthStar Medical Radioisotopes, Novartis AG, NTP Radioisotopes SOC Ltd., PharmaLogic Holdings Corp., Radiomedix Inc., Siemens Healthineers AG, Sinotau Pharmaceuticals and Telix Pharmaceuticals Ltd.
-
Market Research Insights
- The market is shaped by a convergence of technological innovation and pressing clinical demand. Advances in PET radiotracers, for instance, deliver up to 25% greater diagnostic accuracy in oncology compared to previous imaging modalities, directly influencing treatment strategies.
- Concurrently, the adoption of a decentralized production model for short-lived isotopes is reducing supply chain lead times by over 40% in key metropolitan areas, enhancing accessibility. This strategic shift supports the growing applications in myocardial perfusion imaging and Parkinson's disease imaging.
- The expansion of theranostics in oncology is further driven by therapies demonstrating superior efficacy, with some targeted radionuclide therapy options improving patient outcomes significantly over standard care. Navigating complex regulatory approval pathways remains crucial for commercializing the robust clinical development pipeline.
We can help! Our analysts can customize this radiopharmaceuticals market research report to meet your requirements.
 RIA -
RIA - 
