Nut Meals Market Analysis, Size, and Forecast 2026-2030: North America (US, Canada, and Mexico), Europe (Germany, UK, and France), APAC (China, India, and Japan), Middle East and Africa (UAE, Saudi Arabia, and South Africa), South America (Brazil and Argentina), and Rest of World (ROW)

Nut Meals Market Analysis, Size, and Forecast 2026-2030:
North America (US, Canada, and Mexico), Europe (Germany, UK, and France), APAC (China, India, and Japan), Middle East and Africa (UAE, Saudi Arabia, and South Africa), South America (Brazil and Argentina), and Rest of World (ROW)

Published: Jan 2026 291 Pages SKU: IRTNTR74017

Market Overview at a Glance

$2.11 B
Market Opportunity
4.6%
CAGR 2025 - 2030
44.6%
North America Growth
$7.61 B
Inorganic nut meals segment 2024

Nut Meals Market Size 2026-2030

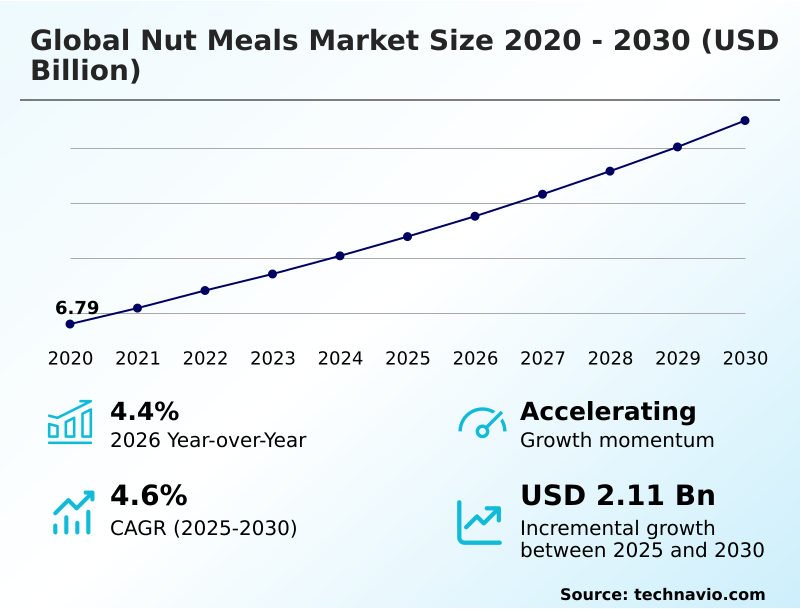
The nut meals market size is valued to increase by USD 2.11 billion, at a CAGR of 4.6% from 2025 to 2030. Growing demand for plant-based protein will drive the nut meals market.

Major Market Trends & Insights

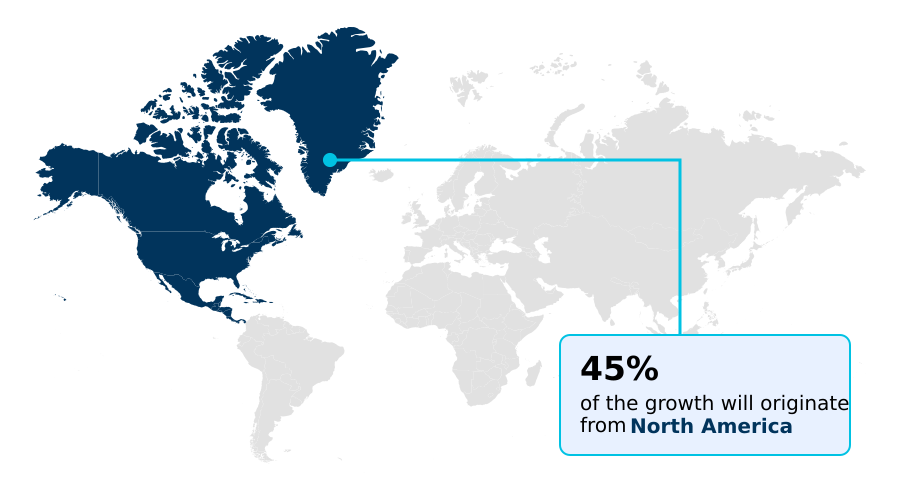
  • North America dominated the market and accounted for a 44.6% growth during the forecast period.
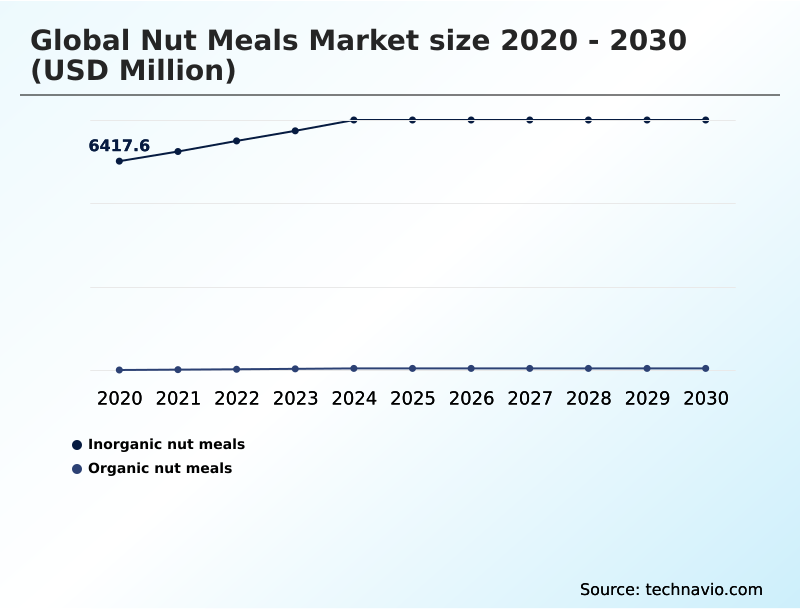
  • By Product - Inorganic nut meals segment was valued at USD 7.61 billion in 2024
  • By Type - Powder segment accounted for the largest market revenue share in 2024

Market Size & Forecast

  • Market Opportunities: USD 3.70 billion
  • Market Future Opportunities: USD 2.11 billion
  • CAGR from 2025 to 2030 : 4.6%

Market Summary

  • The nut meals market is defined by a significant shift in consumer dietary habits toward healthier, functional foods. Driven by the rising popularity of plant-based nutrition and gluten-free lifestyles, these ingredients are transitioning from niche health food items to mainstream pantry staples. Applications span from bakery and confectionery, where they provide structure and flavor, to dairy alternatives and sports nutrition.
  • A key business scenario involves a mid-sized bakery chain reformulating its entire pastry line to be gluten-free. This requires sourcing consistent, high-quality almond and hazelnut meals, adjusting recipes to account for different binding properties, and managing higher ingredient costs.
  • The move is a strategic response to consumer demand for clean-label products, aiming to capture a growing market segment despite the operational complexities of overhauling a legacy supply chain and production process.
  • This strategic pivot highlights the industry's evolution, where nutritional value and ingredient transparency are becoming primary drivers of competitive advantage, forcing businesses to innovate beyond traditional flour-based products and embrace the versatility of nut-derived ingredients.

What will be the Size of the Nut Meals Market during the forecast period?

Get Key Insights on Market Forecast (PDF) Request Free Sample

How is the Nut Meals Market Segmented?

The nut meals industry research report provides comprehensive data (region-wise segment analysis), with forecasts and estimates in "USD million" for the period 2026-2030, as well as historical data from 2020-2024 for the following segments.

  • Product
    • Inorganic nut meals
    • Organic nut meals
  • Type
    • Powder
    • Flakes
    • Granules
  • Application
    • Dairy alternatives
    • Bakery products
    • Health supplements
    • Others
  • Geography
    • North America
      • US
      • Canada
      • Mexico
    • Europe
      • Germany
      • UK
      • France
    • APAC
      • China
      • India
      • Japan
    • Middle East and Africa
      • UAE
      • Saudi Arabia
      • South Africa
    • South America
      • Brazil
      • Argentina
    • Rest of World (ROW)

By Product Insights

The inorganic nut meals segment is estimated to witness significant growth during the forecast period.

Conventional nut meals dominate the market, prized for cost-effectiveness and wide availability in various culinary applications. These ingredients are fundamental for nutritional fortification, delivering plant-based protein and superior binding properties.

Driven by consumer health consciousness, the industry is adopting advanced processing technologies to create value-added ingredients from what was once waste, advancing a circular economy approach.

These upcycled ingredients appeal to buyers seeking clean-label ingredients without the premium of organic certification.

Ensuring product quality consistency while adhering to food safety regulations remains a core operational focus, with innovations in this area reducing non-compliant batches by over 12% for some producers.

Request Free Sample

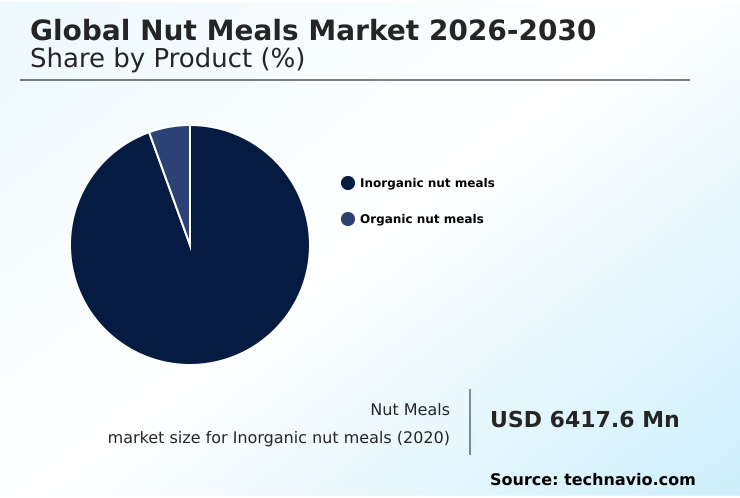
The Inorganic nut meals segment was valued at USD 7.61 billion in 2024 and showed a gradual increase during the forecast period.

Request Free Sample

Regional Analysis

North America is estimated to contribute 44.6% to the growth of the global market during the forecast period.Technavio’s analysts have elaborately explained the regional trends and drivers that shape the market during the forecast period.

See How Nut Meals Market Demand is Rising in North America Request Free Sample

North America and Europe are pivotal regions, where consumer health consciousness drives demand for almond flour and hazelnut meal.

In Europe, which shows a market growth rate approximately 11% higher than South America, the preference for organic nut meals with non-GMO verification is pronounced.

Processors focus on sourcing high-quality oleaginous seeds to produce blanched almond meal and natural almond meal, ensuring superior sensory quality. The use of defatted nut flour is expanding in industrial applications.

Product quality consistency is paramount, with manufacturers leveraging the maillard reaction for optimal browning in baked goods. Market access platforms are improving distribution, especially for specialty products.

Market Dynamics

Our researchers analyzed the data with 2025 as the base year, along with the key drivers, trends, and challenges. A holistic analysis of drivers will help companies refine their marketing strategies to gain a competitive advantage.

  • Strategic decision-making in the nut meals market is increasingly complex, shaped by intersecting consumer demands and supply chain realities. The impact of raw material price volatility on food manufacturers necessitates robust hedging strategies and flexible sourcing.
  • A key consideration is the conventional versus organic nut meal performance in bakery, where organic options can command a price premium but may introduce supply inconsistencies. Formulating functional foods with diverse nut meals is a primary innovation pathway, with a focus on optimizing texture and mouthfeel with nut granules.
  • The role of nut meals in plant-based dairy alternatives is expanding, while nut meal applications in high-protein sports nutrition are becoming more sophisticated. For home consumers, the question of the best nut meals for gluten-free baking or using almond flour in ketogenic recipes drives purchasing.
  • Behind the scenes, managing aflatoxin contamination in peanut meal supply chains and navigating allergen labeling for nut-based products are critical compliance challenges. Innovations in nut meal processing and milling technology, alongside shelf-life extension techniques for high-fat nut flours, are addressing the core challenges of nut meal shelf life.
  • The growing interest in sustainability in nut meal production and market opportunities for upcycled nut byproducts signal a shift toward a circular economy. A cost-benefit analysis of using premium nut meals reveals that while ingredient costs may be 30% higher, the ability to meet consumer demand drivers for clean-label nut ingredients can yield a greater return on market positioning.

What are the key market drivers leading to the rise in the adoption of Nut Meals Industry?

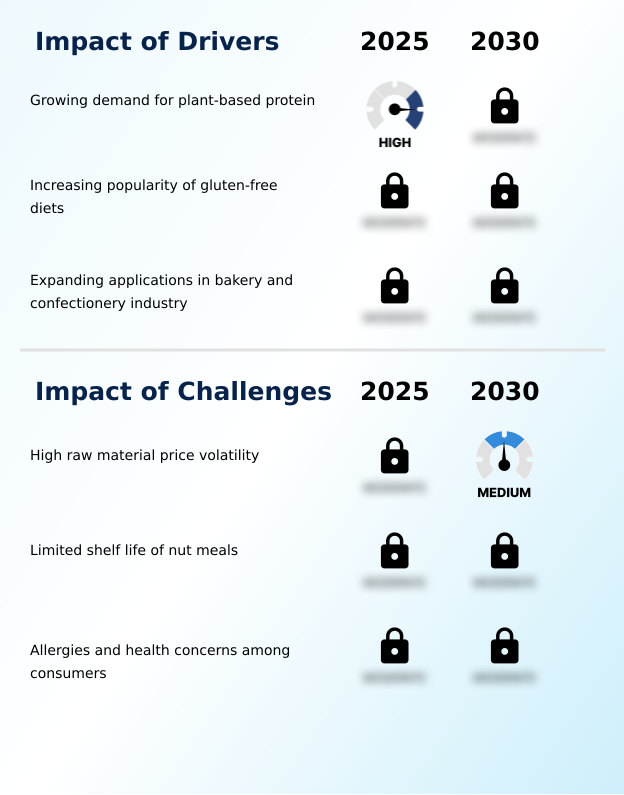
  • The increasing demand for plant-based protein sources is a key driver propelling growth in the nut meals market.

  • Evolving consumer purchasing behavior, driven by specific dietary regimens like the ketogenic diet and paleo diet, is fueling demand. Consumers are increasingly seeking products that fit low-carbohydrate diets, address food intolerance, and feature a high nutrient density.
  • This clean-label movement has propelled grain-free flour into the mainstream. As a result, ingredient diversification is critical for manufacturers developing sports nutrition products with an optimal macronutrient profile.
  • The demand for nutraceutical applications is also rising, with products leveraging nut meals seeing a 10-15% higher adoption rate among health-focused demographics compared to traditional supplements, validating this market driver.

What are the market trends shaping the Nut Meals Industry?

  • Innovation in nut-based product formulations represents a significant market trend. This is fueled by evolving consumer demand for healthier, plant-based, and functional food options.

  • The premiumization trend is reshaping product formulation, with innovation centered on finely ground nut variants for allergen-friendly alternatives. This shift supports the development of new dairy alternatives and functional bars. Companies are exploring artisanal formulations and optimizing flavor profile optimization to cater to sophisticated palates.
  • Sustainable packaging and eco-friendly sourcing are becoming standard, with some firms reporting a 20% reduction in packaging waste. This focus on plant-based nutrition and functional ingredients is leading to advancements in gluten-free baking, where the use of novel nut meals has improved product texture scores by up to 15% in consumer testing panels, driving the market forward.

What challenges does the Nut Meals Industry face during its growth?

  • High raw material price volatility presents a significant challenge to the nut meals market, affecting supply chain stability and profitability.

  • Navigating raw material price volatility remains a primary operational challenge, compelling companies to enhance supply chain transparency. Issues such as aflatoxin contamination and the presence of allergenic proteins necessitate rigorous ingredient traceability and advanced food processing technology. Maintaining oxidative stability to extend shelf life is crucial, as is achieving consistent particle size distribution, whether for coarse grits or fine flours.
  • To build supply chain resilience, firms are adopting new market access platforms and promoting sustainable farming practices. These initiatives have helped some processors reduce supply disruptions by over 25%, mitigating the impact of market volatility.

Exclusive Technavio Analysis on Customer Landscape

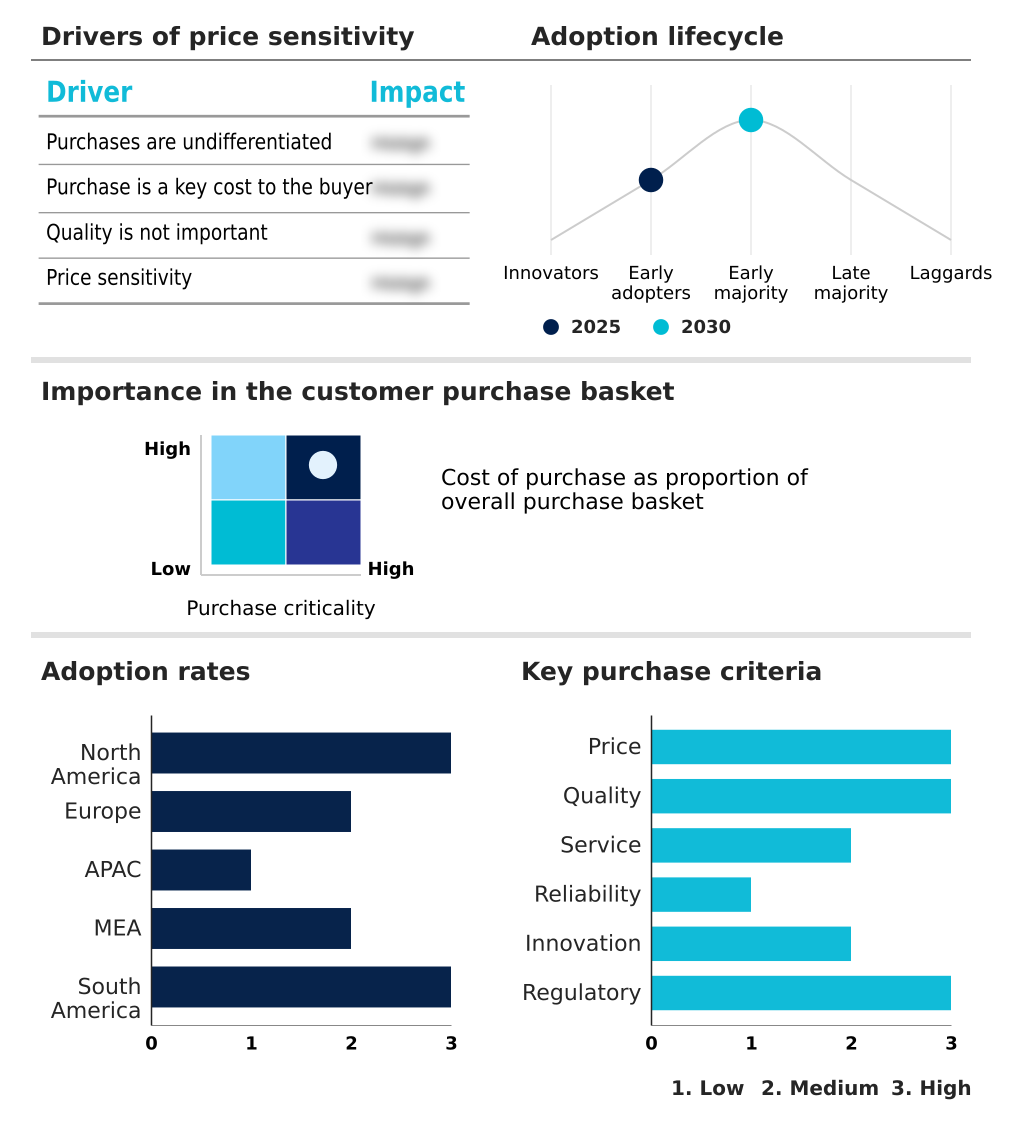
The nut meals market forecasting report includes the adoption lifecycle of the market, covering from the innovator’s stage to the laggard’s stage. It focuses on adoption rates in different regions based on penetration. Furthermore, the nut meals market report also includes key purchase criteria and drivers of price sensitivity to help companies evaluate and develop their market growth analysis strategies.

Customer Landscape of Nut Meals Industry

Competitive Landscape

Companies are implementing various strategies, such as strategic alliances, nut meals market forecast, partnerships, mergers and acquisitions, geographical expansion, and product/service launches, to enhance their presence in the industry.

Aashirwad Corporation - Specializing in nut meal solutions for the food industry, offerings support the shift toward plant-based, gluten-free, and clean-label product formulations.

The industry research and growth report includes detailed analyses of the competitive landscape of the market and information about key companies, including:

  • Aashirwad Corporation
  • Alimento Agro Foods Pvt ltd
  • Blue Diamond Growers
  • Bobs Red Mill Natural Foods
  • Detriot Gourmet Nut Co.
  • Golden Peanut Company LLC
  • HBS Foods Ltd
  • Mariani Nut Co.
  • Oh Nuts
  • Olam Group Ltd.
  • Planters
  • Royal Nut Co.
  • Sun Organic Farm
  • SunOpta Inc.
  • Superior Nut Co. Inc.
  • Tierra Farm

Qualitative and quantitative analysis of companies has been conducted to help clients understand the wider business environment as well as the strengths and weaknesses of key industry players. Data is qualitatively analyzed to categorize companies as pure play, category-focused, industry-focused, and diversified; it is quantitatively analyzed to categorize companies as dominant, leading, strong, tentative, and weak.

Recent Development and News in Nut meals market

  • In May 2025, Brazilian startup Cuica partnered with Tetra Pak to pilot-test and package its Amazon chestnut nut milk at Monte Mor, Sao Paulo, leveraging carton packaging for long-life preservation without preservatives.
  • In April 2025, Olam Group announced a strategic plan involving a $500 million investment in its food ingredients unit to strengthen its balance sheet and explore listing options.
  • In February 2025, PSGs family trust acquired a controlling 54% stake in South Africas ButtaNutt known for nut butters, plant-based milks, and dairy alternatives following conditional approval from the Competition Commission.
  • In August 2024, Goya Foods introduced a new product line described as stand up flours, which featured a variety of single-ingredient flours, including organic almond flour.

Dive into Technavio’s robust research methodology, blending expert interviews, extensive data synthesis, and validated models for unparalleled Nut Meals Market insights. See full methodology.

Market Scope
Page number 291
Base year 2025
Historic period 2020-2024
Forecast period 2026-2030
Growth momentum & CAGR Accelerate at a CAGR of 4.6%
Market growth 2026-2030 USD 2110.4 million
Market structure Fragmented
YoY growth 2025-2026(%) 4.4%
Key countries US, Canada, Mexico, Germany, UK, France, Italy, Spain, The Netherlands, China, India, Japan, South Korea, Australia, Indonesia, UAE, Saudi Arabia, South Africa, Israel, Turkey, Brazil, Argentina and Chile
Competitive landscape Leading Companies, Market Positioning of Companies, Competitive Strategies, and Industry Risks

Request Free Sample

Research Analyst Overview

  • The nut meals market is sustained by its central role in addressing modern dietary demands. Ingredients like almond flour and hazelnut meal are pivotal for gluten-free baking, while the rise of the ketogenic diet and paleo diet has cemented the necessity of low-carbohydrate diets alternatives.
  • The use of defatted nut flour and other finely ground nut variants from oleaginous seeds enables the creation of functional bars and sports nutrition products with specific macronutrient profiles and high nutrient density. In response to the clean-label ingredients trend, manufacturers are producing blanched almond meal and natural almond meal with enhanced textural enhancement.
  • Boardroom decisions are now heavily influenced by supply chain vulnerabilities, including managing allergenic proteins and preventing aflatoxin contamination. Companies that invest in advanced food processing technology to control particle size distribution, from coarse grits to fine powders, and improve oxidative stability for shelf life extension have reported a 15% reduction in product spoilage.
  • This focus on sensory quality, culinary applications, and nutritional fortification, alongside innovations like cold-pressed nut oils and toasted nut flakes, defines the competitive landscape.

What are the Key Data Covered in this Nut Meals Market Research and Growth Report?

  • What is the expected growth of the Nut Meals Market between 2026 and 2030?

    • USD 2.11 billion, at a CAGR of 4.6%

  • What segmentation does the market report cover?

    • The report is segmented by Product (Inorganic nut meals, and Organic nut meals), Type (Powder, Flakes, and Granules), Application (Dairy alternatives, Bakery products, Health supplements, and Others) and Geography (North America, Europe, APAC, Middle East and Africa, South America)

  • Which regions are analyzed in the report?

    • North America, Europe, APAC, Middle East and Africa and South America

  • What are the key growth drivers and market challenges?

    • Growing demand for plant-based protein, High raw material price volatility

  • Who are the major players in the Nut Meals Market?

    • Aashirwad Corporation, Alimento Agro Foods Pvt ltd, Blue Diamond Growers, Bobs Red Mill Natural Foods, Detriot Gourmet Nut Co., Golden Peanut Company LLC, HBS Foods Ltd, Mariani Nut Co., Oh Nuts, Olam Group Ltd., Planters, Royal Nut Co., Sun Organic Farm, SunOpta Inc., Superior Nut Co. Inc. and Tierra Farm

Market Research Insights

  • The market's dynamism is driven by evolving consumer purchasing behavior and a strong preference for plant-based nutrition. Ingredient diversification is now a key strategy, with companies expanding beyond common nuts to explore novel sources. This trend toward value-added ingredients is reinforced by the clean-label movement, where supply chain transparency is paramount.
  • The adoption of advanced processing technologies has led to a 20% improvement in product quality consistency, a critical factor for industrial buyers. Furthermore, a focus on sustainable farming practices has resonated with consumers, leading to a 15% increase in brand loyalty for companies that provide verifiable ingredient traceability.
  • This shift demonstrates that success is increasingly tied to both nutritional innovation and ethical sourcing.

We can help! Our analysts can customize this nut meals market research report to meet your requirements.

Get in touch

1. Executive Summary

1.1 Market overview

Executive Summary - Chart on Market Overview
Executive Summary - Data Table on Market Overview
Executive Summary - Chart on Global Market Characteristics
Executive Summary - Chart on Market by Geography
Executive Summary - Chart on Market Segmentation by Product
Executive Summary - Chart on Market Segmentation by Type
Executive Summary - Chart on Market Segmentation by Application
Executive Summary - Chart on Incremental Growth
Executive Summary - Data Table on Incremental Growth
Executive Summary - Chart on Company Market Positioning

2. Technavio Analysis

2.1 Analysis of price sensitivity, lifecycle, customer purchase basket, adoption rates, and purchase criteria

2.2 Criticality of inputs and Factors of differentiation

Chart on Overview on criticality of inputs and factors of differentiation

2.3 Factors of disruption

Chart on Overview on factors of disruption

2.4 Impact of drivers and challenges

Chart on Impact of drivers and challenges in 2025 and 2030

3. Market Landscape

3.1 Market ecosystem

Chart on Parent Market
Data Table on - Parent Market

3.2 Market characteristics

Chart on Market characteristics analysis

3.3 Value chain analysis

Chart on Value chain analysis

4. Market Sizing

4.1 Market definition

Data Table on Offerings of companies included in the market definition

4.2 Market segment analysis

Market segments

4.3 Market size 2025

4.4 Market outlook: Forecast for 2025-2030

Chart on Global - Market size and forecast 2025-2030 ($ million)
Data Table on Global - Market size and forecast 2025-2030 ($ million)
Chart on Global Market: Year-over-year growth 2025-2030 (%)
Data Table on Global Market: Year-over-year growth 2025-2030 (%)

5. Historic Market Size

5.1 Global Nut Meals Market 2020 - 2024

Historic Market Size - Data Table on Global Nut Meals Market 2020 - 2024 ($ million)

5.2 Product segment analysis 2020 - 2024

Historic Market Size - Product Segment 2020 - 2024 ($ million)

5.3 Type segment analysis 2020 - 2024

Historic Market Size - Type Segment 2020 - 2024 ($ million)

5.4 Application segment analysis 2020 - 2024

Historic Market Size - Application Segment 2020 - 2024 ($ million)

5.5 Geography segment analysis 2020 - 2024

Historic Market Size - Geography Segment 2020 - 2024 ($ million)

5.6 Country segment analysis 2020 - 2024

Historic Market Size - Country Segment 2020 - 2024 ($ million)

6. Qualitative Analysis

6.1 Impact of AI on Global Nut Meals Market

7. Five Forces Analysis

7.1 Five forces summary

Five forces analysis - Comparison between 2025 and 2030

7.2 Bargaining power of buyers

Bargaining power of buyers - Impact of key factors 2025 and 2030

7.3 Bargaining power of suppliers

Bargaining power of suppliers - Impact of key factors in 2025 and 2030

7.4 Threat of new entrants

Threat of new entrants - Impact of key factors in 2025 and 2030

7.5 Threat of substitutes

Threat of substitutes - Impact of key factors in 2025 and 2030

7.6 Threat of rivalry

Threat of rivalry - Impact of key factors in 2025 and 2030

7.7 Market condition

Chart on Market condition - Five forces 2025 and 2030

8. Market Segmentation by Product

8.1 Market segments

Chart on Product - Market share 2025-2030 (%)
Data Table on Product - Market share 2025-2030 (%)

8.2 Comparison by Product

Chart on Comparison by Product
Data Table on Comparison by Product

8.3 Inorganic nut meals - Market size and forecast 2025-2030

Chart on Inorganic nut meals - Market size and forecast 2025-2030 ($ million)
Data Table on Inorganic nut meals - Market size and forecast 2025-2030 ($ million)
Chart on Inorganic nut meals - Year-over-year growth 2025-2030 (%)
Data Table on Inorganic nut meals - Year-over-year growth 2025-2030 (%)

8.4 Organic nut meals - Market size and forecast 2025-2030

Chart on Organic nut meals - Market size and forecast 2025-2030 ($ million)
Data Table on Organic nut meals - Market size and forecast 2025-2030 ($ million)
Chart on Organic nut meals - Year-over-year growth 2025-2030 (%)
Data Table on Organic nut meals - Year-over-year growth 2025-2030 (%)

8.5 Market opportunity by Product

Market opportunity by Product ($ million)
Data Table on Market opportunity by Product ($ million)

9. Market Segmentation by Type

9.1 Market segments

Chart on Type - Market share 2025-2030 (%)
Data Table on Type - Market share 2025-2030 (%)

9.2 Comparison by Type

Chart on Comparison by Type
Data Table on Comparison by Type

9.3 Powder - Market size and forecast 2025-2030

Chart on Powder - Market size and forecast 2025-2030 ($ million)
Data Table on Powder - Market size and forecast 2025-2030 ($ million)
Chart on Powder - Year-over-year growth 2025-2030 (%)
Data Table on Powder - Year-over-year growth 2025-2030 (%)

9.4 Flakes - Market size and forecast 2025-2030

Chart on Flakes - Market size and forecast 2025-2030 ($ million)
Data Table on Flakes - Market size and forecast 2025-2030 ($ million)
Chart on Flakes - Year-over-year growth 2025-2030 (%)
Data Table on Flakes - Year-over-year growth 2025-2030 (%)

9.5 Granules - Market size and forecast 2025-2030

Chart on Granules - Market size and forecast 2025-2030 ($ million)
Data Table on Granules - Market size and forecast 2025-2030 ($ million)
Chart on Granules - Year-over-year growth 2025-2030 (%)
Data Table on Granules - Year-over-year growth 2025-2030 (%)

9.6 Market opportunity by Type

Market opportunity by Type ($ million)
Data Table on Market opportunity by Type ($ million)

10. Market Segmentation by Application

10.1 Market segments

Chart on Application - Market share 2025-2030 (%)
Data Table on Application - Market share 2025-2030 (%)

10.2 Comparison by Application

Chart on Comparison by Application
Data Table on Comparison by Application

10.3 Dairy alternatives - Market size and forecast 2025-2030

Chart on Dairy alternatives - Market size and forecast 2025-2030 ($ million)
Data Table on Dairy alternatives - Market size and forecast 2025-2030 ($ million)
Chart on Dairy alternatives - Year-over-year growth 2025-2030 (%)
Data Table on Dairy alternatives - Year-over-year growth 2025-2030 (%)

10.4 Bakery products - Market size and forecast 2025-2030

Chart on Bakery products - Market size and forecast 2025-2030 ($ million)
Data Table on Bakery products - Market size and forecast 2025-2030 ($ million)
Chart on Bakery products - Year-over-year growth 2025-2030 (%)
Data Table on Bakery products - Year-over-year growth 2025-2030 (%)

10.5 Health supplements - Market size and forecast 2025-2030

Chart on Health supplements - Market size and forecast 2025-2030 ($ million)
Data Table on Health supplements - Market size and forecast 2025-2030 ($ million)
Chart on Health supplements - Year-over-year growth 2025-2030 (%)
Data Table on Health supplements - Year-over-year growth 2025-2030 (%)

10.6 Others - Market size and forecast 2025-2030

Chart on Others - Market size and forecast 2025-2030 ($ million)
Data Table on Others - Market size and forecast 2025-2030 ($ million)
Chart on Others - Year-over-year growth 2025-2030 (%)
Data Table on Others - Year-over-year growth 2025-2030 (%)

10.7 Market opportunity by Application

Market opportunity by Application ($ million)
Data Table on Market opportunity by Application ($ million)

11. Customer Landscape

11.1 Customer landscape overview

Analysis of price sensitivity, lifecycle, customer purchase basket, adoption rates, and purchase criteria

12. Geographic Landscape

12.1 Geographic segmentation

Chart on Market share by geography 2025-2030 (%)
Data Table on Market share by geography 2025-2030 (%)

12.2 Geographic comparison

Chart on Geographic comparison
Data Table on Geographic comparison

12.3 North America - Market size and forecast 2025-2030

Chart on North America - Market size and forecast 2025-2030 ($ million)
Data Table on North America - Market size and forecast 2025-2030 ($ million)
Chart on North America - Year-over-year growth 2025-2030 (%)
Data Table on North America - Year-over-year growth 2025-2030 (%)
Chart on Regional Comparison - North America
Data Table on Regional Comparison - North America

12.3.1 US - Market size and forecast 2025-2030

Chart on US - Market size and forecast 2025-2030 ($ million)
Data Table on US - Market size and forecast 2025-2030 ($ million)
Chart on US - Year-over-year growth 2025-2030 (%)
Data Table on US - Year-over-year growth 2025-2030 (%)

12.3.2 Canada - Market size and forecast 2025-2030

Chart on Canada - Market size and forecast 2025-2030 ($ million)
Data Table on Canada - Market size and forecast 2025-2030 ($ million)
Chart on Canada - Year-over-year growth 2025-2030 (%)
Data Table on Canada - Year-over-year growth 2025-2030 (%)

12.3.3 Mexico - Market size and forecast 2025-2030

Chart on Mexico - Market size and forecast 2025-2030 ($ million)
Data Table on Mexico - Market size and forecast 2025-2030 ($ million)
Chart on Mexico - Year-over-year growth 2025-2030 (%)
Data Table on Mexico - Year-over-year growth 2025-2030 (%)

12.4 Europe - Market size and forecast 2025-2030

Chart on Europe - Market size and forecast 2025-2030 ($ million)
Data Table on Europe - Market size and forecast 2025-2030 ($ million)
Chart on Europe - Year-over-year growth 2025-2030 (%)
Data Table on Europe - Year-over-year growth 2025-2030 (%)
Chart on Regional Comparison - Europe
Data Table on Regional Comparison - Europe

12.4.1 Germany - Market size and forecast 2025-2030

Chart on Germany - Market size and forecast 2025-2030 ($ million)
Data Table on Germany - Market size and forecast 2025-2030 ($ million)
Chart on Germany - Year-over-year growth 2025-2030 (%)
Data Table on Germany - Year-over-year growth 2025-2030 (%)

12.4.2 UK - Market size and forecast 2025-2030

Chart on UK - Market size and forecast 2025-2030 ($ million)
Data Table on UK - Market size and forecast 2025-2030 ($ million)
Chart on UK - Year-over-year growth 2025-2030 (%)
Data Table on UK - Year-over-year growth 2025-2030 (%)

12.4.3 France - Market size and forecast 2025-2030

Chart on France - Market size and forecast 2025-2030 ($ million)
Data Table on France - Market size and forecast 2025-2030 ($ million)
Chart on France - Year-over-year growth 2025-2030 (%)
Data Table on France - Year-over-year growth 2025-2030 (%)

12.4.4 Italy - Market size and forecast 2025-2030

Chart on Italy - Market size and forecast 2025-2030 ($ million)
Data Table on Italy - Market size and forecast 2025-2030 ($ million)
Chart on Italy - Year-over-year growth 2025-2030 (%)
Data Table on Italy - Year-over-year growth 2025-2030 (%)

12.4.5 Spain - Market size and forecast 2025-2030

Chart on Spain - Market size and forecast 2025-2030 ($ million)
Data Table on Spain - Market size and forecast 2025-2030 ($ million)
Chart on Spain - Year-over-year growth 2025-2030 (%)
Data Table on Spain - Year-over-year growth 2025-2030 (%)

12.4.6 The Netherlands - Market size and forecast 2025-2030

Chart on The Netherlands - Market size and forecast 2025-2030 ($ million)
Data Table on The Netherlands - Market size and forecast 2025-2030 ($ million)
Chart on The Netherlands - Year-over-year growth 2025-2030 (%)
Data Table on The Netherlands - Year-over-year growth 2025-2030 (%)

12.5 APAC - Market size and forecast 2025-2030

Chart on APAC - Market size and forecast 2025-2030 ($ million)
Data Table on APAC - Market size and forecast 2025-2030 ($ million)
Chart on APAC - Year-over-year growth 2025-2030 (%)
Data Table on APAC - Year-over-year growth 2025-2030 (%)
Chart on Regional Comparison - APAC
Data Table on Regional Comparison - APAC

12.5.1 China - Market size and forecast 2025-2030

Chart on China - Market size and forecast 2025-2030 ($ million)
Data Table on China - Market size and forecast 2025-2030 ($ million)
Chart on China - Year-over-year growth 2025-2030 (%)
Data Table on China - Year-over-year growth 2025-2030 (%)

12.5.2 India - Market size and forecast 2025-2030

Chart on India - Market size and forecast 2025-2030 ($ million)
Data Table on India - Market size and forecast 2025-2030 ($ million)
Chart on India - Year-over-year growth 2025-2030 (%)
Data Table on India - Year-over-year growth 2025-2030 (%)

12.5.3 Japan - Market size and forecast 2025-2030

Chart on Japan - Market size and forecast 2025-2030 ($ million)
Data Table on Japan - Market size and forecast 2025-2030 ($ million)
Chart on Japan - Year-over-year growth 2025-2030 (%)
Data Table on Japan - Year-over-year growth 2025-2030 (%)

12.5.4 South Korea - Market size and forecast 2025-2030

Chart on South Korea - Market size and forecast 2025-2030 ($ million)
Data Table on South Korea - Market size and forecast 2025-2030 ($ million)
Chart on South Korea - Year-over-year growth 2025-2030 (%)
Data Table on South Korea - Year-over-year growth 2025-2030 (%)

12.5.5 Australia - Market size and forecast 2025-2030

Chart on Australia - Market size and forecast 2025-2030 ($ million)
Data Table on Australia - Market size and forecast 2025-2030 ($ million)
Chart on Australia - Year-over-year growth 2025-2030 (%)
Data Table on Australia - Year-over-year growth 2025-2030 (%)

12.5.6 Indonesia - Market size and forecast 2025-2030

Chart on Indonesia - Market size and forecast 2025-2030 ($ million)
Data Table on Indonesia - Market size and forecast 2025-2030 ($ million)
Chart on Indonesia - Year-over-year growth 2025-2030 (%)
Data Table on Indonesia - Year-over-year growth 2025-2030 (%)

12.6 Middle East and Africa - Market size and forecast 2025-2030

Chart on Middle East and Africa - Market size and forecast 2025-2030 ($ million)
Data Table on Middle East and Africa - Market size and forecast 2025-2030 ($ million)
Chart on Middle East and Africa - Year-over-year growth 2025-2030 (%)
Data Table on Middle East and Africa - Year-over-year growth 2025-2030 (%)
Chart on Regional Comparison - Middle East and Africa
Data Table on Regional Comparison - Middle East and Africa

12.6.1 UAE - Market size and forecast 2025-2030

Chart on UAE - Market size and forecast 2025-2030 ($ million)
Data Table on UAE - Market size and forecast 2025-2030 ($ million)
Chart on UAE - Year-over-year growth 2025-2030 (%)
Data Table on UAE - Year-over-year growth 2025-2030 (%)

12.6.2 Saudi Arabia - Market size and forecast 2025-2030

Chart on Saudi Arabia - Market size and forecast 2025-2030 ($ million)
Data Table on Saudi Arabia - Market size and forecast 2025-2030 ($ million)
Chart on Saudi Arabia - Year-over-year growth 2025-2030 (%)
Data Table on Saudi Arabia - Year-over-year growth 2025-2030 (%)

12.6.3 South Africa - Market size and forecast 2025-2030

Chart on South Africa - Market size and forecast 2025-2030 ($ million)
Data Table on South Africa - Market size and forecast 2025-2030 ($ million)
Chart on South Africa - Year-over-year growth 2025-2030 (%)
Data Table on South Africa - Year-over-year growth 2025-2030 (%)

12.6.4 Israel - Market size and forecast 2025-2030

Chart on Israel - Market size and forecast 2025-2030 ($ million)
Data Table on Israel - Market size and forecast 2025-2030 ($ million)
Chart on Israel - Year-over-year growth 2025-2030 (%)
Data Table on Israel - Year-over-year growth 2025-2030 (%)

12.6.5 Turkey - Market size and forecast 2025-2030

Chart on Turkey - Market size and forecast 2025-2030 ($ million)
Data Table on Turkey - Market size and forecast 2025-2030 ($ million)
Chart on Turkey - Year-over-year growth 2025-2030 (%)
Data Table on Turkey - Year-over-year growth 2025-2030 (%)

12.7 South America - Market size and forecast 2025-2030

Chart on South America - Market size and forecast 2025-2030 ($ million)
Data Table on South America - Market size and forecast 2025-2030 ($ million)
Chart on South America - Year-over-year growth 2025-2030 (%)
Data Table on South America - Year-over-year growth 2025-2030 (%)
Chart on Regional Comparison - South America
Data Table on Regional Comparison - South America

12.7.1 Brazil - Market size and forecast 2025-2030

Chart on Brazil - Market size and forecast 2025-2030 ($ million)
Data Table on Brazil - Market size and forecast 2025-2030 ($ million)
Chart on Brazil - Year-over-year growth 2025-2030 (%)
Data Table on Brazil - Year-over-year growth 2025-2030 (%)

12.7.2 Argentina - Market size and forecast 2025-2030

Chart on Argentina - Market size and forecast 2025-2030 ($ million)
Data Table on Argentina - Market size and forecast 2025-2030 ($ million)
Chart on Argentina - Year-over-year growth 2025-2030 (%)
Data Table on Argentina - Year-over-year growth 2025-2030 (%)

12.7.3 Chile - Market size and forecast 2025-2030

Chart on Chile - Market size and forecast 2025-2030 ($ million)
Data Table on Chile - Market size and forecast 2025-2030 ($ million)
Chart on Chile - Year-over-year growth 2025-2030 (%)
Data Table on Chile - Year-over-year growth 2025-2030 (%)

12.8 Market opportunity by geography

Market opportunity by geography ($ million)
Data Tables on Market opportunity by geography ($ million)

13. Drivers, Challenges, and Opportunity

13.1 Market drivers

Growing demand for plant-based protein
Increasing popularity of gluten-free diets
Expanding applications in bakery and confectionery industry

13.2 Market challenges

High raw material price volatility
Limited shelf life of nut meals
Allergies and health concerns among consumers

13.3 Impact of drivers and challenges

Impact of drivers and challenges in 2025 and 2030

13.4 Market opportunities

Innovation in nut-based product formulations
Adoption of sustainable and eco-friendly packaging
Rising use of nut meals in sports nutrition products

14. Competitive Landscape

14.1 Overview

14.2

Overview on criticality of inputs and factors of differentiation

14.3 Landscape disruption

Overview on factors of disruption

14.4 Industry risks

Impact of key risks on business

15. Competitive Analysis

15.1 Companies profiled

Companies covered

15.2 Company ranking index

15.3 Market positioning of companies

Matrix on companies position and classification

15.4 Alimento Agro Foods Pvt ltd

Alimento Agro Foods Pvt ltd - Overview
Alimento Agro Foods Pvt ltd - Product / Service
Alimento Agro Foods Pvt ltd - Key offerings
SWOT

15.5 Blue Diamond Growers

Blue Diamond Growers - Overview
Blue Diamond Growers - Product / Service
Blue Diamond Growers - Key offerings
SWOT

15.6 Bobs Red Mill Natural Foods

Bobs Red Mill Natural Foods - Overview
Bobs Red Mill Natural Foods - Product / Service
Bobs Red Mill Natural Foods - Key offerings
SWOT

15.7 Detriot Gourmet Nut Co.

Detriot Gourmet Nut Co. - Overview
Detriot Gourmet Nut Co. - Product / Service
Detriot Gourmet Nut Co. - Key offerings
SWOT

15.8 Golden Peanut Company LLC

Golden Peanut Company LLC - Overview
Golden Peanut Company LLC - Product / Service
Golden Peanut Company LLC - Key offerings
SWOT

15.9 HBS Foods Ltd

HBS Foods Ltd - Overview
HBS Foods Ltd - Product / Service
HBS Foods Ltd - Key offerings
SWOT

15.10 Mariani Nut Co.

Mariani Nut Co. - Overview
Mariani Nut Co. - Product / Service
Mariani Nut Co. - Key offerings
SWOT

15.11 Oh Nuts

Oh Nuts - Overview
Oh Nuts - Product / Service
Oh Nuts - Key offerings
SWOT

15.12 Olam Group Ltd.

Olam Group Ltd. - Overview
Olam Group Ltd. - Business segments
Olam Group Ltd. - Key offerings
Olam Group Ltd. - Segment focus
SWOT

15.13 Planters

Planters - Overview
Planters - Product / Service
Planters - Key offerings
SWOT

15.14 Royal Nut Co.

Royal Nut Co. - Overview
Royal Nut Co. - Product / Service
Royal Nut Co. - Key offerings
SWOT

15.15 Sun Organic Farm

Sun Organic Farm - Overview
Sun Organic Farm - Product / Service
Sun Organic Farm - Key offerings
SWOT

15.16 SunOpta Inc.

SunOpta Inc. - Overview
SunOpta Inc. - Business segments
SunOpta Inc. - Key news
SunOpta Inc. - Key offerings
SunOpta Inc. - Segment focus
SWOT

15.17 Superior Nut Co. Inc.

Superior Nut Co. Inc. - Overview
Superior Nut Co. Inc. - Product / Service
Superior Nut Co. Inc. - Key offerings
SWOT

15.18 Tierra Farm

Tierra Farm - Overview
Tierra Farm - Product / Service
Tierra Farm - Key offerings
SWOT

16. Appendix

16.1 Scope of the report

Market definition
Objectives
Notes and caveats

16.2 Inclusions and exclusions checklist

Inclusions checklist
Exclusions checklist

16.3 Currency conversion rates for US$

16.4 Research methodology

16.5 Data procurement

Information sources

16.6 Data validation

16.7 Validation techniques employed for market sizing

16.8 Data synthesis

16.9 360 degree market analysis

16.10 List of abbreviations

Research Methodology

Technavio presents a detailed picture of the market by way of study, synthesis, and summation of data from multiple sources. The analysts have presented the various facets of the market with a particular focus on identifying the key industry influencers. The data thus presented is comprehensive, reliable, and the result of extensive research, both primary and secondary.

INFORMATION SOURCES

Primary sources

  • Manufacturers and suppliers
  • Channel partners
  • Industry experts
  • Strategic decision makers

Secondary sources

  • Industry journals and periodicals
  • Government data
  • Financial reports of key industry players
  • Historical data
  • Press releases

DATA ANALYSIS

Data Synthesis

  • Collation of data
  • Estimation of key figures
  • Analysis of derived insights

Data Validation

  • Triangulation with data models
  • Reference against proprietary databases
  • Corroboration with industry experts

REPORT WRITING

Qualitative

  • Market drivers
  • Market challenges
  • Market trends
  • Five forces analysis

Quantitative

  • Market size and forecast
  • Market segmentation
  • Geographical insights
  • Competitive landscape

Interested in this report?

Get your sample now to see our research methodology and insights!

Download Now

Frequently Asked Questions

Nut Meals market growth will increase by USD 2110.4 million during 2026-2030.

The Nut Meals market is expected to grow at a CAGR of 4.6% during 2026-2030.

Nut Meals market is segmented by Product (Inorganic nut meals, Organic nut meals) Type (Powder, Flakes, Granules) Application (Dairy alternatives, Bakery products, Health supplements, Others)

Aashirwad Corporation, Alimento Agro Foods Pvt ltd, Blue Diamond Growers, Bobs Red Mill Natural Foods, Detriot Gourmet Nut Co., Golden Peanut Company LLC, HBS Foods Ltd, Mariani Nut Co., Oh Nuts, Olam Group Ltd., Planters, Royal Nut Co., Sun Organic Farm, SunOpta Inc., Superior Nut Co. Inc., Tierra Farm are a few of the key vendors in the Nut Meals market.

North America will register the highest growth rate of 44.6% among the other regions. Therefore, the Nut Meals market in North America is expected to garner significant business opportunities for the vendors during the forecast period.

US, Canada, Mexico, Germany, UK, France, Italy, Spain, The Netherlands, China, India, Japan, South Korea, Australia, Indonesia, UAE, Saudi Arabia, South Africa, Israel, Turkey, Brazil, Argentina, Chile

  • Growing demand for plant-based protein is the driving factor this market.

The Nut Meals market vendors should focus on grabbing business opportunities from the Product segment as it accounted for the largest market share in the base year.