Nutraceutical Packaging Market Analysis, Size, and Forecast 2026-2030: APAC (China, India, and Japan), North America (US, Canada, and Mexico), Europe (Germany, UK, and France), South America (Brazil, Argentina, and Colombia), Middle East and Africa (South Africa, Saudi Arabia, and UAE), and Rest of World (ROW)

Nutraceutical Packaging Market Analysis, Size, and Forecast 2026-2030:
APAC (China, India, and Japan), North America (US, Canada, and Mexico), Europe (Germany, UK, and France), South America (Brazil, Argentina, and Colombia), Middle East and Africa (South Africa, Saudi Arabia, and UAE), and Rest of World (ROW)

Published: Dec 2025 319 Pages SKU: IRTNTR81205

Market Overview at a Glance

$1.93 B
Market Opportunity
5.7%
CAGR 2025 - 2030
38.2%
APAC Growth
$2.08 B
Bottles and jars segment 2024

Nutraceutical Packaging Market Size 2026-2030

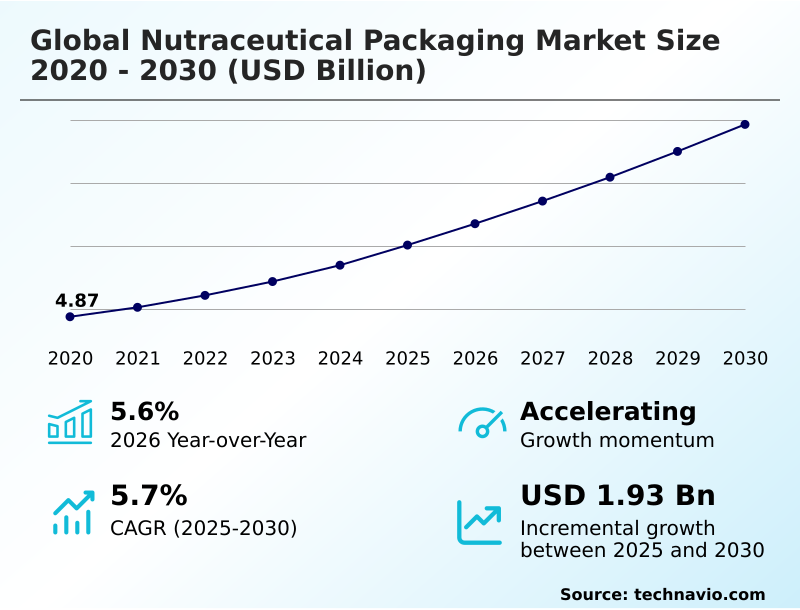
The nutraceutical packaging market size is valued to increase by USD 1.93 billion, at a CAGR of 5.7% from 2025 to 2030. Intensifying global focus on preventive healthcare and personalized nutrition will drive the nutraceutical packaging market.

Major Market Trends & Insights

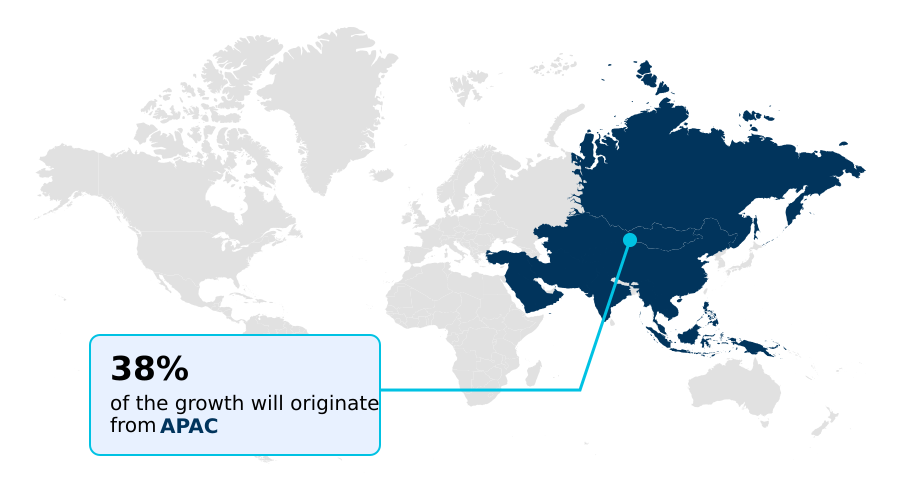
  • APAC dominated the market and accounted for a 38.2% growth during the forecast period.
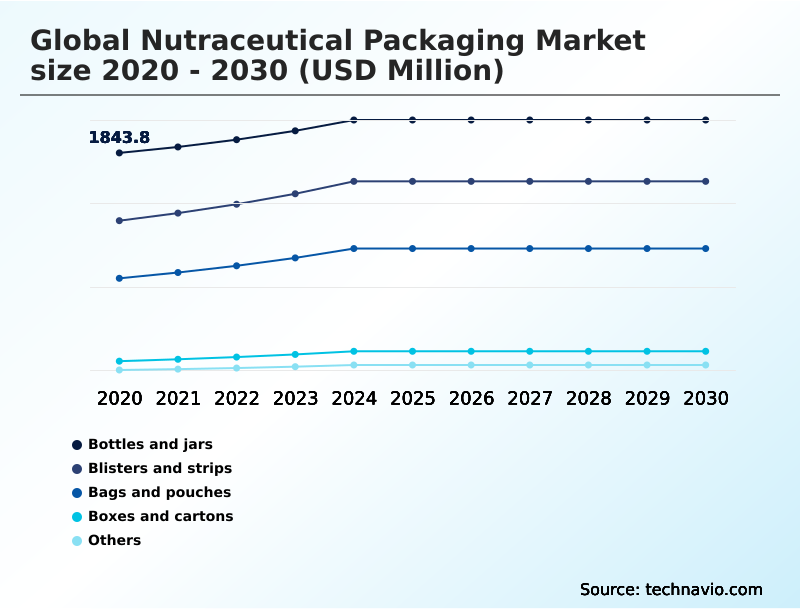
  • By Type of Packaging - Bottles and jars segment was valued at USD 2.08 billion in 2024
  • By Material - Plastic segment accounted for the largest market revenue share in 2024

Market Size & Forecast

  • Market Opportunities: USD 3.07 billion
  • Market Future Opportunities: USD 1.93 billion
  • CAGR from 2025 to 2030 : 5.7%

Market Summary

  • The nutraceutical packaging market is evolving beyond simple containment, becoming an integral component of product efficacy, consumer trust, and brand strategy. Driven by a global shift towards preventive health, demand is surging for solutions that protect sensitive active ingredients while meeting consumer expectations for convenience and transparency.
  • This necessitates the use of advanced formats, from a thermoformed blister pack ensuring unit-dose integrity to flexible pouches optimized for e-commerce. A key dynamic is the tension between functionality and sustainability. Brands must navigate this by adopting innovations like mono-material films and incorporating post-consumer recycled (pcr) content without compromising essential barrier properties.
  • For example, a brand manager launching a new probiotic must weigh the superior barrier of a multi-layer pouch against the marketability and regulatory advantages of a recyclable mono-material alternative. This decision impacts material sourcing, manufacturing costs, and brand perception.
  • Furthermore, the rise of personalized nutrition is creating demand for complex, dose-specific packaging systems, while smart technologies are transforming packages into platforms for product authentication and digital engagement, fundamentally reshaping the industry's value proposition.

What will be the Size of the Nutraceutical Packaging Market during the forecast period?

Get Key Insights on Market Forecast (PDF) Request Free Sample

How is the Nutraceutical Packaging Market Segmented?

The nutraceutical packaging industry research report provides comprehensive data (region-wise segment analysis), with forecasts and estimates in "USD million" for the period 2026-2030, as well as historical data from 2020-2024 for the following segments.

  • Type of packaging
    • Bottles and jars
    • Blisters and strips
    • Bags and pouches
    • Boxes and cartons
    • Others
  • Material
    • Plastic
    • Paper and paperboard
    • Glass
    • Others
  • Application
    • Dietary supplements
    • Functional foods
    • Functional beverages
    • Herbal and botanical extracts
  • Geography
    • APAC
      • China
      • India
      • Japan
    • North America
      • US
      • Canada
      • Mexico
    • Europe
      • Germany
      • UK
      • France
    • South America
      • Brazil
      • Argentina
      • Colombia
    • Middle East and Africa
      • South Africa
      • Saudi Arabia
      • UAE
    • Rest of World (ROW)

By Type of Packaging Insights

The bottles and jars segment is estimated to witness significant growth during the forecast period.

Bottles and jars represent a foundational segment, where the use of a recyclable PET bottle is standard for ensuring food contact material safety. This rigid format is crucial for maintaining supply chain integrity.

For high-value liquids, glass vial packaging combined with a calibrated glass dropper reinforces a premium product perception. These containers often feature an induction sealed liner and a desiccant-lined closure to protect sensitive ingredients.

A key innovation is the emergence of the molded fiber container and composite canister as sustainable alternatives to plastic tubs, which helps in achieving a reduced carbon footprint.

While less suited for an on-the-go consumption format, these containers offer excellent product protection and branding opportunities in the market, with adoption of lightweighted glass improving shipping efficiency by 15%.

Request Free Sample

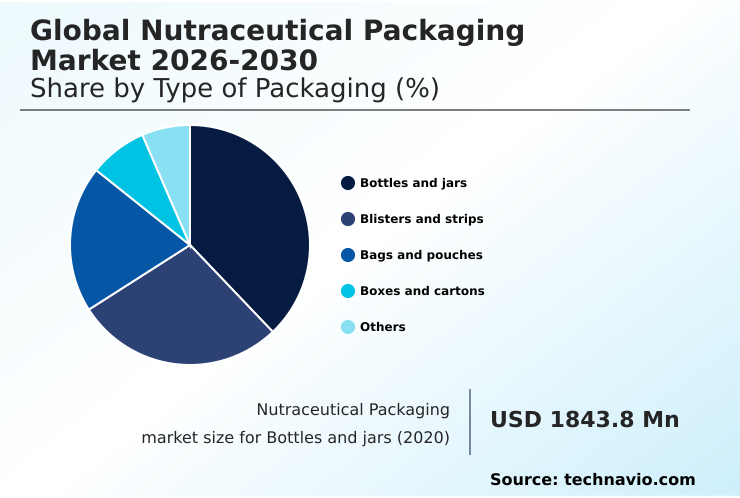
The Bottles and jars segment was valued at USD 2.08 billion in 2024 and showed a gradual increase during the forecast period.

Request Free Sample

Regional Analysis

APAC is estimated to contribute 38.2% to the growth of the global market during the forecast period.Technavio’s analysts have elaborately explained the regional trends and drivers that shape the market during the forecast period.

See How Nutraceutical Packaging Market Demand is Rising in APAC Request Free Sample

The geographic landscape is diverse, with regional priorities shaping packaging demand. In APAC, rapid e-commerce growth drives the need for enhanced track-and-trace capability for counterfeit product mitigation.

In this region, firms leveraging automated packaging lines report a 25% operational efficiency gain. Europe's market is defined by stringent regulations and sustainable material sourcing, favoring a clean label design aesthetic and materials compatible with advanced recycling technology.

North America sees high adoption of convenience formats like the unit-dose delivery system and dose-specific packaging. Technologies like modified atmosphere packaging (MAP) and the aseptic filling process are critical globally for shelf-life extension.

All regions are experiencing the geopolitical instability impact on supply chains, which influences brand differentiation strategy as companies seek to secure material inputs.

Market Dynamics

Our researchers analyzed the data with 2025 as the base year, along with the key drivers, trends, and challenges. A holistic analysis of drivers will help companies refine their marketing strategies to gain a competitive advantage.

  • Developing effective packaging requires a multifaceted approach, from selecting recyclable high-barrier flexible packaging for supplements to creating sustainable packaging solutions for sensitive nutraceuticals. A crucial business decision involves the cost analysis of pcr content in pet bottles, balancing budget with sustainability goals.
  • The impact of e-commerce on nutraceutical packaging design has prioritized robust, lighter solutions, while smart packaging integration for consumer engagement builds brand loyalty. Performance comparisons, such as mono-material pouch versus rigid container performance, guide choices, leveraging the advanced barrier properties of pet plastic bottles where appropriate.
  • Innovation in child-resistant closure design and user accessibility and lightweighting strategies for glass nutraceutical containers are ongoing. The rise of adherence packaging for personalized vitamin subscriptions highlights a major trend, addressed by innovations in single-serve stick pack films.
  • Security is paramount, driving adoption of anti-counterfeiting technologies in supplement packaging, while aseptic packaging for functional beverage shelf life is essential for drinks. Managing supply chain challenges for packaging raw materials remains a top priority, with disruptions causing delays that are twice as frequent as five years ago.
  • The industry is moving toward circular economy models for nutraceutical packaging waste, influenced by consumer perception of sustainable packaging materials. Technical challenges include defining the role of desiccants in moisture-sensitive product packaging, overcoming challenges of recycling multi-layer flexible packaging, and advancing the development of food-grade recycled plastics for supplements. Navigating regulatory compliance for nutraceutical labeling standards underpins all these activities.

What are the key market drivers leading to the rise in the adoption of Nutraceutical Packaging Industry?

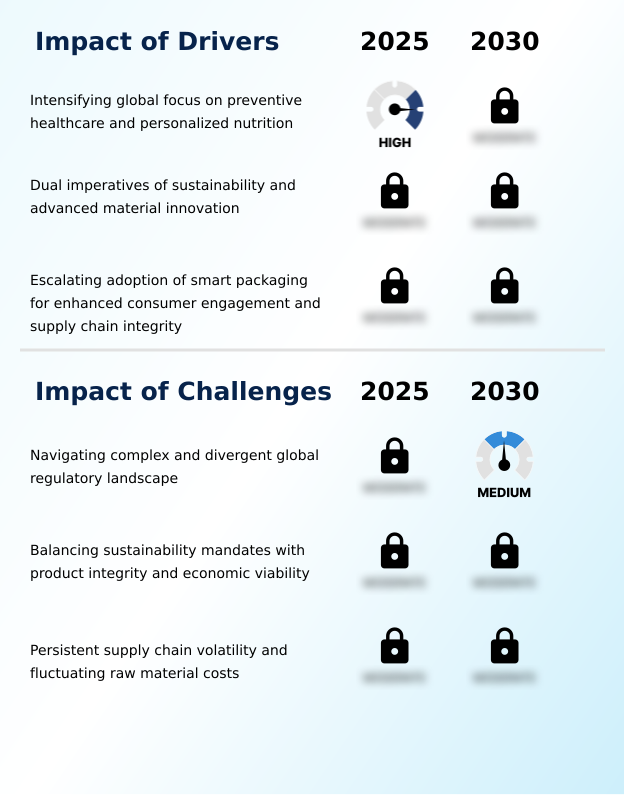
  • An intensifying global focus on preventive healthcare and personalized nutrition is a key driver propelling market growth.

  • The powerful preventive healthcare trend is a primary market driver, increasing demand for packaging that guarantees product safety. For functional beverages, aseptic carton packaging is crucial for shelf life extension.
  • The need for precise dosing and protection drives the use of the thermoformed blister pack and airless pump dispenser. To protect sensitive ingredients, oxygen scavenger technology is integrated directly into materials.
  • The push for sustainability fuels adoption of lightweighting design strategy and water-based dispersion coating on paperboard, reducing plastic use. E-commerce packaging optimization also favors lighter formats.
  • Simultaneously, the demand for product authenticity verification is met by smart labels, with brands using them as a consumer engagement platform reporting a 15% uplift in trust metrics.
  • Use of food-grade pcr plastic has increased by over 25% in certain segments.

What are the market trends shaping the Nutraceutical Packaging Industry?

  • The ascendancy of sustainable and circular packaging solutions represents a primary market trend. This movement is driven by increasing regulatory mandates and consumer demand for environmental responsibility.

  • Key trends are redefining packaging from a passive container to an active tool. The rise of the personalized nutrition service has fueled demand for adherence improvement packaging, such as the innovative dual-chamber sachet that preserves ingredient stability. Convenience is addressed through the single-serve stick pack and the resealable zipper pouch.
  • Material science innovation is enabling smart features; the integration of a flexible integrated circuit facilitates nfc tag integration, turning the package into a digital communication channel for brand loyalty enhancement. An augmented reality (ar) marker can provide immersive experiences, while safety is improved with features like peel-push lidding on blister packs.
  • These advancements show a market shift toward user-centric design, with interactive features increasing consumer engagement time by an average of 40%.

What challenges does the Nutraceutical Packaging Industry face during its growth?

  • Navigating a complex and divergent global regulatory landscape presents a significant challenge to industry growth.

  • Market players face significant challenges in balancing sustainability with performance. Supply chain volatility and raw material cost fluctuation can increase the cost of implementing circular economy principles by up to 20%. While mono-material recyclability is a goal, developing a high-barrier mono-material film that matches the performance of traditional laminates is technically demanding.
  • Regulatory compliance management is complex, with extended producer responsibility (epr) schemes and mandates for post-consumer recycled (pcr) content varying globally. Even established technologies like the child-resistant closure (crc) and tamper-evident feature must be redesigned for sustainability. Adopting a mono-material polyethylene pouch or using narrow neck press and blow techniques for glass lightweighting requires capital investment, creating hurdles for smaller firms.
  • These factors can delay new product launches by up to six months.

Exclusive Technavio Analysis on Customer Landscape

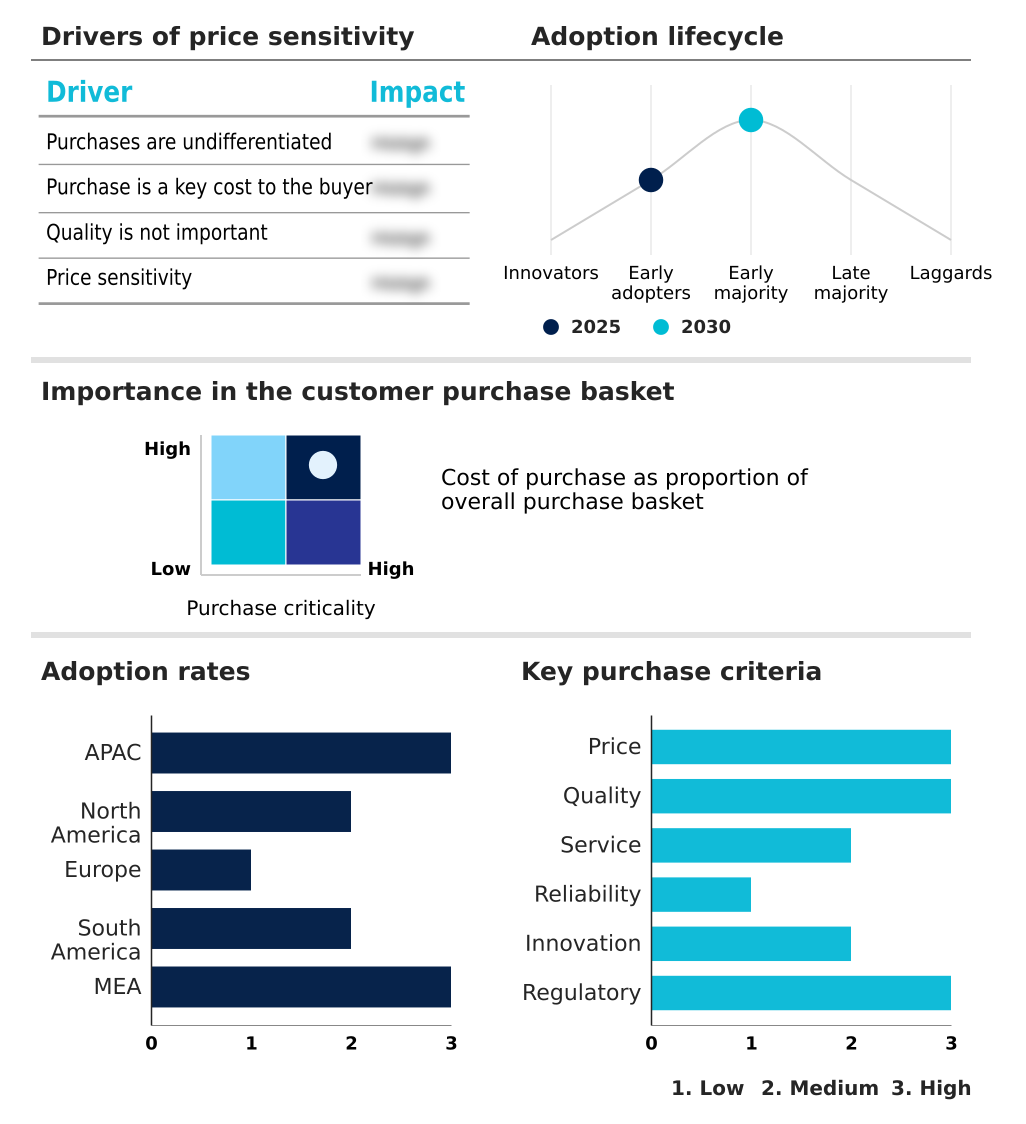
The nutraceutical packaging market forecasting report includes the adoption lifecycle of the market, covering from the innovator’s stage to the laggard’s stage. It focuses on adoption rates in different regions based on penetration. Furthermore, the nutraceutical packaging market report also includes key purchase criteria and drivers of price sensitivity to help companies evaluate and develop their market growth analysis strategies.

Customer Landscape of Nutraceutical Packaging Industry

Competitive Landscape

Companies are implementing various strategies, such as strategic alliances, nutraceutical packaging market forecast, partnerships, mergers and acquisitions, geographical expansion, and product/service launches, to enhance their presence in the industry.

Alpha Plastics Inc. - A key market offering includes a diverse range of flexible pouches, rigid containers, and sustainable solutions engineered for vitamin and supplement protection.

The industry research and growth report includes detailed analyses of the competitive landscape of the market and information about key companies, including:

  • Alpha Plastics Inc.
  • Amcor Plc
  • Berry Global Inc.
  • Bormioli Pharma Spa
  • CCL Industries Inc.
  • Comar LLC
  • Constantia Flexibles GmbH
  • Gerresheimer AG
  • Glenroy Inc.
  • Huhtamaki Oyj
  • Mondi Plc
  • O.Berk Co. LLC
  • ProAmpac Holdings Inc.
  • Sealed Air Corp.
  • SGD Pharma
  • Silgan Holdings Inc.
  • Sonoco Products Co.
  • Tekni Plex Inc.
  • WestRock Co.

Qualitative and quantitative analysis of companies has been conducted to help clients understand the wider business environment as well as the strengths and weaknesses of key industry players. Data is qualitatively analyzed to categorize companies as pure play, category-focused, industry-focused, and diversified; it is quantitatively analyzed to categorize companies as dominant, leading, strong, tentative, and weak.

Recent Development and News in Nutraceutical packaging market

  • In September, 2024, Amcor Plc and Dow announced a strategic partnership to commercialize a new high-barrier, recyclable polyethylene-based pouch designed for moisture-sensitive probiotics, aiming to replace non-recyclable multi-material structures.
  • In November, 2024, Berry Global Inc. acquired a European smart packaging startup for approximately USD 50 million, gaining access to patented NFC-enabled closure technology for real-time dosage tracking and product authentication.
  • In March, 2025, the US Environmental Protection Agency (EPA) proposed new rules under the Resource Conservation and Recovery Act, suggesting mandatory minimums for post-consumer recycled content in rigid plastic nutraceutical containers, starting at 20% by 2028.
  • In May, 2025, Gerresheimer AG launched its new line of lightweight, chemically strengthened glass vials (Type I), reducing material usage by 15% while enhancing durability, targeting the premium liquid supplement and extract market.

Dive into Technavio’s robust research methodology, blending expert interviews, extensive data synthesis, and validated models for unparalleled Nutraceutical Packaging Market insights. See full methodology.

Market Scope
Page number 319
Base year 2025
Historic period 2020-2024
Forecast period 2026-2030
Growth momentum & CAGR Accelerate at a CAGR of 5.7%
Market growth 2026-2030 USD 1927.3 million
Market structure Fragmented
YoY growth 2025-2026(%) 5.6%
Key countries China, India, Japan, South Korea, Australia, Indonesia, US, Canada, Mexico, Germany, UK, France, Italy, The Netherlands, Spain, Brazil, Argentina, Colombia, South Africa, Saudi Arabia, UAE, Israel and Turkey
Competitive landscape Leading Companies, Market Positioning of Companies, Competitive Strategies, and Industry Risks

Request Free Sample

Research Analyst Overview

  • The market is driven by innovations that merge protection with sustainability. A lightweighting design strategy is critical, yet must not compromise the integrity of a high-barrier mono-material film. The standard recyclable pet bottle, secured by a child-resistant closure (crc) and tamper-evident feature, now competes with the mono-material polyethylene pouch.
  • For single servings, the thermoformed blister pack with peel-push lidding and the single-serve stick pack are key. Premium liquids use glass vial packaging with a calibrated glass dropper or an airless pump dispenser. Product integrity is ensured by an induction sealed liner, a desiccant-lined closure, and oxygen scavenger technology.
  • Using post-consumer recycled (pcr) content, specifically food-grade pcr plastic, has become a critical metric. Smart features include nfc tag integration via a flexible integrated circuit and an augmented reality (ar) marker. Sustainable formats like the molded fiber container and composite canister are emerging. Liquids rely on aseptic carton packaging and its aseptic filling process.
  • Extended producer responsibility (epr) laws and modified atmosphere packaging (map) are shaping design, as is narrow neck press and blow technology. The dual-chamber sachet supports the trend toward a unit-dose delivery system and dose-specific packaging. The resealable zipper pouch adds convenience.

What are the Key Data Covered in this Nutraceutical Packaging Market Research and Growth Report?

  • What is the expected growth of the Nutraceutical Packaging Market between 2026 and 2030?

    • USD 1.93 billion, at a CAGR of 5.7%

  • What segmentation does the market report cover?

    • The report is segmented by Type of Packaging (Bottles and jars, Blisters and strips, Bags and pouches, Boxes and cartons, and Others), Material (Plastic, Paper and paperboard, Glass, and Others), Application (Dietary supplements, Functional foods, Functional beverages, and Herbal and botanical extracts) and Geography (APAC, North America, Europe, South America, Middle East and Africa)

  • Which regions are analyzed in the report?

    • APAC, North America, Europe, South America and Middle East and Africa

  • What are the key growth drivers and market challenges?

    • Intensifying global focus on preventive healthcare and personalized nutrition, Navigating complex and divergent global regulatory landscape

  • Who are the major players in the Nutraceutical Packaging Market?

    • Alpha Plastics Inc., Amcor Plc, Berry Global Inc., Bormioli Pharma Spa, CCL Industries Inc., Comar LLC, Constantia Flexibles GmbH, Gerresheimer AG, Glenroy Inc., Huhtamaki Oyj, Mondi Plc, O.Berk Co. LLC, ProAmpac Holdings Inc., Sealed Air Corp., SGD Pharma, Silgan Holdings Inc., Sonoco Products Co., Tekni Plex Inc. and WestRock Co.

Market Research Insights

  • Market dynamics are shaped by the convergence of consumer demands and operational realities. The preventive healthcare trend fuels the need for effective packaging, while the push for circular economy principles challenges material choices.
  • Adoption of a brand differentiation strategy often involves innovative packaging, but this is tempered by supply chain volatility and raw material cost fluctuation, which can increase costs by 15-20% unpredictably. Regulatory compliance management is critical, with non-compliance delaying market entry by months. To address this, firms are focused on e-commerce packaging optimization and ensuring food contact material safety.
  • Integrating smart features for brand loyalty enhancement has been shown to increase repeat purchase rates by over 10%, showcasing a clear return on investment for technologies that build consumer trust and engagement.

We can help! Our analysts can customize this nutraceutical packaging market research report to meet your requirements.

Get in touch

1. Executive Summary

1.1 Market overview

Executive Summary - Chart on Market Overview
Executive Summary - Data Table on Market Overview
Executive Summary - Chart on Global Market Characteristics
Executive Summary - Chart on Market by Geography
Executive Summary - Chart on Market Segmentation by Type of Packaging
Executive Summary - Chart on Market Segmentation by Material
Executive Summary - Chart on Market Segmentation by Application
Executive Summary - Chart on Incremental Growth
Executive Summary - Data Table on Incremental Growth
Executive Summary - Chart on Company Market Positioning

2. Technavio Analysis

2.1 Analysis of price sensitivity, lifecycle, customer purchase basket, adoption rates, and purchase criteria

2.2 Criticality of inputs and Factors of differentiation

Chart on Overview on criticality of inputs and factors of differentiation

2.3 Factors of disruption

Chart on Overview on factors of disruption

2.4 Impact of drivers and challenges

Chart on Impact of drivers and challenges in 2025 and 2030

3. Market Landscape

3.1 Market ecosystem

Chart on Parent Market
Data Table on - Parent Market

3.2 Market characteristics

Chart on Market characteristics analysis

3.3 Value chain analysis

Chart on Value chain analysis

4. Market Sizing

4.1 Market definition

Data Table on Offerings of companies included in the market definition

4.2 Market segment analysis

Market segments

4.3 Market size 2025

4.4 Market outlook: Forecast for 2025-2030

Chart on Global - Market size and forecast 2025-2030 ($ million)
Data Table on Global - Market size and forecast 2025-2030 ($ million)
Chart on Global Market: Year-over-year growth 2025-2030 (%)
Data Table on Global Market: Year-over-year growth 2025-2030 (%)

5. Historic Market Size

5.1 Global Nutraceutical Packaging Market 2020 - 2024

Historic Market Size - Data Table on Global Nutraceutical Packaging Market 2020 - 2024 ($ million)

5.2 Type of Packaging segment analysis 2020 - 2024

Historic Market Size - Type of Packaging Segment 2020 - 2024 ($ million)

5.3 Material segment analysis 2020 - 2024

Historic Market Size - Material Segment 2020 - 2024 ($ million)

5.4 Application segment analysis 2020 - 2024

Historic Market Size - Application Segment 2020 - 2024 ($ million)

5.5 Geography segment analysis 2020 - 2024

Historic Market Size - Geography Segment 2020 - 2024 ($ million)

5.6 Country segment analysis 2020 - 2024

Historic Market Size - Country Segment 2020 - 2024 ($ million)

6. Qualitative Analysis

6.1 Impact of AI on the Global Nutraceutical Packaging Market

7. Five Forces Analysis

7.1 Five forces summary

Five forces analysis - Comparison between 2025 and 2030

7.2 Bargaining power of buyers

Bargaining power of buyers - Impact of key factors 2025 and 2030

7.3 Bargaining power of suppliers

Bargaining power of suppliers - Impact of key factors in 2025 and 2030

7.4 Threat of new entrants

Threat of new entrants - Impact of key factors in 2025 and 2030

7.5 Threat of substitutes

Threat of substitutes - Impact of key factors in 2025 and 2030

7.6 Threat of rivalry

Threat of rivalry - Impact of key factors in 2025 and 2030

7.7 Market condition

Chart on Market condition - Five forces 2025 and 2030

8. Market Segmentation by Type of Packaging

8.1 Market segments

Chart on Type of Packaging - Market share 2025-2030 (%)
Data Table on Type of Packaging - Market share 2025-2030 (%)

8.2 Comparison by Type of Packaging

Chart on Comparison by Type of Packaging
Data Table on Comparison by Type of Packaging

8.3 Bottles and jars - Market size and forecast 2025-2030

Chart on Bottles and jars - Market size and forecast 2025-2030 ($ million)
Data Table on Bottles and jars - Market size and forecast 2025-2030 ($ million)
Chart on Bottles and jars - Year-over-year growth 2025-2030 (%)
Data Table on Bottles and jars - Year-over-year growth 2025-2030 (%)

8.4 Blisters and strips - Market size and forecast 2025-2030

Chart on Blisters and strips - Market size and forecast 2025-2030 ($ million)
Data Table on Blisters and strips - Market size and forecast 2025-2030 ($ million)
Chart on Blisters and strips - Year-over-year growth 2025-2030 (%)
Data Table on Blisters and strips - Year-over-year growth 2025-2030 (%)

8.5 Bags and pouches - Market size and forecast 2025-2030

Chart on Bags and pouches - Market size and forecast 2025-2030 ($ million)
Data Table on Bags and pouches - Market size and forecast 2025-2030 ($ million)
Chart on Bags and pouches - Year-over-year growth 2025-2030 (%)
Data Table on Bags and pouches - Year-over-year growth 2025-2030 (%)

8.6 Boxes and cartons - Market size and forecast 2025-2030

Chart on Boxes and cartons - Market size and forecast 2025-2030 ($ million)
Data Table on Boxes and cartons - Market size and forecast 2025-2030 ($ million)
Chart on Boxes and cartons - Year-over-year growth 2025-2030 (%)
Data Table on Boxes and cartons - Year-over-year growth 2025-2030 (%)

8.7 Others - Market size and forecast 2025-2030

Chart on Others - Market size and forecast 2025-2030 ($ million)
Data Table on Others - Market size and forecast 2025-2030 ($ million)
Chart on Others - Year-over-year growth 2025-2030 (%)
Data Table on Others - Year-over-year growth 2025-2030 (%)

8.8 Market opportunity by Type of Packaging

Market opportunity by Type of Packaging ($ million)
Data Table on Market opportunity by Type of Packaging ($ million)

9. Market Segmentation by Material

9.1 Market segments

Chart on Material - Market share 2025-2030 (%)
Data Table on Material - Market share 2025-2030 (%)

9.2 Comparison by Material

Chart on Comparison by Material
Data Table on Comparison by Material

9.3 Plastic - Market size and forecast 2025-2030

Chart on Plastic - Market size and forecast 2025-2030 ($ million)
Data Table on Plastic - Market size and forecast 2025-2030 ($ million)
Chart on Plastic - Year-over-year growth 2025-2030 (%)
Data Table on Plastic - Year-over-year growth 2025-2030 (%)

9.4 Paper and paperboard - Market size and forecast 2025-2030

Chart on Paper and paperboard - Market size and forecast 2025-2030 ($ million)
Data Table on Paper and paperboard - Market size and forecast 2025-2030 ($ million)
Chart on Paper and paperboard - Year-over-year growth 2025-2030 (%)
Data Table on Paper and paperboard - Year-over-year growth 2025-2030 (%)

9.5 Glass - Market size and forecast 2025-2030

Chart on Glass - Market size and forecast 2025-2030 ($ million)
Data Table on Glass - Market size and forecast 2025-2030 ($ million)
Chart on Glass - Year-over-year growth 2025-2030 (%)
Data Table on Glass - Year-over-year growth 2025-2030 (%)

9.6 Others - Market size and forecast 2025-2030

Chart on Others - Market size and forecast 2025-2030 ($ million)
Data Table on Others - Market size and forecast 2025-2030 ($ million)
Chart on Others - Year-over-year growth 2025-2030 (%)
Data Table on Others - Year-over-year growth 2025-2030 (%)

9.7 Market opportunity by Material

Market opportunity by Material ($ million)
Data Table on Market opportunity by Material ($ million)

10. Market Segmentation by Application

10.1 Market segments

Chart on Application - Market share 2025-2030 (%)
Data Table on Application - Market share 2025-2030 (%)

10.2 Comparison by Application

Chart on Comparison by Application
Data Table on Comparison by Application

10.3 Dietary supplements - Market size and forecast 2025-2030

Chart on Dietary supplements - Market size and forecast 2025-2030 ($ million)
Data Table on Dietary supplements - Market size and forecast 2025-2030 ($ million)
Chart on Dietary supplements - Year-over-year growth 2025-2030 (%)
Data Table on Dietary supplements - Year-over-year growth 2025-2030 (%)

10.4 Functional foods - Market size and forecast 2025-2030

Chart on Functional foods - Market size and forecast 2025-2030 ($ million)
Data Table on Functional foods - Market size and forecast 2025-2030 ($ million)
Chart on Functional foods - Year-over-year growth 2025-2030 (%)
Data Table on Functional foods - Year-over-year growth 2025-2030 (%)

10.5 Functional beverages - Market size and forecast 2025-2030

Chart on Functional beverages - Market size and forecast 2025-2030 ($ million)
Data Table on Functional beverages - Market size and forecast 2025-2030 ($ million)
Chart on Functional beverages - Year-over-year growth 2025-2030 (%)
Data Table on Functional beverages - Year-over-year growth 2025-2030 (%)

10.6 Herbal and botanical extracts - Market size and forecast 2025-2030

Chart on Herbal and botanical extracts - Market size and forecast 2025-2030 ($ million)
Data Table on Herbal and botanical extracts - Market size and forecast 2025-2030 ($ million)
Chart on Herbal and botanical extracts - Year-over-year growth 2025-2030 (%)
Data Table on Herbal and botanical extracts - Year-over-year growth 2025-2030 (%)

10.7 Market opportunity by Application

Market opportunity by Application ($ million)
Data Table on Market opportunity by Application ($ million)

11. Customer Landscape

11.1 Customer landscape overview

Analysis of price sensitivity, lifecycle, customer purchase basket, adoption rates, and purchase criteria

12. Geographic Landscape

12.1 Geographic segmentation

Chart on Market share by geography 2025-2030 (%)
Data Table on Market share by geography 2025-2030 (%)

12.2 Geographic comparison

Chart on Geographic comparison
Data Table on Geographic comparison

12.3 APAC - Market size and forecast 2025-2030

Chart on APAC - Market size and forecast 2025-2030 ($ million)
Data Table on APAC - Market size and forecast 2025-2030 ($ million)
Chart on APAC - Year-over-year growth 2025-2030 (%)
Data Table on APAC - Year-over-year growth 2025-2030 (%)
Chart on Regional Comparison - APAC
Data Table on Regional Comparison - APAC

12.3.1 China - Market size and forecast 2025-2030

Chart on China - Market size and forecast 2025-2030 ($ million)
Data Table on China - Market size and forecast 2025-2030 ($ million)
Chart on China - Year-over-year growth 2025-2030 (%)
Data Table on China - Year-over-year growth 2025-2030 (%)

12.3.2 India - Market size and forecast 2025-2030

Chart on India - Market size and forecast 2025-2030 ($ million)
Data Table on India - Market size and forecast 2025-2030 ($ million)
Chart on India - Year-over-year growth 2025-2030 (%)
Data Table on India - Year-over-year growth 2025-2030 (%)

12.3.3 Japan - Market size and forecast 2025-2030

Chart on Japan - Market size and forecast 2025-2030 ($ million)
Data Table on Japan - Market size and forecast 2025-2030 ($ million)
Chart on Japan - Year-over-year growth 2025-2030 (%)
Data Table on Japan - Year-over-year growth 2025-2030 (%)

12.3.4 South Korea - Market size and forecast 2025-2030

Chart on South Korea - Market size and forecast 2025-2030 ($ million)
Data Table on South Korea - Market size and forecast 2025-2030 ($ million)
Chart on South Korea - Year-over-year growth 2025-2030 (%)
Data Table on South Korea - Year-over-year growth 2025-2030 (%)

12.3.5 Australia - Market size and forecast 2025-2030

Chart on Australia - Market size and forecast 2025-2030 ($ million)
Data Table on Australia - Market size and forecast 2025-2030 ($ million)
Chart on Australia - Year-over-year growth 2025-2030 (%)
Data Table on Australia - Year-over-year growth 2025-2030 (%)

12.3.6 Indonesia - Market size and forecast 2025-2030

Chart on Indonesia - Market size and forecast 2025-2030 ($ million)
Data Table on Indonesia - Market size and forecast 2025-2030 ($ million)
Chart on Indonesia - Year-over-year growth 2025-2030 (%)
Data Table on Indonesia - Year-over-year growth 2025-2030 (%)

12.4 North America - Market size and forecast 2025-2030

Chart on North America - Market size and forecast 2025-2030 ($ million)
Data Table on North America - Market size and forecast 2025-2030 ($ million)
Chart on North America - Year-over-year growth 2025-2030 (%)
Data Table on North America - Year-over-year growth 2025-2030 (%)
Chart on Regional Comparison - North America
Data Table on Regional Comparison - North America

12.4.1 US - Market size and forecast 2025-2030

Chart on US - Market size and forecast 2025-2030 ($ million)
Data Table on US - Market size and forecast 2025-2030 ($ million)
Chart on US - Year-over-year growth 2025-2030 (%)
Data Table on US - Year-over-year growth 2025-2030 (%)

12.4.2 Canada - Market size and forecast 2025-2030

Chart on Canada - Market size and forecast 2025-2030 ($ million)
Data Table on Canada - Market size and forecast 2025-2030 ($ million)
Chart on Canada - Year-over-year growth 2025-2030 (%)
Data Table on Canada - Year-over-year growth 2025-2030 (%)

12.4.3 Mexico - Market size and forecast 2025-2030

Chart on Mexico - Market size and forecast 2025-2030 ($ million)
Data Table on Mexico - Market size and forecast 2025-2030 ($ million)
Chart on Mexico - Year-over-year growth 2025-2030 (%)
Data Table on Mexico - Year-over-year growth 2025-2030 (%)

12.5 Europe - Market size and forecast 2025-2030

Chart on Europe - Market size and forecast 2025-2030 ($ million)
Data Table on Europe - Market size and forecast 2025-2030 ($ million)
Chart on Europe - Year-over-year growth 2025-2030 (%)
Data Table on Europe - Year-over-year growth 2025-2030 (%)
Chart on Regional Comparison - Europe
Data Table on Regional Comparison - Europe

12.5.1 Germany - Market size and forecast 2025-2030

Chart on Germany - Market size and forecast 2025-2030 ($ million)
Data Table on Germany - Market size and forecast 2025-2030 ($ million)
Chart on Germany - Year-over-year growth 2025-2030 (%)
Data Table on Germany - Year-over-year growth 2025-2030 (%)

12.5.2 UK - Market size and forecast 2025-2030

Chart on UK - Market size and forecast 2025-2030 ($ million)
Data Table on UK - Market size and forecast 2025-2030 ($ million)
Chart on UK - Year-over-year growth 2025-2030 (%)
Data Table on UK - Year-over-year growth 2025-2030 (%)

12.5.3 France - Market size and forecast 2025-2030

Chart on France - Market size and forecast 2025-2030 ($ million)
Data Table on France - Market size and forecast 2025-2030 ($ million)
Chart on France - Year-over-year growth 2025-2030 (%)
Data Table on France - Year-over-year growth 2025-2030 (%)

12.5.4 Italy - Market size and forecast 2025-2030

Chart on Italy - Market size and forecast 2025-2030 ($ million)
Data Table on Italy - Market size and forecast 2025-2030 ($ million)
Chart on Italy - Year-over-year growth 2025-2030 (%)
Data Table on Italy - Year-over-year growth 2025-2030 (%)

12.5.5 The Netherlands - Market size and forecast 2025-2030

Chart on The Netherlands - Market size and forecast 2025-2030 ($ million)
Data Table on The Netherlands - Market size and forecast 2025-2030 ($ million)
Chart on The Netherlands - Year-over-year growth 2025-2030 (%)
Data Table on The Netherlands - Year-over-year growth 2025-2030 (%)

12.5.6 Spain - Market size and forecast 2025-2030

Chart on Spain - Market size and forecast 2025-2030 ($ million)
Data Table on Spain - Market size and forecast 2025-2030 ($ million)
Chart on Spain - Year-over-year growth 2025-2030 (%)
Data Table on Spain - Year-over-year growth 2025-2030 (%)

12.6 South America - Market size and forecast 2025-2030

Chart on South America - Market size and forecast 2025-2030 ($ million)
Data Table on South America - Market size and forecast 2025-2030 ($ million)
Chart on South America - Year-over-year growth 2025-2030 (%)
Data Table on South America - Year-over-year growth 2025-2030 (%)
Chart on Regional Comparison - South America
Data Table on Regional Comparison - South America

12.6.1 Brazil - Market size and forecast 2025-2030

Chart on Brazil - Market size and forecast 2025-2030 ($ million)
Data Table on Brazil - Market size and forecast 2025-2030 ($ million)
Chart on Brazil - Year-over-year growth 2025-2030 (%)
Data Table on Brazil - Year-over-year growth 2025-2030 (%)

12.6.2 Argentina - Market size and forecast 2025-2030

Chart on Argentina - Market size and forecast 2025-2030 ($ million)
Data Table on Argentina - Market size and forecast 2025-2030 ($ million)
Chart on Argentina - Year-over-year growth 2025-2030 (%)
Data Table on Argentina - Year-over-year growth 2025-2030 (%)

12.6.3 Colombia - Market size and forecast 2025-2030

Chart on Colombia - Market size and forecast 2025-2030 ($ million)
Data Table on Colombia - Market size and forecast 2025-2030 ($ million)
Chart on Colombia - Year-over-year growth 2025-2030 (%)
Data Table on Colombia - Year-over-year growth 2025-2030 (%)

12.7 Middle East and Africa - Market size and forecast 2025-2030

Chart on Middle East and Africa - Market size and forecast 2025-2030 ($ million)
Data Table on Middle East and Africa - Market size and forecast 2025-2030 ($ million)
Chart on Middle East and Africa - Year-over-year growth 2025-2030 (%)
Data Table on Middle East and Africa - Year-over-year growth 2025-2030 (%)
Chart on Regional Comparison - Middle East and Africa
Data Table on Regional Comparison - Middle East and Africa

12.7.1 South Africa - Market size and forecast 2025-2030

Chart on South Africa - Market size and forecast 2025-2030 ($ million)
Data Table on South Africa - Market size and forecast 2025-2030 ($ million)
Chart on South Africa - Year-over-year growth 2025-2030 (%)
Data Table on South Africa - Year-over-year growth 2025-2030 (%)

12.7.2 Saudi Arabia - Market size and forecast 2025-2030

Chart on Saudi Arabia - Market size and forecast 2025-2030 ($ million)
Data Table on Saudi Arabia - Market size and forecast 2025-2030 ($ million)
Chart on Saudi Arabia - Year-over-year growth 2025-2030 (%)
Data Table on Saudi Arabia - Year-over-year growth 2025-2030 (%)

12.7.3 UAE - Market size and forecast 2025-2030

Chart on UAE - Market size and forecast 2025-2030 ($ million)
Data Table on UAE - Market size and forecast 2025-2030 ($ million)
Chart on UAE - Year-over-year growth 2025-2030 (%)
Data Table on UAE - Year-over-year growth 2025-2030 (%)

12.7.4 Israel - Market size and forecast 2025-2030

Chart on Israel - Market size and forecast 2025-2030 ($ million)
Data Table on Israel - Market size and forecast 2025-2030 ($ million)
Chart on Israel - Year-over-year growth 2025-2030 (%)
Data Table on Israel - Year-over-year growth 2025-2030 (%)

12.7.5 Turkey - Market size and forecast 2025-2030

Chart on Turkey - Market size and forecast 2025-2030 ($ million)
Data Table on Turkey - Market size and forecast 2025-2030 ($ million)
Chart on Turkey - Year-over-year growth 2025-2030 (%)
Data Table on Turkey - Year-over-year growth 2025-2030 (%)

12.8 Market opportunity by geography

Market opportunity by geography ($ million)
Data Tables on Market opportunity by geography ($ million)

13. Drivers, Challenges, and Opportunity

13.1 Market drivers

Intensifying global focus on preventive healthcare and personalized nutrition
Dual imperatives of sustainability and advanced material innovation
Escalating adoption of smart packaging for enhanced consumer engagement and supply chain integrity

13.2 Market challenges

Navigating complex and divergent global regulatory landscape
Balancing sustainability mandates with product integrity and economic viability
Persistent supply chain volatility and fluctuating raw material costs

13.3 Impact of drivers and challenges

Impact of drivers and challenges in 2025 and 2030

13.4 Market opportunities

Ascendancy of sustainable and circular packaging solutions
Integration of smart and interactive packaging technologies
Rise of personalized and convenience-oriented packaging

14. Competitive Landscape

14.1 Overview

14.2

Overview on criticality of inputs and factors of differentiation

14.3 Landscape disruption

Overview on factors of disruption

14.4 Industry risks

Impact of key risks on business

15. Competitive Analysis

15.1 Companies profiled

Companies covered

15.2 Company ranking index

15.3 Market positioning of companies

Matrix on companies position and classification

15.4 Amcor Plc

Amcor Plc - Overview
Amcor Plc - Business segments
Amcor Plc - Key news
Amcor Plc - Key offerings
Amcor Plc - Segment focus
SWOT

15.5 Berry Global Inc.

Berry Global Inc. - Overview
Berry Global Inc. - Business segments
Berry Global Inc. - Key news
Berry Global Inc. - Key offerings
Berry Global Inc. - Segment focus
SWOT

15.6 Bormioli Pharma Spa

Bormioli Pharma Spa - Overview
Bormioli Pharma Spa - Product / Service
Bormioli Pharma Spa - Key offerings
SWOT

15.7 CCL Industries Inc.

CCL Industries Inc. - Overview
CCL Industries Inc. - Business segments
CCL Industries Inc. - Key news
CCL Industries Inc. - Key offerings
CCL Industries Inc. - Segment focus
SWOT

15.8 Comar LLC

Comar LLC - Overview
Comar LLC - Product / Service
Comar LLC - Key offerings
SWOT

15.9 Constantia Flexibles GmbH

Constantia Flexibles GmbH - Overview
Constantia Flexibles GmbH - Product / Service
Constantia Flexibles GmbH - Key offerings
SWOT

15.10 Gerresheimer AG

Gerresheimer AG - Overview
Gerresheimer AG - Business segments
Gerresheimer AG - Key news
Gerresheimer AG - Key offerings
Gerresheimer AG - Segment focus
SWOT

15.11 Mondi Plc

Mondi Plc - Overview
Mondi Plc - Business segments
Mondi Plc - Key news
Mondi Plc - Key offerings
Mondi Plc - Segment focus
SWOT

15.12 ProAmpac Holdings Inc.

ProAmpac Holdings Inc. - Overview
ProAmpac Holdings Inc. - Product / Service
ProAmpac Holdings Inc. - Key news
ProAmpac Holdings Inc. - Key offerings
SWOT

15.13 Sealed Air Corp.

Sealed Air Corp. - Overview
Sealed Air Corp. - Business segments
Sealed Air Corp. - Key news
Sealed Air Corp. - Key offerings
Sealed Air Corp. - Segment focus
SWOT

15.14 SGD Pharma

SGD Pharma - Overview
SGD Pharma - Product / Service
SGD Pharma - Key offerings
SWOT

15.15 Silgan Holdings Inc.

Silgan Holdings Inc. - Overview
Silgan Holdings Inc. - Business segments
Silgan Holdings Inc. - Key offerings
Silgan Holdings Inc. - Segment focus
SWOT

15.16 Sonoco Products Co.

Sonoco Products Co. - Overview
Sonoco Products Co. - Business segments
Sonoco Products Co. - Key news
Sonoco Products Co. - Key offerings
Sonoco Products Co. - Segment focus
SWOT

15.17 Tekni Plex Inc.

Tekni Plex Inc. - Overview
Tekni Plex Inc. - Product / Service
Tekni Plex Inc. - Key offerings
SWOT

15.18 WestRock Co.

WestRock Co. - Overview
WestRock Co. - Business segments
WestRock Co. - Key news
WestRock Co. - Key offerings
WestRock Co. - Segment focus
SWOT

16. Appendix

16.1 Scope of the report

Market definition
Objectives
Notes and caveats

16.2 Inclusions and exclusions checklist

Inclusions checklist
Exclusions checklist

16.3 Currency conversion rates for US$

16.4 Research methodology

16.5 Data procurement

Information sources

16.6 Data validation

16.7 Validation techniques employed for market sizing

16.8 Data synthesis

16.9 360 degree market analysis

16.10 List of abbreviations

Research Methodology

Technavio presents a detailed picture of the market by way of study, synthesis, and summation of data from multiple sources. The analysts have presented the various facets of the market with a particular focus on identifying the key industry influencers. The data thus presented is comprehensive, reliable, and the result of extensive research, both primary and secondary.

INFORMATION SOURCES

Primary sources

  • Manufacturers and suppliers
  • Channel partners
  • Industry experts
  • Strategic decision makers

Secondary sources

  • Industry journals and periodicals
  • Government data
  • Financial reports of key industry players
  • Historical data
  • Press releases

DATA ANALYSIS

Data Synthesis

  • Collation of data
  • Estimation of key figures
  • Analysis of derived insights

Data Validation

  • Triangulation with data models
  • Reference against proprietary databases
  • Corroboration with industry experts

REPORT WRITING

Qualitative

  • Market drivers
  • Market challenges
  • Market trends
  • Five forces analysis

Quantitative

  • Market size and forecast
  • Market segmentation
  • Geographical insights
  • Competitive landscape

Interested in this report?

Get your sample now to see our research methodology and insights!

Download Now

Frequently Asked Questions

Nutraceutical Packaging market growth will increase by USD 1927.3 million during 2026-2030 .

The Nutraceutical Packaging market is expected to grow at a CAGR of 5.7% during 2026-2030 .

Nutraceutical Packaging market is segmented by Type of packaging (Bottles and jars, Blisters and strips, Bags and pouches, Boxes and cartons, Others) Material (Plastic, Paper and paperboard, Glass, Others) Application (Dietary supplements, Functional foods, Functional beverages, Herbal and botanical extracts)

Alpha Plastics Inc., Amcor Plc, Berry Global Inc., Bormioli Pharma Spa, CCL Industries Inc., Comar LLC, Constantia Flexibles GmbH, Gerresheimer AG, Glenroy Inc., Huhtamaki Oyj, Mondi Plc, O.Berk Co. LLC, ProAmpac Holdings Inc., Sealed Air Corp., SGD Pharma, Silgan Holdings Inc., Sonoco Products Co., Tekni Plex Inc., WestRock Co. are a few of the key vendors in the Nutraceutical Packaging market.

APAC will register the highest growth rate of 38.2% among the other regions. Therefore, the Nutraceutical Packaging market in APAC is expected to garner significant business opportunities for the vendors during the forecast period.

China, India, Japan, South Korea, Australia, Indonesia, US, Canada, Mexico, Germany, UK, France, Italy, The Netherlands, Spain, Brazil, Argentina, Colombia, South Africa, Saudi Arabia, UAE, Israel, Turkey

  • Intensifying global focus on preventive healthcare and personalized nutrition is the driving factor this market.

The Nutraceutical Packaging market vendors should focus on grabbing business opportunities from the Type of packaging segment as it accounted for the largest market share in the base year.