Offshore Drilling Rigs Market Size 2025-2029
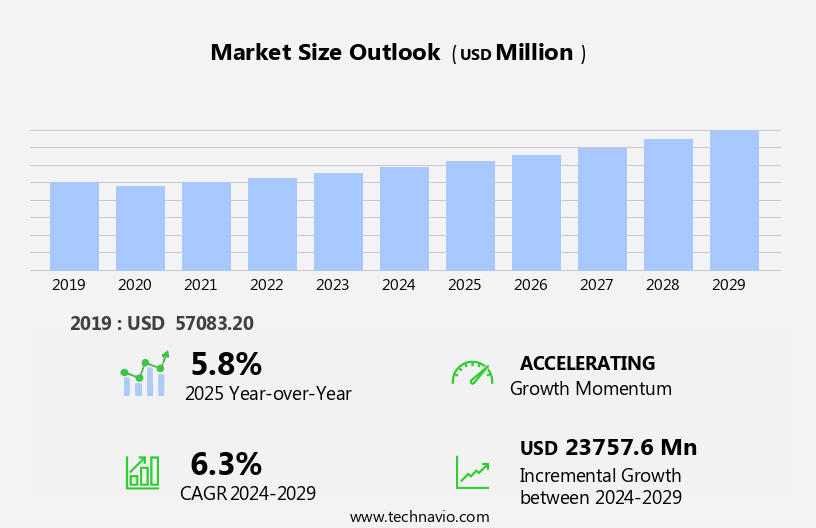
The offshore drilling rigs market size is forecast to increase by USD 23.76 billion at a CAGR of 6.3% between 2024 and 2029.
- The market is driven by the increasing investments in the upstream oil and gas sector and the discovery of new oil and gas resources. The industry's growth is fueled by the continuous exploration and production activities, particularly in deepwater and ultra-deepwater regions. However, the market faces significant challenges, including the growing environmental concerns associated with offshore drilling rigs' operation. Offshore drilling continues to play a pivotal role in oilfield services, with the market witnessing significant growth due to increasing investments. These concerns, such as the risk of oil spills and their devastating environmental impact, are increasingly becoming a major concern for governments and stakeholders.
- As a result, stricter regulations are being implemented to mitigate these risks, which may increase operational costs for drilling companies. This market is driven by the ongoing quest for untapped oil and natural gas, particularly in deep and ultradeepwater regions. Companies seeking to capitalize on market opportunities must stay updated on regulatory changes and invest in sustainable technologies to minimize their environmental footprint. Additionally, collaboration with local communities and stakeholders can help build trust and ensure the long-term viability of offshore drilling projects.
What will be the Size of the Offshore Drilling Rigs Market during the forecast period?
Explore in-depth regional segment analysis with market size data - historical 2019-2023 and forecasts 2025-2029 - in the full report.
Request Free Sample
Offshore drilling rigs continue to evolve, integrating advanced technologies to enhance efficiency, safety, and sustainability. Data acquisition plays a crucial role in optimizing drilling operations, with real-time monitoring and digital twins enabling drilling optimization and asset integrity management. Green technologies, such as subsea robotics and hydraulic fracturing with reduced emissions, are gaining traction. Sand control, wellbore stability, and flow assurance are essential for maintaining well integrity and maximizing production. Drilling rigs now incorporate autonomous operations, artificial lift, and condition monitoring systems for improved performance reporting. Cloud computing facilitates data analytics and data visualization, enabling remote monitoring and environmental monitoring.
Integrity management and reservoir characterization are essential for extending the life of offshore assets, while multi-lateral drilling and drilling optimization ensure efficient resource extraction. Wellbore stability, drilling optimization, and flow assurance are key focus areas for operators seeking to minimize non-productive time. Condition monitoring, corrosion monitoring, and environmental monitoring are essential for maintaining regulatory compliance and reducing operational risks. The market comprises various rig types, including jackup rigs, drillships, and semi-submersibles, employed in shallow, deep, and ultradeepwater drilling activities.
How is this Offshore Drilling Rigs Industry segmented?
The offshore drilling rigs industry research report provides comprehensive data (region-wise segment analysis), with forecasts and estimates in "USD million" for the period 2025-2029, as well as historical data from 2019-2023 for the following segments.
- Type
- Bottom supported rigs
- Floating rigs
- Application
- Shallow water
- Deepwater
- Ultra-deepwater
- Product
- Jackups
- Drillships
- Semisubmersibles
- Geography
- North America
- US
- Canada
- Europe
- Norway
- Russia
- UK
- APAC
- China
- India
- South America
- Brazil
- Rest of World (ROW)
- North America
By Type Insights
The Bottom supported rigs segment is estimated to witness significant growth during the forecast period. The market encompasses various components and services, including material handling, offshore construction, capital expenditure, water treatment, helicopter transport, drilling fluids, automated subsea systems, subsea engineering, corrosion protection, waste management, environmental impact assessment, subsea pipelines, mud pumps, drilling permits, directional drilling, drilling riser, project management, life rafts, mud logging, crew boats, lease agreements, dynamic positioning (DP), subsea manifolds, rig maintenance, regulatory compliance, operating expenditure, drill ships, semi-submersible rigs, safety systems, and jackup rigs.
Bottom supported rigs, which have legs that are fixed to the seabed, hold a significant share in the market. Jack-up rigs, a type of bottom supported rig, have retractable legs that can be lowered to the seabed. However, they can only operate in depths that are less than the length of their legs, typically up to 500 feet. Platform rigs, another type of bottom supported rig, have steel columns that anchor the drilling platform to the seabed. In 2024, the bottom supported rigs segment dominated the market due to the widespread adoption of jack-up rigs. The market is characterized by various activities and trends. Capital expenditure on offshore drilling projects is increasing due to the rising demand for oil and gas. Water treatment systems are essential for offshore drilling operations to ensure the safe disposal of drilling waste. Helicopter transport is commonly used for crew and equipment transportation to offshore platforms. Drilling fluids are crucial for maintaining wellbore stability and enhancing drilling efficiency.
Automated subsea systems and subsea engineering are essential for optimizing production and reducing operational costs. Corrosion protection is crucial for ensuring the longevity of offshore drilling infrastructure. Waste management is a significant concern for offshore drilling operations due to environmental regulations. Environmental impact assessments are mandatory for offshore drilling projects to ensure minimal harm to marine life and ecosystems. Subsea pipelines are used for transporting crude oil and natural gas from offshore platforms to onshore facilities. Mud pumps are used for circulating drilling mud during drilling operations. Drilling permits are necessary for initiating offshore drilling projects. Directional drilling and horizontal drilling are advanced drilling techniques used for maximizing reservoir recovery. Drilling risers are essential for connecting the drilling platform to the drill ship or semi-submersible rig. Project management is crucial for ensuring the successful execution of offshore drilling projects.
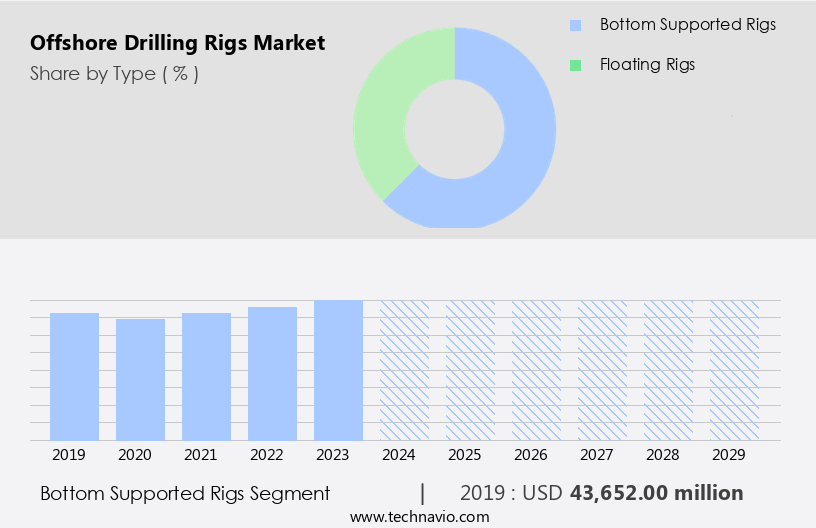
The Bottom supported rigs segment was valued at USD 43.65 billion in 2019 and showed a gradual increase during the forecast period.
Life rafts and other safety systems are essential for ensuring the safety of offshore drilling personnel. Regulatory compliance is a significant challenge for offshore drilling operators due to stringent environmental and safety regulations. Operating expenditure is a significant component of the market due to the high operational costs of offshore drilling projects. Drill ships and semi-submersible rigs are commonly used for deepwater drilling operations. Supply chain management is crucial for ensuring the timely delivery of equipment and supplies to offshore drilling projects. Production platforms are essential for processing and extracting crude oil and natural gas from offshore reservoirs.
Power generation is crucial for providing electricity to offshore drilling platforms. Design engineering is essential for designing and constructing offshore drilling infrastructure. Seismic surveys and geotechnical data are essential for evaluating the subsurface geology of offshore drilling sites. Marine cables are used for transmitting power and data to offshore platforms. Top drives are used for rotating drill strings. Emergency shutdown systems are crucial for ensuring the safety of offshore drilling personnel and infrastructure. Underwater vehicles (UVs) are used for inspecting and maintaining offshore drilling infrastructure. Offshore logistics is crucial for managing the transportation of personnel, equipment, and supplies to offshore drilling projects.
The market is a dynamic and complex industry that involves various components and services. Capital expenditure, water treatment, helicopter transport, drilling fluids, automated subsea systems, subsea engineering, corrosion protection, waste management, environmental impact assessment, subsea pipelines, mud pumps, drilling permits, directional drilling, drilling riser, project management, life rafts, mud logging, crew boats, lease agreements, dynamic positioning (DP), subsea manifolds, rig maintenance, regulatory compliance, operating expenditure, drill ships, semi-submersible rigs, safety systems, and jackup rigs are integral to the industry.
Bottom supported rigs, specifically jack-up rigs and platform rigs, have a significant market share due to their advantages and limitations. The market is characterized by various activities and trends, including capital expenditure, water treatment, helicopter transport, drilling fluids, automated subsea systems, subsea engineering, corrosion protection, waste management, environmental impact assessment, subsea pipelines, mud pumps, drilling permits, directional drilling, drilling riser, project management, life rafts, mud logging, crew boats, lease agreements, dynamic positioning (DP), subsea manifolds, and jackup rigs. The COSL Prospector, a semi-submersible drilling rig, was employed for this deepwater drilling activity.
Regional Analysis
North America is estimated to contribute 40% to the growth of the global market during the forecast period. Technavio's analysts have elaborately explained the regional trends and drivers that shape the market during the forecast period.
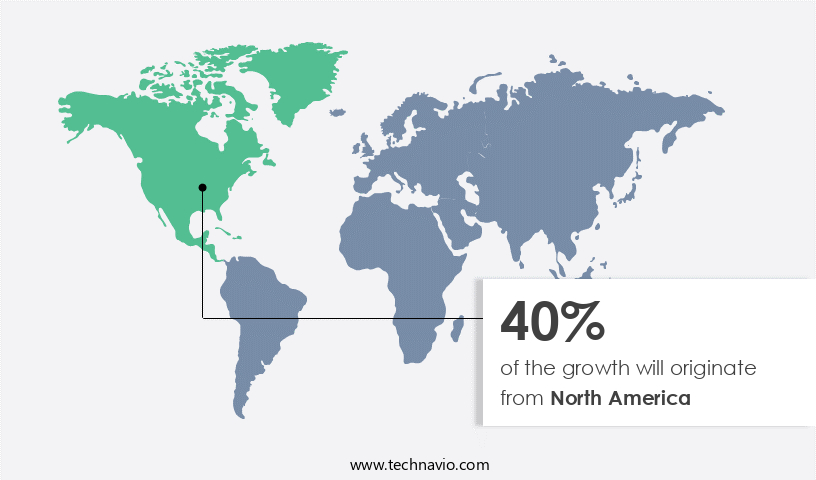
The North American market holds the largest share in the global offshore drilling rigs industry, with the US being the primary revenue contributor. The unpredictable crude oil prices over the past decades have significantly influenced exploration and production activities in the Gulf of Mexico. Despite the fluctuations, the North American market is projected to expand steadily during the forecast period. Key drivers of market growth include increased drilling activities, capital expenditures on offshore projects, and the implementation of advanced technologies such as automated subsea systems, drilling risers, and underwater vehicles (UVS) for enhanced efficiency and safety. Drilling rigs, including JackUp Rigs and Drillships, employ the latest technology, such as artificial neural networks and machine learning, to optimize drilling technologies, equipment, and subsea systems.
Additionally, regulatory compliance, rig maintenance, and waste management are crucial aspects of the market, ensuring environmental impact assessments and safety systems are upheld. Offshore construction, directional drilling, and project management are integral to the industry, with seismic surveys, geotechnical data, and marine cables playing essential roles in exploration and production. The market encompasses various entities, including drilling permits, mud pumps, drilling fluids, corrosion protection, and emergency shutdown systems. Supply chain management, production platforms, power generation, and design engineering are also vital components, contributing to the overall growth and development of the market in North America.
Market Dynamics
Our researchers analyzed the data with 2024 as the base year, along with the key drivers, trends, and challenges. A holistic analysis of drivers will help companies refine their marketing strategies to gain a competitive advantage.
What are the Offshore Drilling Rigs market drivers leading to the rise in the adoption of Industry?
- The upstream oil and gas sector, which has experienced significant investments, serves as the primary driver for market growth. Offshore drilling rigs are in high demand as countries seek to secure energy supplies amidst population growth and industrialization. The production from conventional oilfields is declining, leading oil and gas operators to invest in advanced technologies for deepwater and ultra-deepwater drilling. This trend is driving the deployment of sophisticated offshore drilling rigs, which are capable of operating in challenging environments. Governments and private firms are prioritizing upstream development to ensure energy security. As a result, there is an increase in rig contracts, longer drilling campaigns, and exploration in previously unexplored basins. Regulatory compliance, rig maintenance, and project management are essential considerations for offshore drilling operations.
- Directional drilling, mud logging, and dynamic positioning (DP) are critical technologies used in offshore drilling. Directional drilling enables drilling in multiple directions from a single well, reducing the number of wells required. Mud logging provides real-time data on drilling conditions, while DP ensures the rig remains in the correct position. Offshore drilling rigs require extensive safety measures, including life rafts, subsea manifolds, and rig maintenance. Operating expenditure is a significant cost for offshore drilling operations, making operational efficiency a priority. Investment in offshore drilling rigs is expected to continue as countries seek to maximize revenue from their oil and gas resources.
What are the Offshore Drilling Rigs market trends shaping the Industry?
- The discovery and development of new oil and gas resources have emerged as a significant market trend. This exploration and extraction of hydrocarbons represent a crucial aspect of the energy sector's growth and innovation. Offshore drilling rigs, including drill ships and semi-submersible rigs, play a crucial role in the oil and gas industry as companies seek to discover new resources and expand their production capabilities. The market for offshore drilling rigs has experienced significant growth due to the identification of new reserves in deepwater and ultra-deepwater regions. In 2024, global oil and gas exploration achieved a notable milestone with an average of over 150 million barrels of oil equivalent discovered, nearly double the average of the previous decade. Safety systems, supply chain management, production platforms, power generation, design engineering, seismic surveys, geotechnical data, marine cables, top drives, emergency shutdown systems, and underwater vehicles (UVS) are essential components of offshore drilling rigs.
- These technologies enable efficient and safe drilling operations in challenging environments. Safety is a top priority in offshore drilling, and rig operators invest heavily in advanced safety systems to minimize risks. Supply chain management is another critical aspect, ensuring the timely delivery of essential supplies and services to rigs located in remote areas. Power generation is another significant challenge in offshore drilling, with rigs requiring reliable and efficient power sources to operate drilling equipment and support systems. Design engineering plays a crucial role in developing rigs that can withstand harsh offshore conditions and optimize production. Seismic surveys and geotechnical data are essential for understanding the subsurface geology and identifying potential oil and gas reserves.
How does Offshore Drilling Rigs market faces challenges during its growth?
- The growth of the oil and gas industry is significantly challenged by the environmental concerns associated with Exploration and Production (E&P) activities. These concerns, which include issues such as greenhouse gas emissions, water usage, and waste management, require continuous attention and innovation from industry players to mitigate their impact and ensure sustainable development. Offshore drilling rigs play a crucial role in the exploration and production of oil and gas, which are essential resources for various industries and everyday life. However, offshore drilling operations come with unique challenges, necessitating advanced technologies and robust logistics.
- Structural analysis and underbalanced drilling techniques optimize resource recovery, while reservoir simulation enhances understanding of reservoir behavior. Supply boats transport equipment and personnel to offshore rigs, ensuring smooth operations. In summary, the offshore drilling rig market is driven by the demand for oil and gas and the need for advanced technologies to mitigate environmental risks and optimize resource recovery. Horizontal drilling, for instance, allows for the extraction of oil and gas from deeper and wider reservoirs, while well control systems, including blowout preventers (BOPs), ensure safety and prevent environmental hazards. Oceanographic and meteorological data, along with process control systems, facilitate efficient drilling and formation evaluation.
Exclusive Customer Landscape
The offshore drilling rigs market forecasting report includes the adoption lifecycle of the market, covering from the innovator's stage to the laggard's stage. It focuses on adoption rates in different regions based on penetration. Furthermore, the offshore drilling rigs market report also includes key purchase criteria and drivers of price sensitivity to help companies evaluate and develop their market growth analysis strategies.

Customer Landscape
Key Companies & Market Insights
Companies are implementing various strategies, such as strategic alliances, offshore drilling rigs market forecast, partnerships, mergers and acquisitions, geographical expansion, and product/service launches, to enhance their presence in the industry.
Archer Ltd. - The company specializes in offshore drilling rigs, with its DLS Drilling division delivering advanced and innovative offshore drilling rig solutions for global operations.
The industry research and growth report includes detailed analyses of the competitive landscape of the market and information about key companies, including:
- Archer Ltd.
- China Oilfield Services Ltd.
- Diamond Offshore Drilling Inc.
- Helmerich and Payne Inc.
- KCA Deutag Alpha Ltd.
- Nabors Industries Ltd.
- Noble Corp. Plc
- NOV Inc.
- Parker Drilling Co.
- Patterson UTI Energy Inc.
- PR Marriott Drilling Ltd.
- Precision Drilling Corp.
- Saipem S.p.A.
- Schlumberger Ltd.
- Seadrill Ltd.
- Stena AB
- Transocean Ltd.
- Valaris Ltd.
- Weatherford International Plc
Qualitative and quantitative analysis of companies has been conducted to help clients understand the wider business environment as well as the strengths and weaknesses of key industry players. Data is qualitatively analyzed to categorize companies as pure play, category-focused, industry-focused, and diversified; it is quantitatively analyzed to categorize companies as dominant, leading, strong, tentative, and weak.
Recent Development and News in Offshore Drilling Rigs Market
- In January 2024, Transocean Ltd. Announced the successful deployment of its new Generation 3 semi-submersible drilling rig, the "Joan Cornelia G" in the North Sea. This advanced rig is capable of drilling in water depths up to 3,000 meters and is expected to enhance Transocean's market presence in deepwater drilling (Transocean Ltd. Press Release, January 2024).
- In March 2024, Saipem, an Italian oilfield services company, entered into a strategic partnership with Equinor, a leading energy company, to provide engineering, procurement, construction, and installation (EPCI) services for Equinor's Johan Sverdrup Phase 2 project in the North Sea. This collaboration is expected to strengthen Saipem's position in the European offshore drilling market (Saipem Press Release, March 2024).
- In May 2024, Schlumberger Limited, a global technology company, completed the acquisition of Cameron International Corporation, a leading manufacturer of equipment and services for the oil and gas industry. This acquisition is expected to expand Schlumberger's product and service offerings, particularly in the drilling and production segments of the offshore drilling rig market (Schlumberger Ltd. Press Release, May 2024).
- In February 2025, the United States Bureau of Ocean Energy Management (BOEM) approved Shell's plan to drill in the Lease Area OCS-A-0488 in the Gulf of Mexico. This approval marks a significant step forward in the development of Shell's Vito oil field, which is estimated to contain up to 1 billion barrels of oil (BOEM Press Release, February 2025).
Research Analyst Overview
The market is characterized by its continuous evolution and dynamic nature, with various entities interconnected to ensure efficient and productive operations. Drill ships and semi-submersible rigs form the backbone of this industry, with safety systems and supply chain management playing crucial roles in their effective deployment. Production platforms, power generation, and design engineering are integral components, ensuring seamless integration of advanced technologies such as automated subsea systems, corrosion protection, and underwater vehicles (UVs). Seismic surveys and geotechnical data are essential in understanding the subsurface conditions, while marine cables, mud pumps, and drilling permits facilitate drilling operations.
Directional drilling and horizontal drilling enable access to reservoirs in complex geological formations, with well control systems, blowout preventers (BOPs), and emergency shutdown systems ensuring safety and environmental compliance. Operational expenditure (OPEX) and capital expenditure (CAPEX) are key considerations, with project management, rig maintenance, and regulatory compliance ensuring optimal performance and longevity. Offshore logistics, including helicopter transport and crew boats, facilitate personnel and equipment movement. Oceanographic data, meteorological data, formation evaluation, structural analysis, underbalanced drilling, reservoir simulation, and jackup rigs further expand the market's scope. This intricate web of interconnected components is subject to constant change, with ongoing advancements in technology, regulatory requirements, and market conditions shaping the market's future trajectory.
Marine cables provide power and communication links between the rig and support vessels, while top drives enable the drill string to be rotated and maintained at a constant torque. Emergency shutdown systems and underwater vehicles are used for inspections, maintenance, and emergency response. The offshore drilling rig market is expected to continue growing as oil and gas companies seek to meet increasing demand and expand their resource base. Innovations in technology and design will be key drivers of growth, enabling more efficient and cost-effective drilling operations in challenging environments. The market dynamics are driven by factors such as increasing demand for energy, declining conventional oilfield production, and technological advancements in drilling and production techniques.
Dive into Technavio's robust research methodology, blending expert interviews, extensive data synthesis, and validated models for unparalleled Offshore Drilling Rigs Market insights. See full methodology.
|
Market Scope |
|
|
Report Coverage |
Details |
|
Page number |
217 |
|
Base year |
2024 |
|
Historic period |
2019-2023 |
|
Forecast period |
2025-2029 |
|
Growth momentum & CAGR |
Accelerate at a CAGR of 6.3% |
|
Market growth 2025-2029 |
USD 23.76 billion |
|
Market structure |
Fragmented |
|
YoY growth 2024-2025(%) |
5.8 |
|
Key countries |
US, China, Saudi Arabia, Canada, India, Russia, Norway, UK, Brazil, and Nigeria |
|
Competitive landscape |
Leading Companies, Market Positioning of Companies, Competitive Strategies, and Industry Risks |
What are the Key Data Covered in this Offshore Drilling Rigs Market Research and Growth Report?
- CAGR of the Offshore Drilling Rigs industry during the forecast period
- Detailed information on factors that will drive the growth and forecasting between 2025 and 2029
- Precise estimation of the size of the market and its contribution of the industry in focus to the parent market
- Accurate predictions about upcoming growth and trends and changes in consumer behaviour
- Growth of the market across North America, Middle East and Africa, APAC, Europe, and South America
- Thorough analysis of the market's competitive landscape and detailed information about companies
- Comprehensive analysis of factors that will challenge the offshore drilling rigs market growth of industry companies
We can help! Our analysts can customize this offshore drilling rigs market research report to meet your requirements.
 RIA -
RIA - 
